Loading video…

 24 Concepts
 2.9K views

Video Summary: What Is the Saving Function
Ever wonder why some Americans can afford to save thousands annually while others live paycheck to paycheck? The saving function reveals the mathematical relationship between how much income households have and how much they choose to save. For instance, a family earning $50,000 in disposable income might save $2,500, while one earning $100,000 could save $15,000, this pattern follows predictable economic principles. Understanding What is The Saving Function helps explain these everyday financial behaviors through clear formulas and real-world applications. Watch the full video on JoVE Coach to master this concept with expert-led visuals and step-by-step explanations.
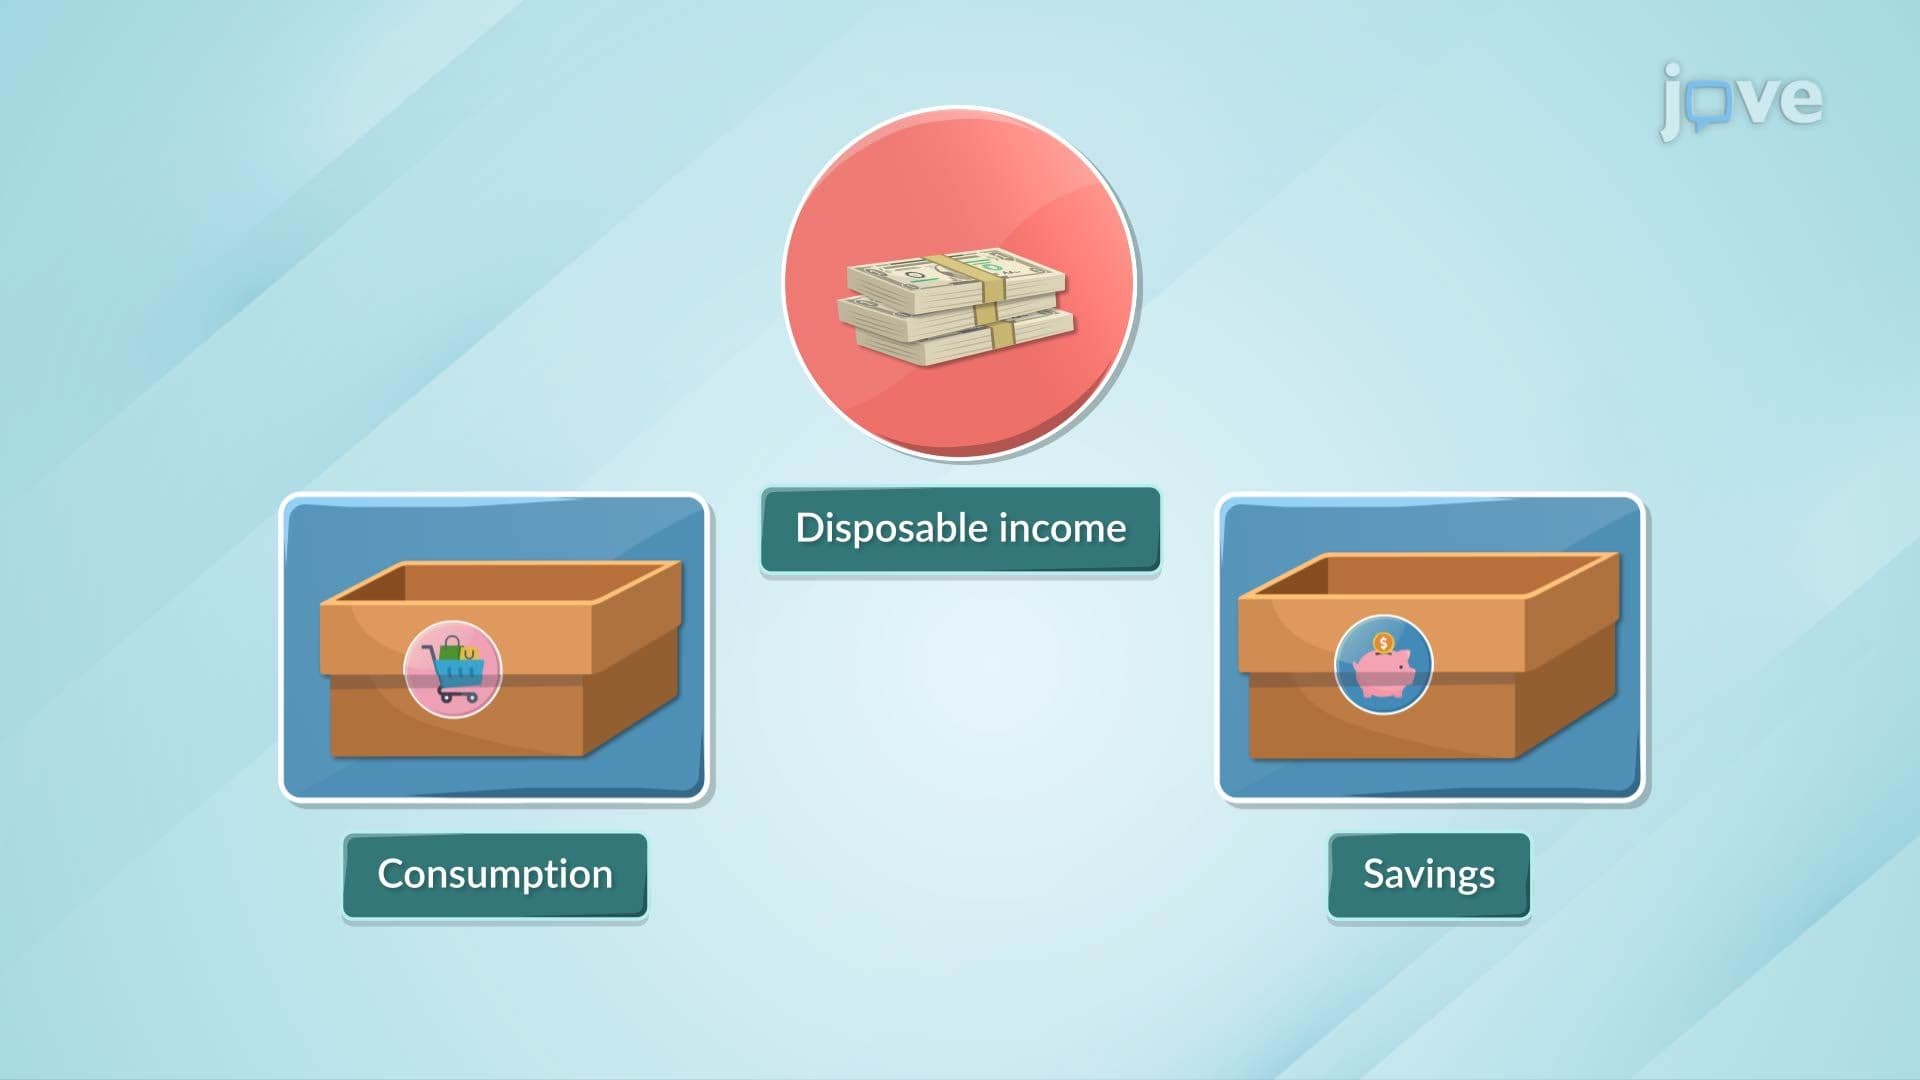
The saving function serves as a fundamental tool in macroeconomics, illustrating how American households allocate their disposable income between consumption and savings. This economic relationship becomes crucial when analyzing everything from individual family budgets to national economic policy. Unlike simple budgeting advice, the saving function provides a mathematical framework that economists use to predict and understand saving behavior across different income levels.
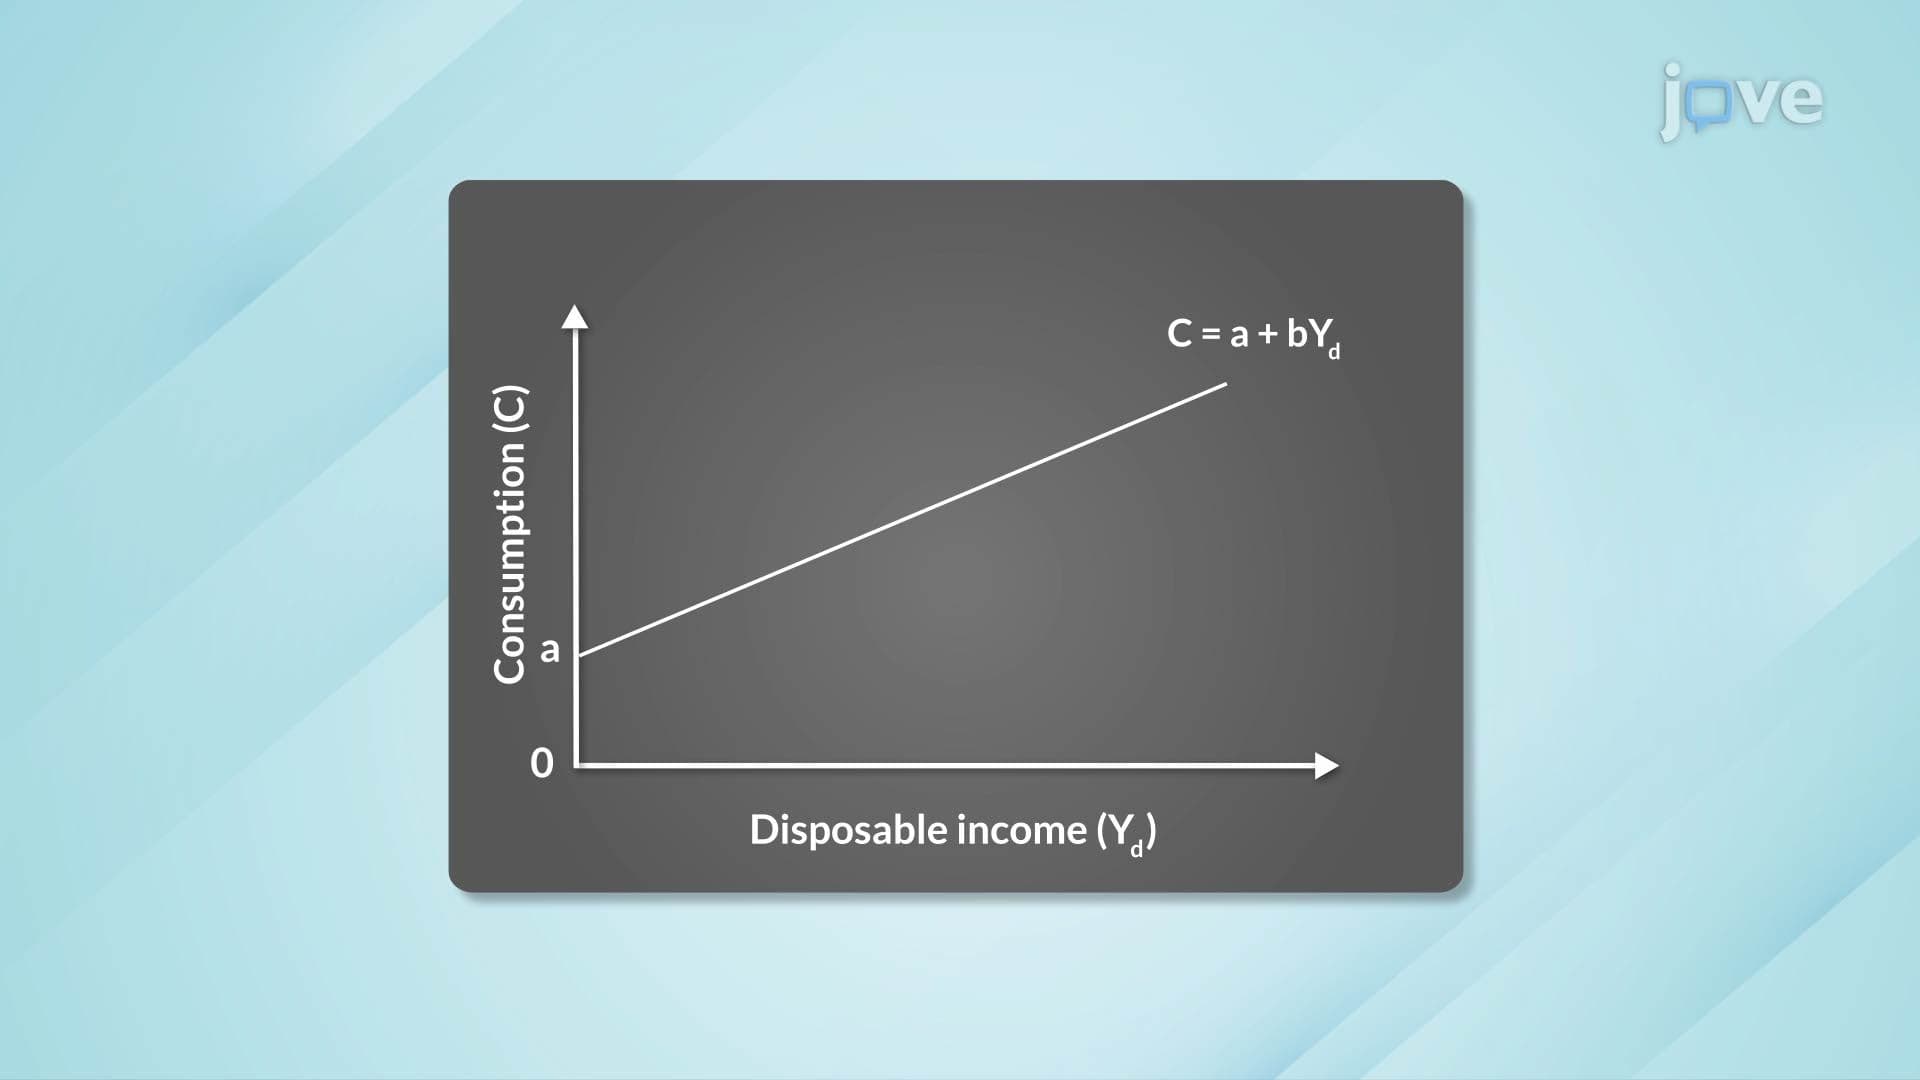
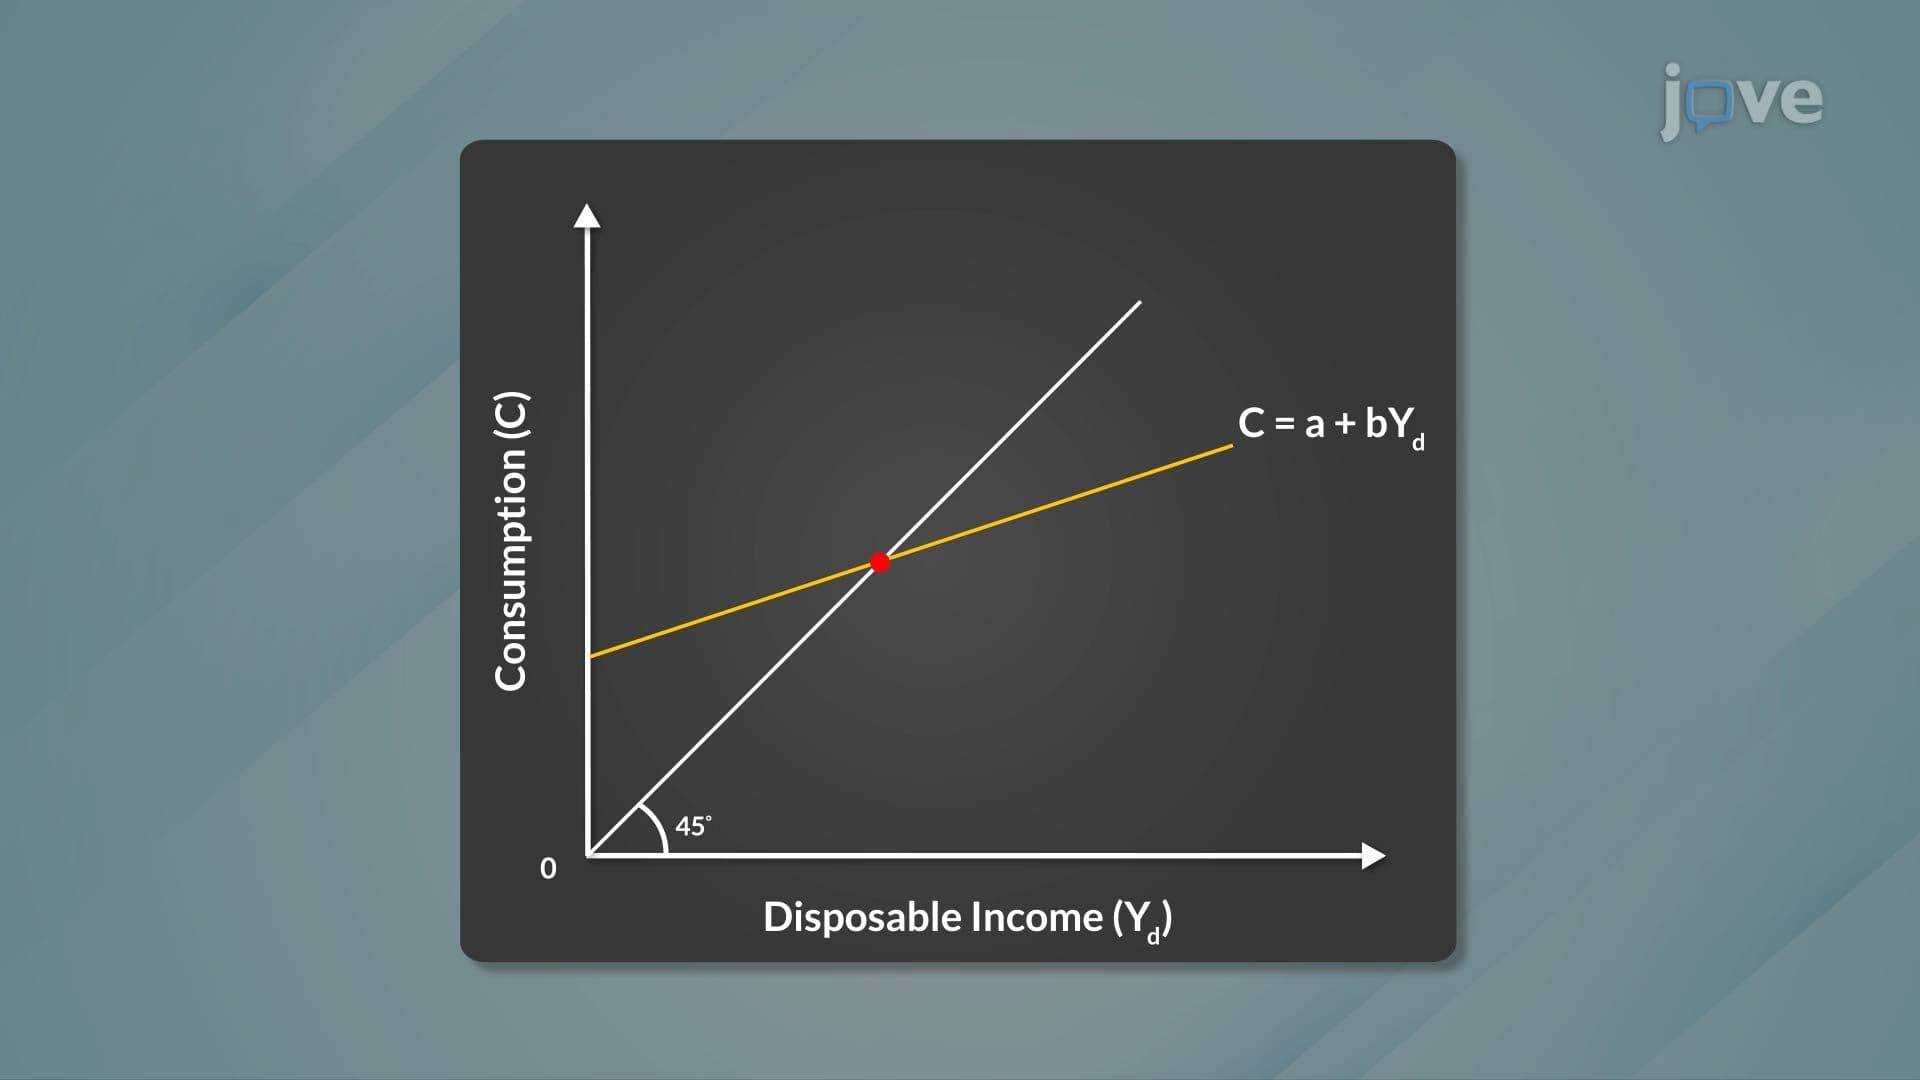
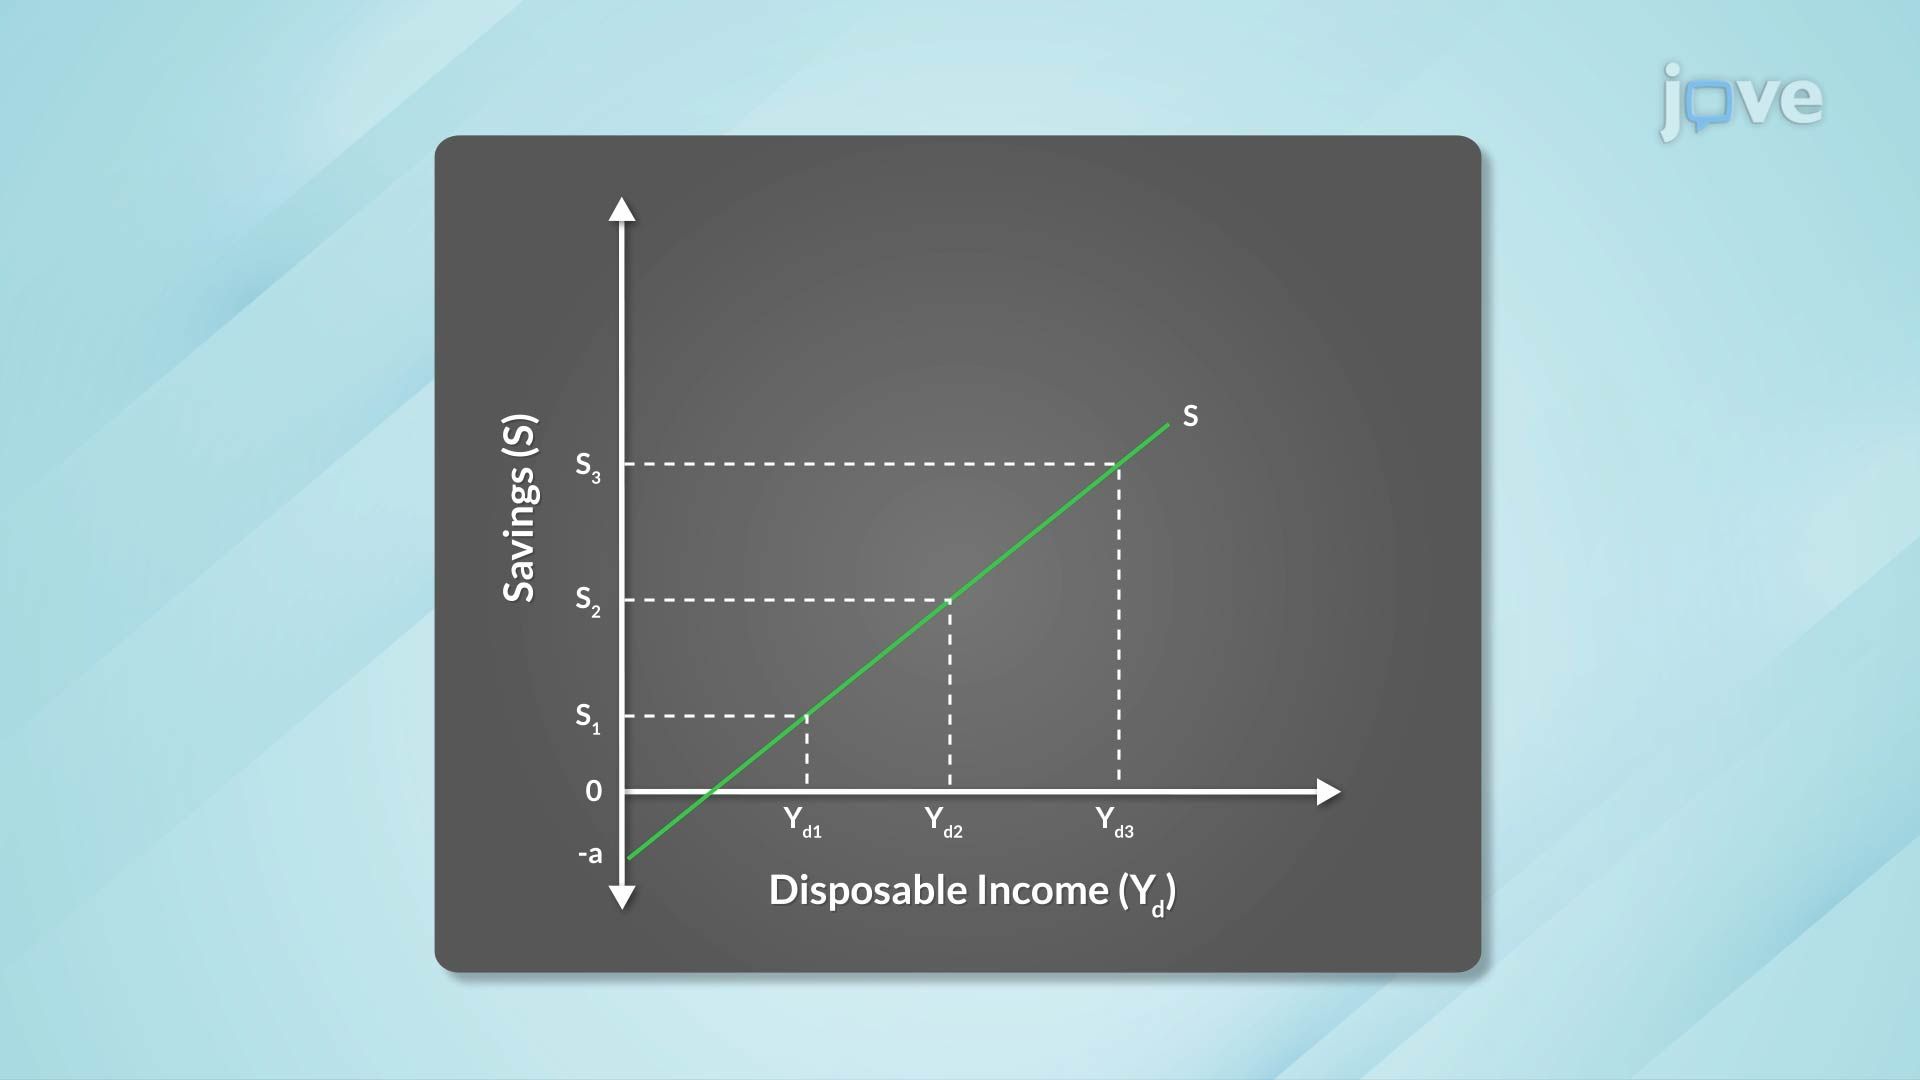
The core saving function formula, S = Yd - C, establishes that savings (S) equal disposable income (Yd) minus consumption (C). When economists substitute the consumption function C = a + bYd into this equation, they derive S = -a + (1-b)Yd. Here, the intercept (-a) typically shows negative values, representing the reality that households with zero income must borrow or dissave to meet basic needs. For example, an unemployed American family might have -$200 in monthly savings, meaning they're spending $200 more than they earn through borrowing or depleting existing savings.
The slope of the saving function, represented by (1-b) or the marginal propensity to save (MPS), reveals how much additional income Americans typically save. If the MPS equals 0.25, then for every extra dollar of disposable income, households save 25 cents and consume 75 cents. This concept proves essential for AP Economics students and appears frequently on college macroeconomics exams. Real-world applications include analyzing how tax rebates affect national savings rates or predicting consumer behavior during economic stimulus programs.
Consider a typical American household earning $60,000 annually in disposable income with a saving function of S = -500 + 0.2Yd. This household saves $11,500 per year, demonstrating positive savings behavior. However, a household earning only $20,000 would have S = -500 + 0.2(20,000) = $3,500 in savings, still positive but representing a much smaller financial cushion. These calculations help explain why lower-income families often struggle to build emergency funds, while higher-income households can accumulate substantial wealth over time. Understanding these patterns becomes crucial for students preparing for standardized tests like the SAT Subject Tests or college placement exams, where economic literacy increasingly appears in word problems and data interpretation questions.
Related Micro-courses