Loading subject page…


1,442 views

Video Summary: What Is Consumer Surplus Graphical Explanation
Ever wonder why you feel like you got a "good deal" when buying your favorite Starbucks drink? Consumer surplus graphical explanation reveals the hidden value consumers gain when market prices fall below what they're actually willing to pay. Picture three college students buying $3 muffins after band practice-one values his muffin at $9, creating a $6 consumer surplus that represents real economic benefit. Watch the full video on JoVE Coach to master this concept with expert-led visuals and step-by-step explanations.
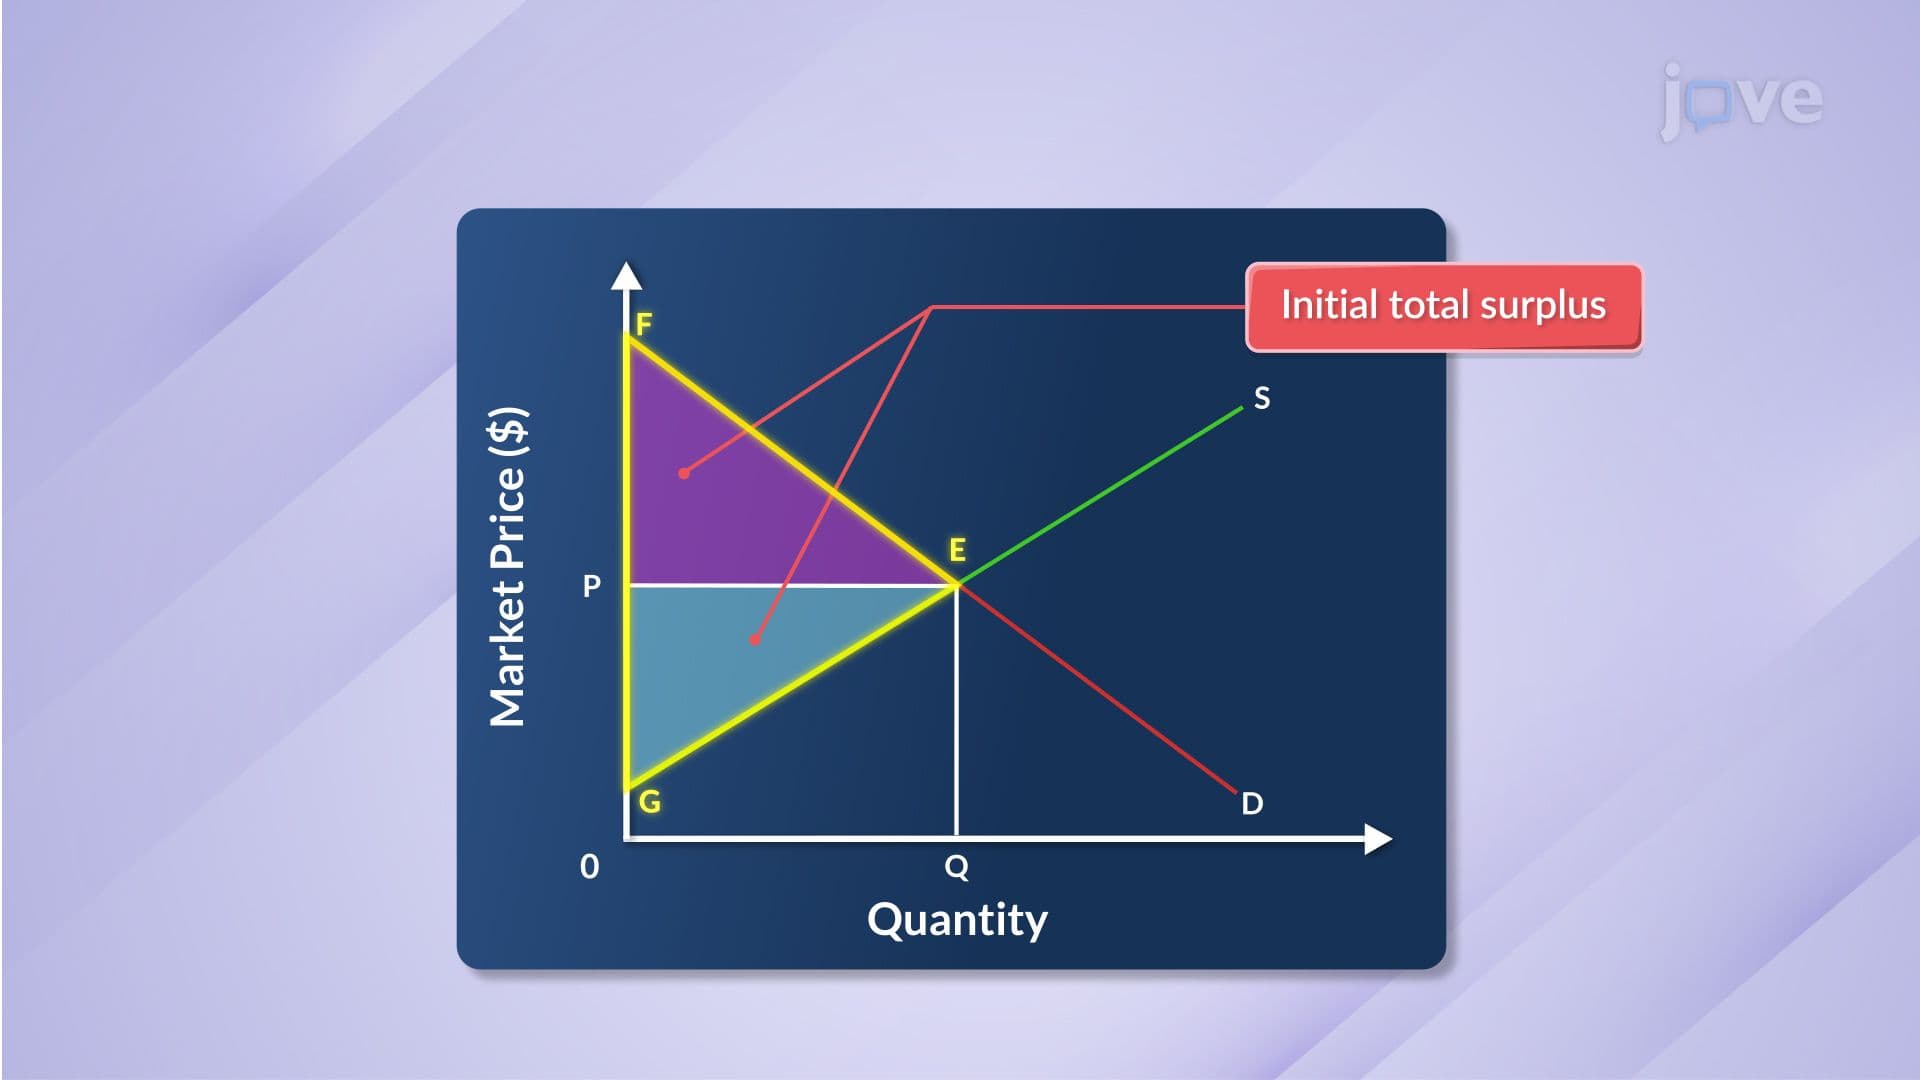
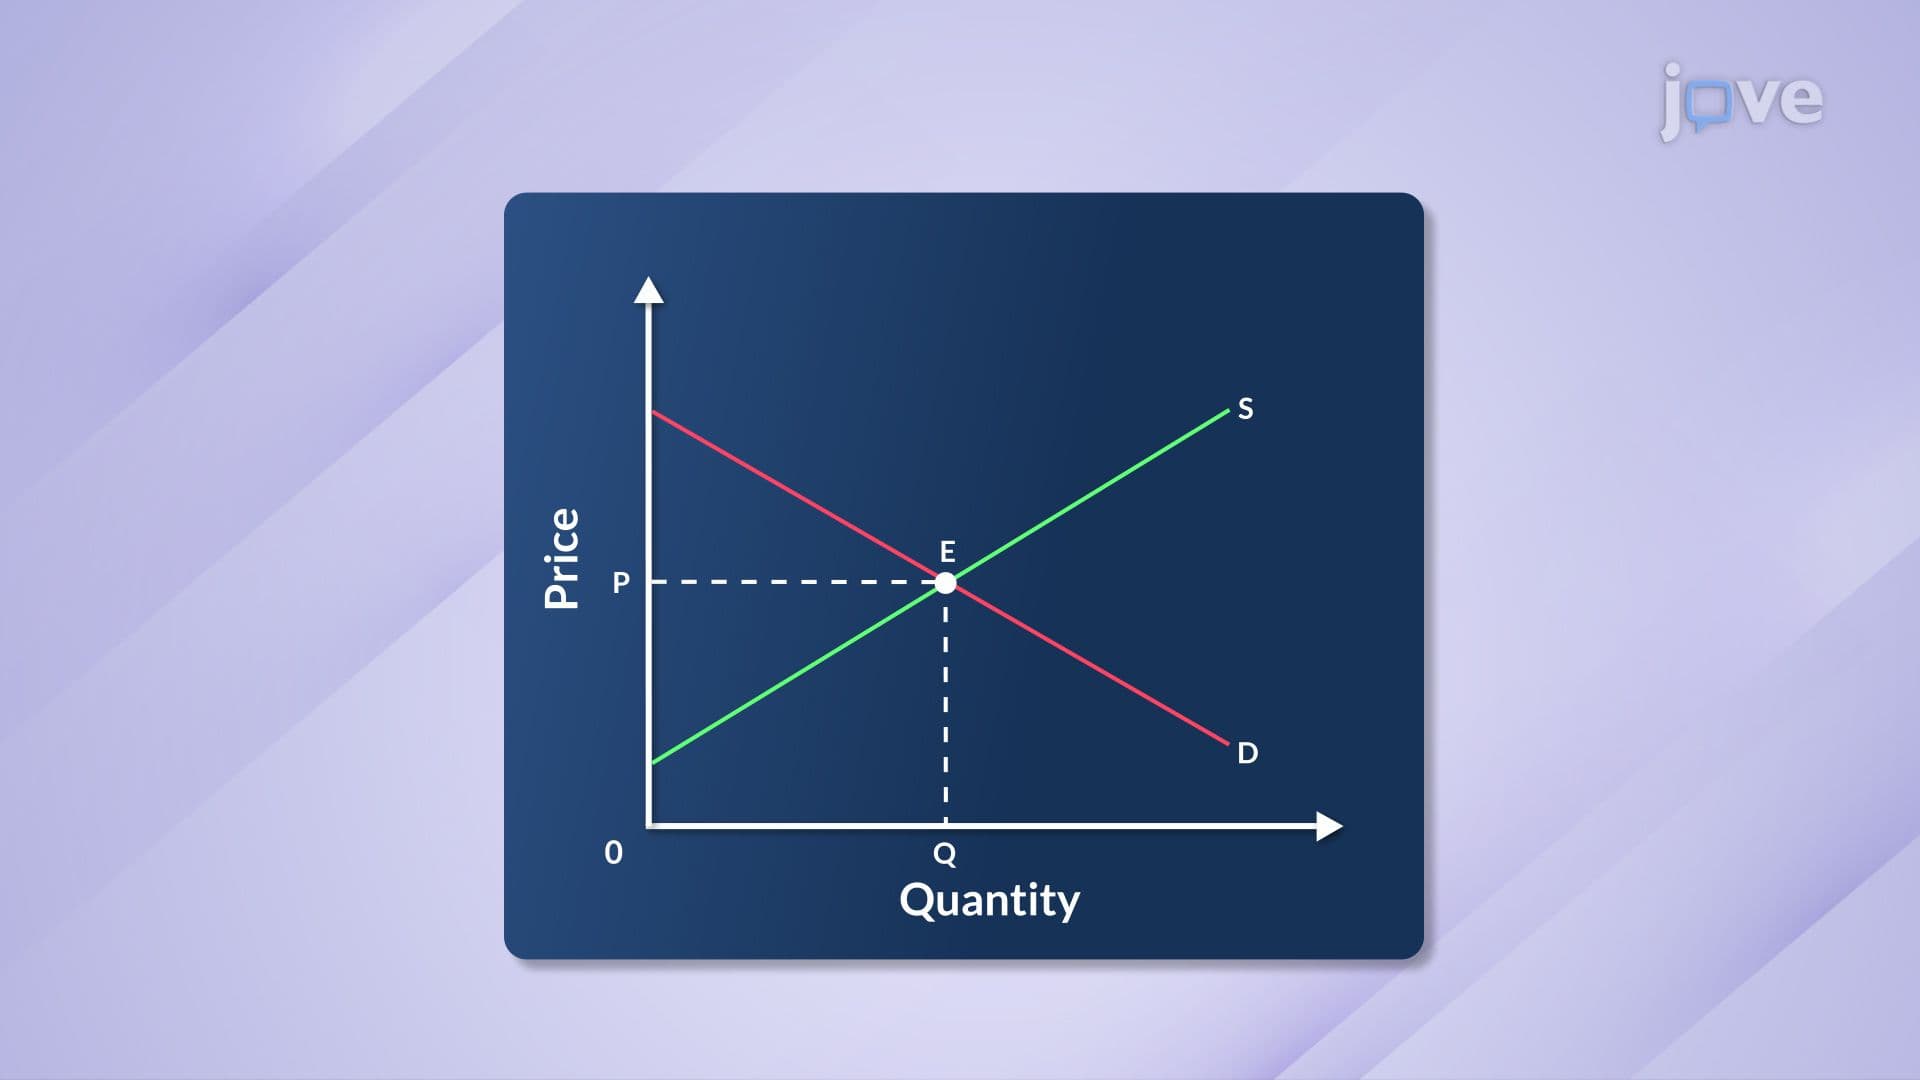
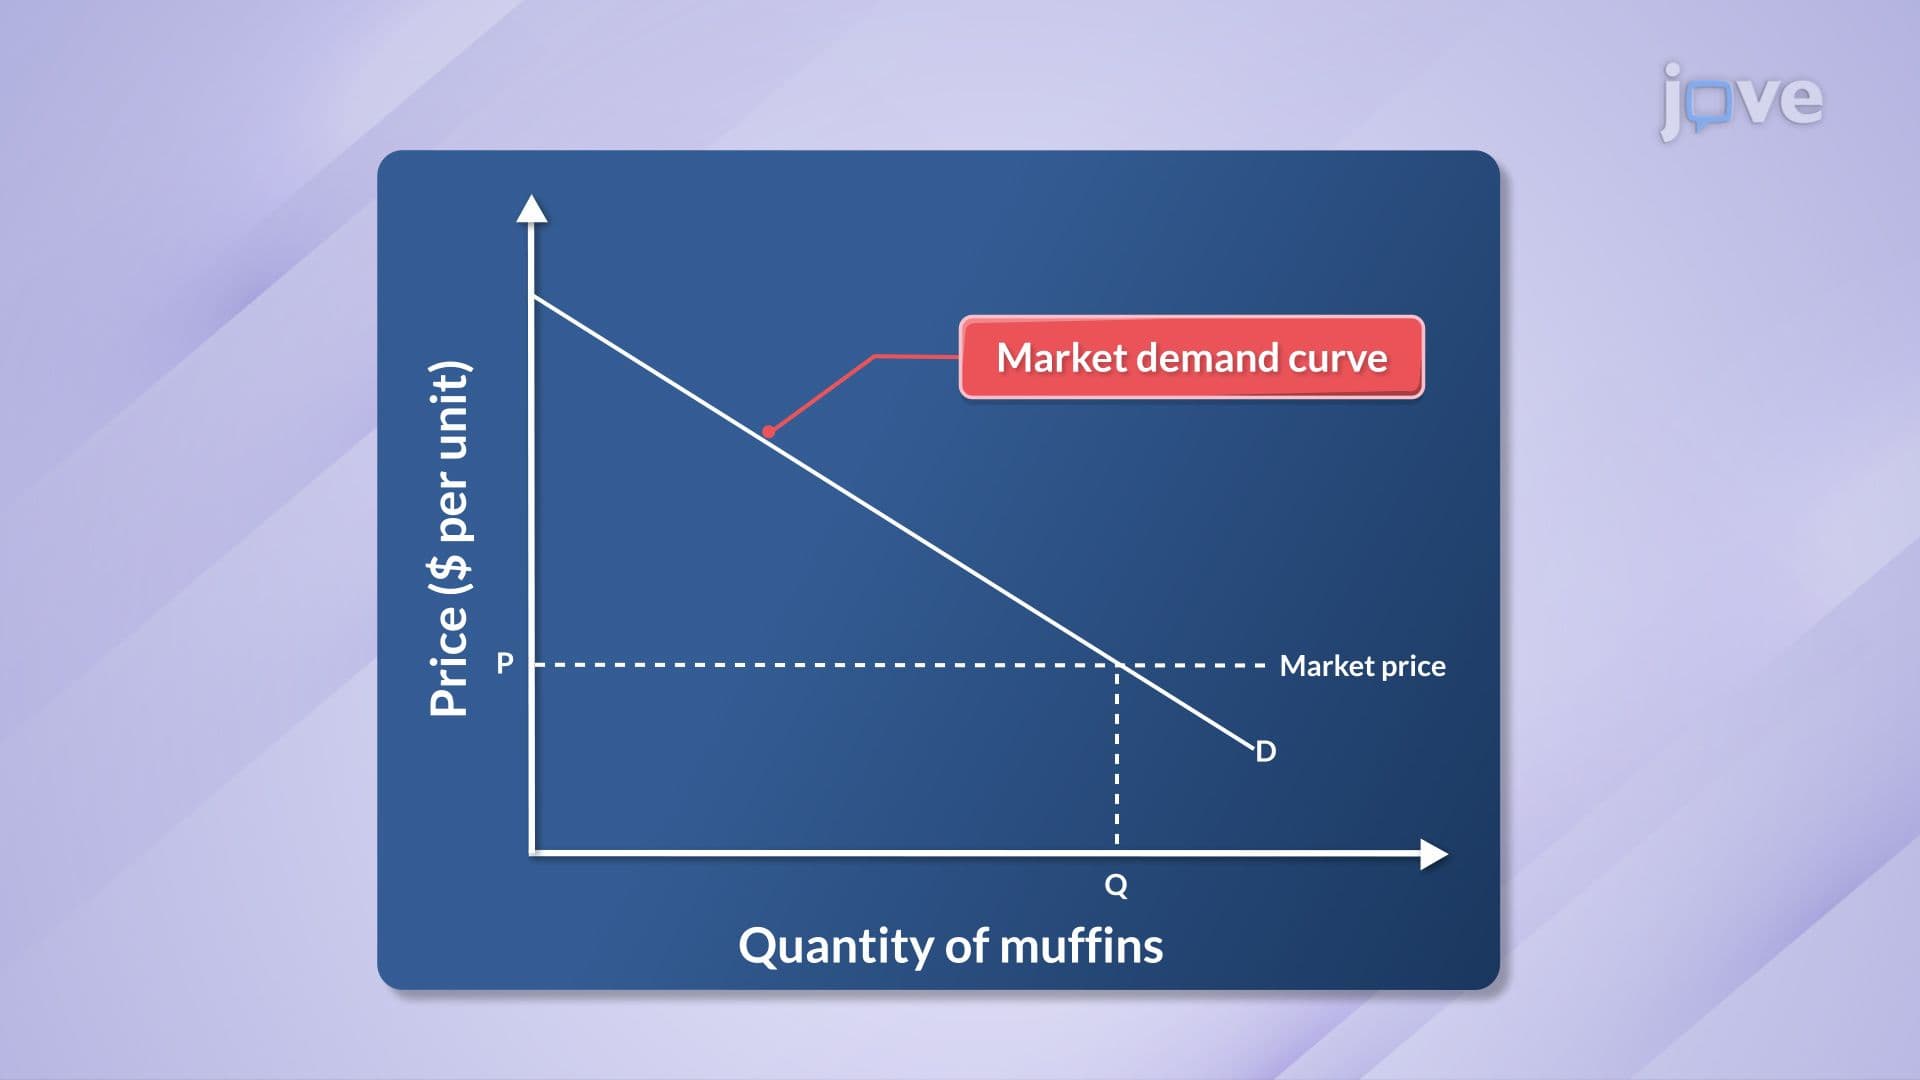
Consumer surplus graphical explanation represents one of microeconomics' most powerful tools for measuring consumer welfare. This concept quantifies the monetary benefit consumers receive when they pay less than their maximum willingness to pay. On a demand curve graph, consumer surplus appears as the triangular area above the market price line and below the demand curve, extending from zero quantity to the equilibrium quantity sold.
Individual consumer surplus calculations follow a straightforward formula: Consumer Surplus = Willingness to Pay - Market Price. Consider Netflix subscriptions priced at $15 monthly. If Sarah values her subscription at $25, her consumer surplus equals $10. When multiplied across millions of subscribers with varying valuations, this creates substantial market-wide consumer surplus.
The market consumer surplus triangle has two key dimensions. The base equals the total quantity sold at market price, while the height represents the difference between the demand choke price (where quantity demanded drops to zero) and the actual market price. This geometric relationship makes consumer surplus easy to calculate: Area = 0.5 × Base × Height.
Consumer surplus appears throughout American commerce. During Black Friday sales at Target or Amazon Prime Day, the gap between original prices and sale prices creates massive consumer surplus spikes. Similarly, when gasoline prices drop from $4.00 to $3.00 per gallon, drivers who would pay $4.50 experience increased consumer surplus of $1.50 per gallon purchased.
AP Economics students encounter consumer surplus problems requiring graph analysis and calculation skills. College microeconomics courses emphasize consumer surplus in welfare analysis, market efficiency discussions, and policy evaluation. SAT Subject Test Economics questions frequently test students' ability to identify consumer surplus areas on demand curve diagrams and calculate numerical values from given data.
Understanding consumer surplus prepares students for advanced topics like deadweight loss, price discrimination, and market regulation effects. This foundational concept bridges individual consumer behavior with broader economic welfare analysis, making it essential for students pursuing business, economics, or public policy careers.
Related Micro-courses