Loading video…


 13 Concepts
 49.7K views

Video Summary: What are Pv Diagrams
Ever wonder why steam engines revolutionized American industry in the 1800s? Pv diagrams reveal the secret behind pressure-volume relationships that power everything from car engines to refrigeration systems. These graphical tools show how gases behave under different temperature conditions, with ideal gases following predictable hyperbolic curves called isotherms. Watch the full video on JoVE Coach to master this concept with expert-led visuals and step-by-step explanations.
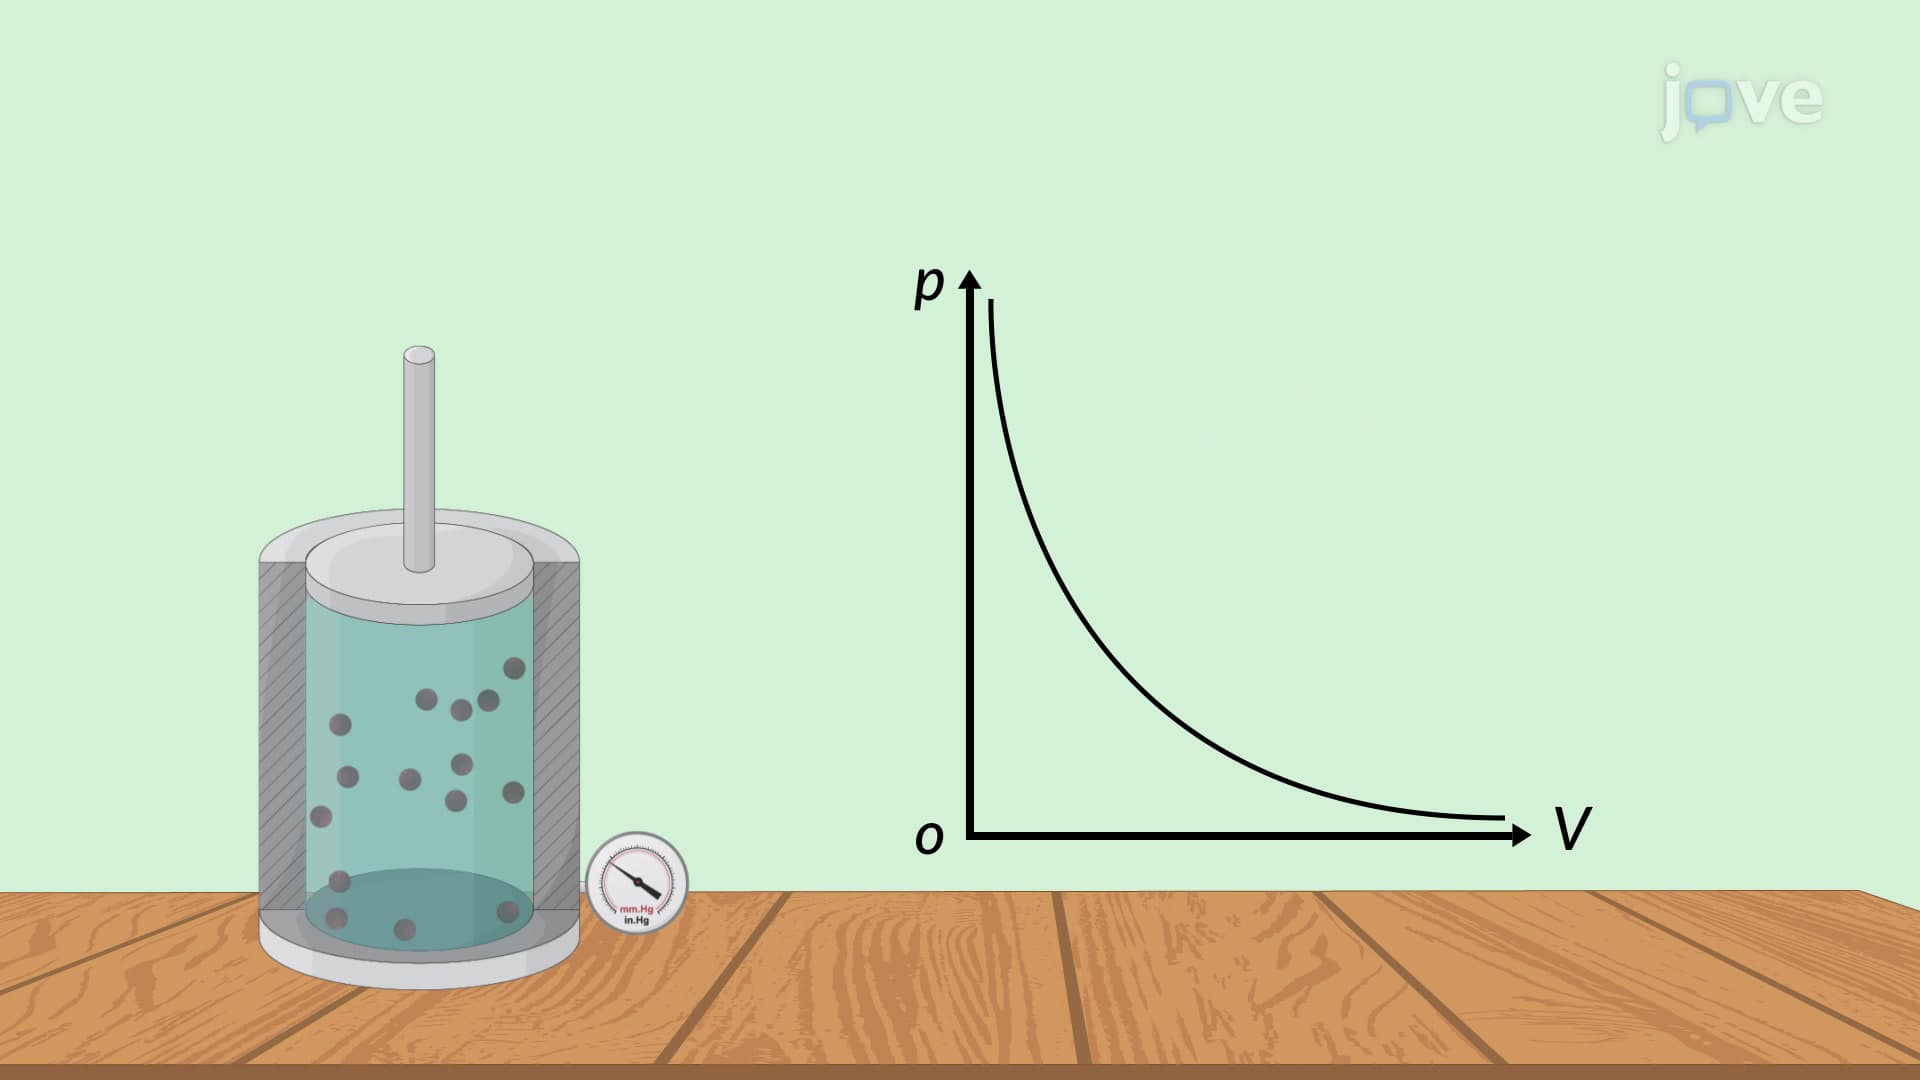
Pv diagrams serve as essential visual tools in thermodynamics, plotting pressure (P) on the y-axis against volume (V) on the x-axis. These diagrams reveal fundamental gas behavior patterns that engineers and scientists use to design everything from automotive engines to HVAC systems in American buildings. For ideal gases, the mathematical relationship PV = nRT (where n is moles, R is the gas constant, and T is temperature) creates distinctive hyperbolic curves called isotherms when temperature remains constant.
Different types of pv diagrams emerge depending on the gas type and conditions studied. Ideal gas isotherms appear as smooth hyperbolas, with higher temperature curves positioned further from the origin. However, real gases like water vapor or carbon dioxide show more complex behavior. At room temperature, these gases approximate ideal behavior, but as temperatures drop toward critical values, significant deviations occur. This knowledge proves crucial for AP Chemistry students tackling gas law problems and college engineering students studying thermodynamic cycles.
The most fascinating aspect of pv diagrams involves phase transition regions where gases liquify. Below critical temperature, isotherms develop horizontal segments representing constant-pressure phase changes. During these transitions, volume changes dramatically while pressure remains steady-explaining why steam condensation releases substantial energy in power plants. The critical temperature represents a fundamental property where gas and liquid phases become indistinguishable, a concept frequently tested on MCAT physical sciences sections.
Understanding pv diagrams overview extends beyond theoretical knowledge into practical applications. Automotive engineers use these relationships to optimize engine compression ratios, while refrigeration technicians apply phase transition principles to design cooling systems. For students preparing for standardized exams, these concepts appear regularly on AP Physics and Chemistry tests, college thermodynamics midterms, and professional engineering licensure examinations. Mastering pv diagram interpretation provides foundation knowledge for advanced topics like entropy, heat engines, and refrigeration cycles that define modern American industrial processes.
Related Micro-courses