Loading video…


 19 Concepts
 112.2K views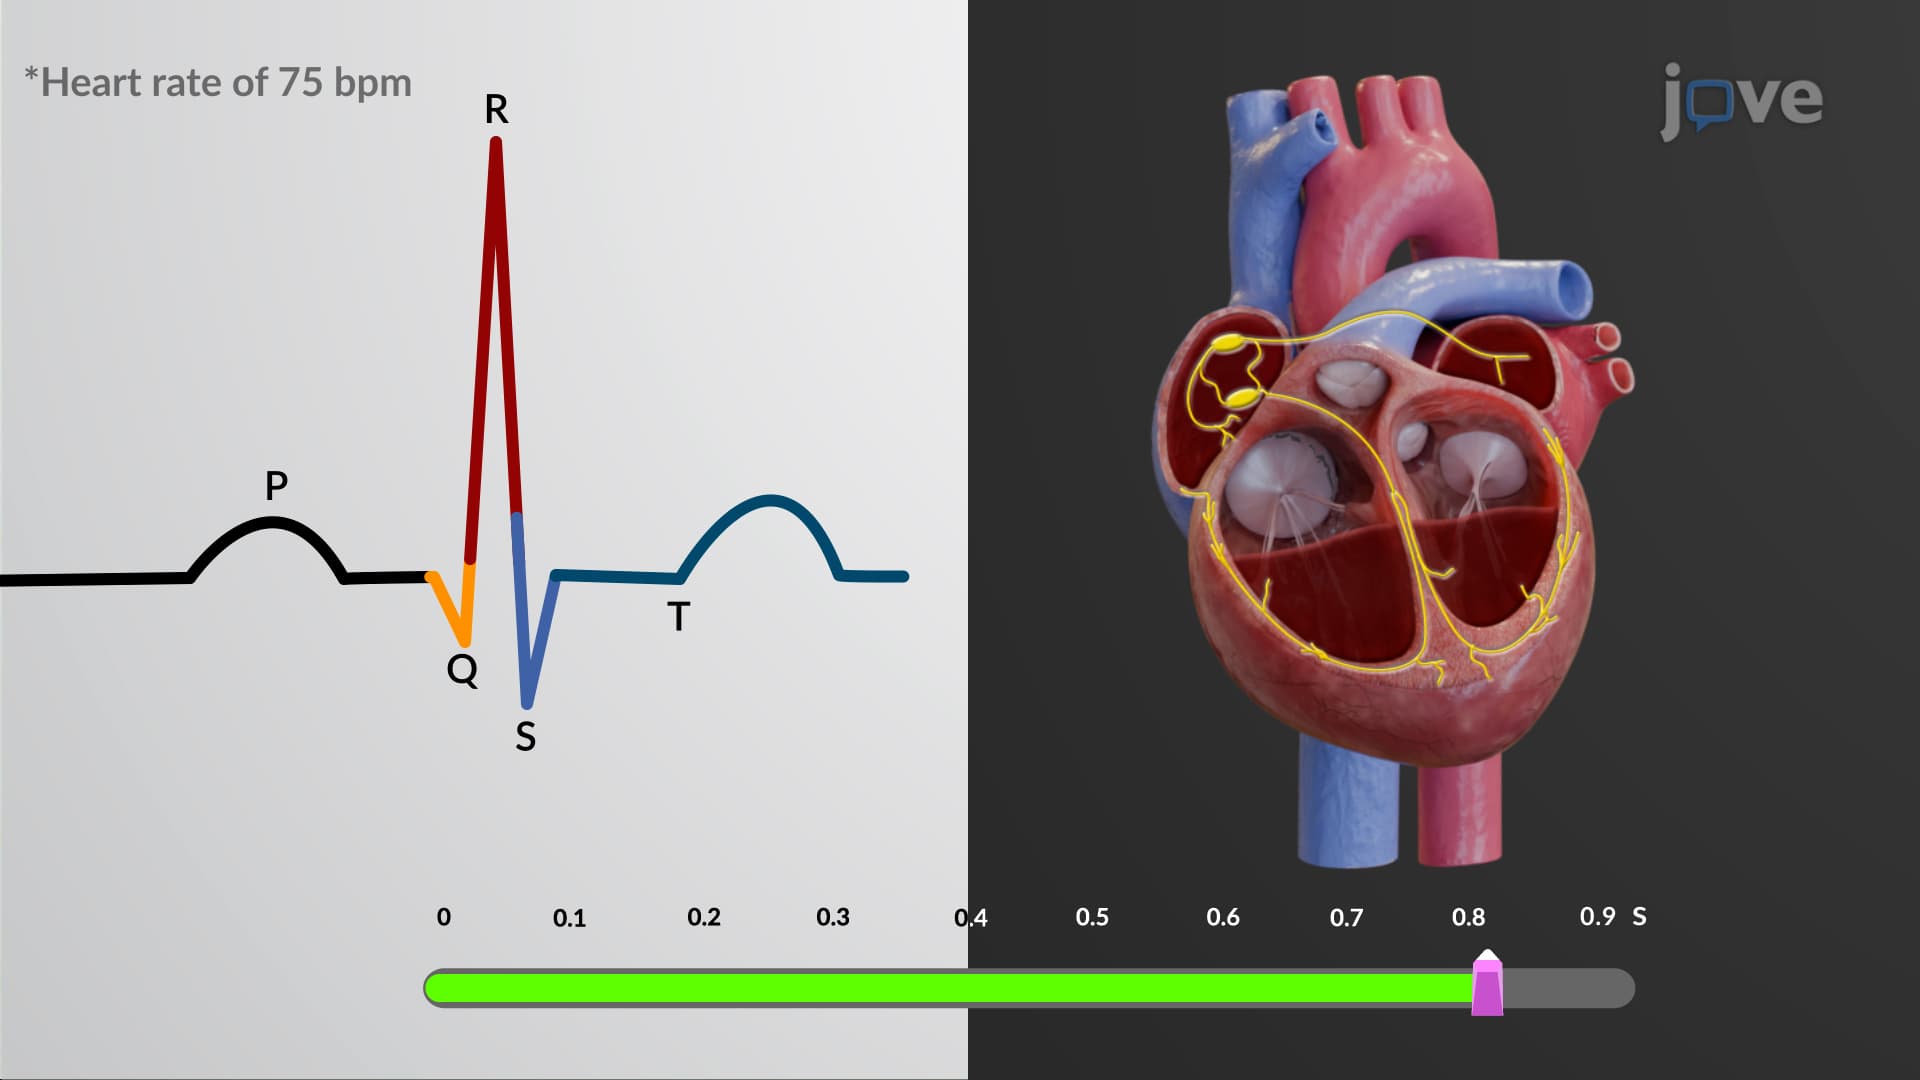

Video Summary: Correlation Between Ecg and Cardiac Cycle Explained
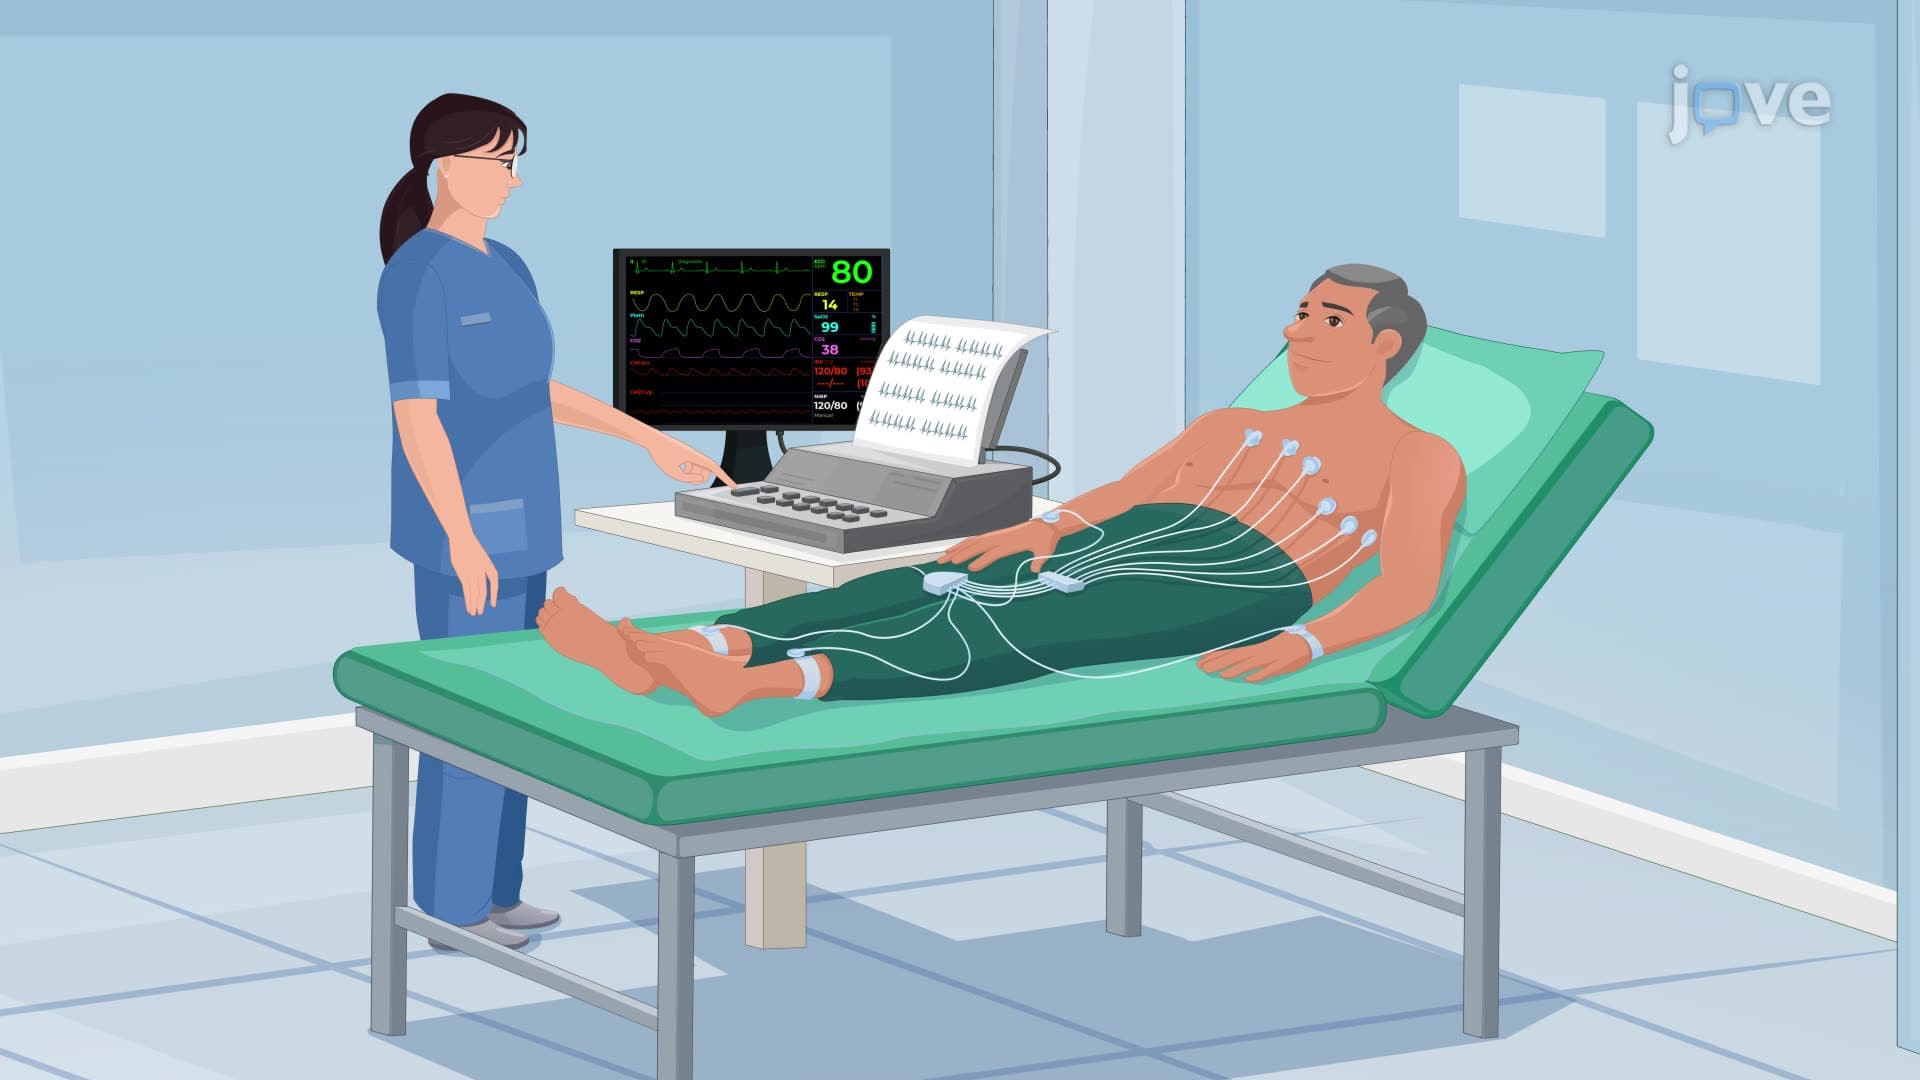
Ever wondered why doctors can predict your heart's mechanical pumping just by looking at electrical squiggles on an ECG? The ECG cardiac cycle correlation reveals that electrical signals precede every heartbeat by precise milliseconds. When a cardiologist at Cleveland Clinic reads an ECG, they're essentially seeing the future-electrical events that will trigger mechanical contractions 0.1 to 0.2 seconds later. Understanding the Correlation Between ECG And Cardiac Cycle Explained helps decode this fascinating electrical-mechanical relationship. Watch the full video on JoVE Coach to master this concept with expert-led visuals and step-by-step explanations.
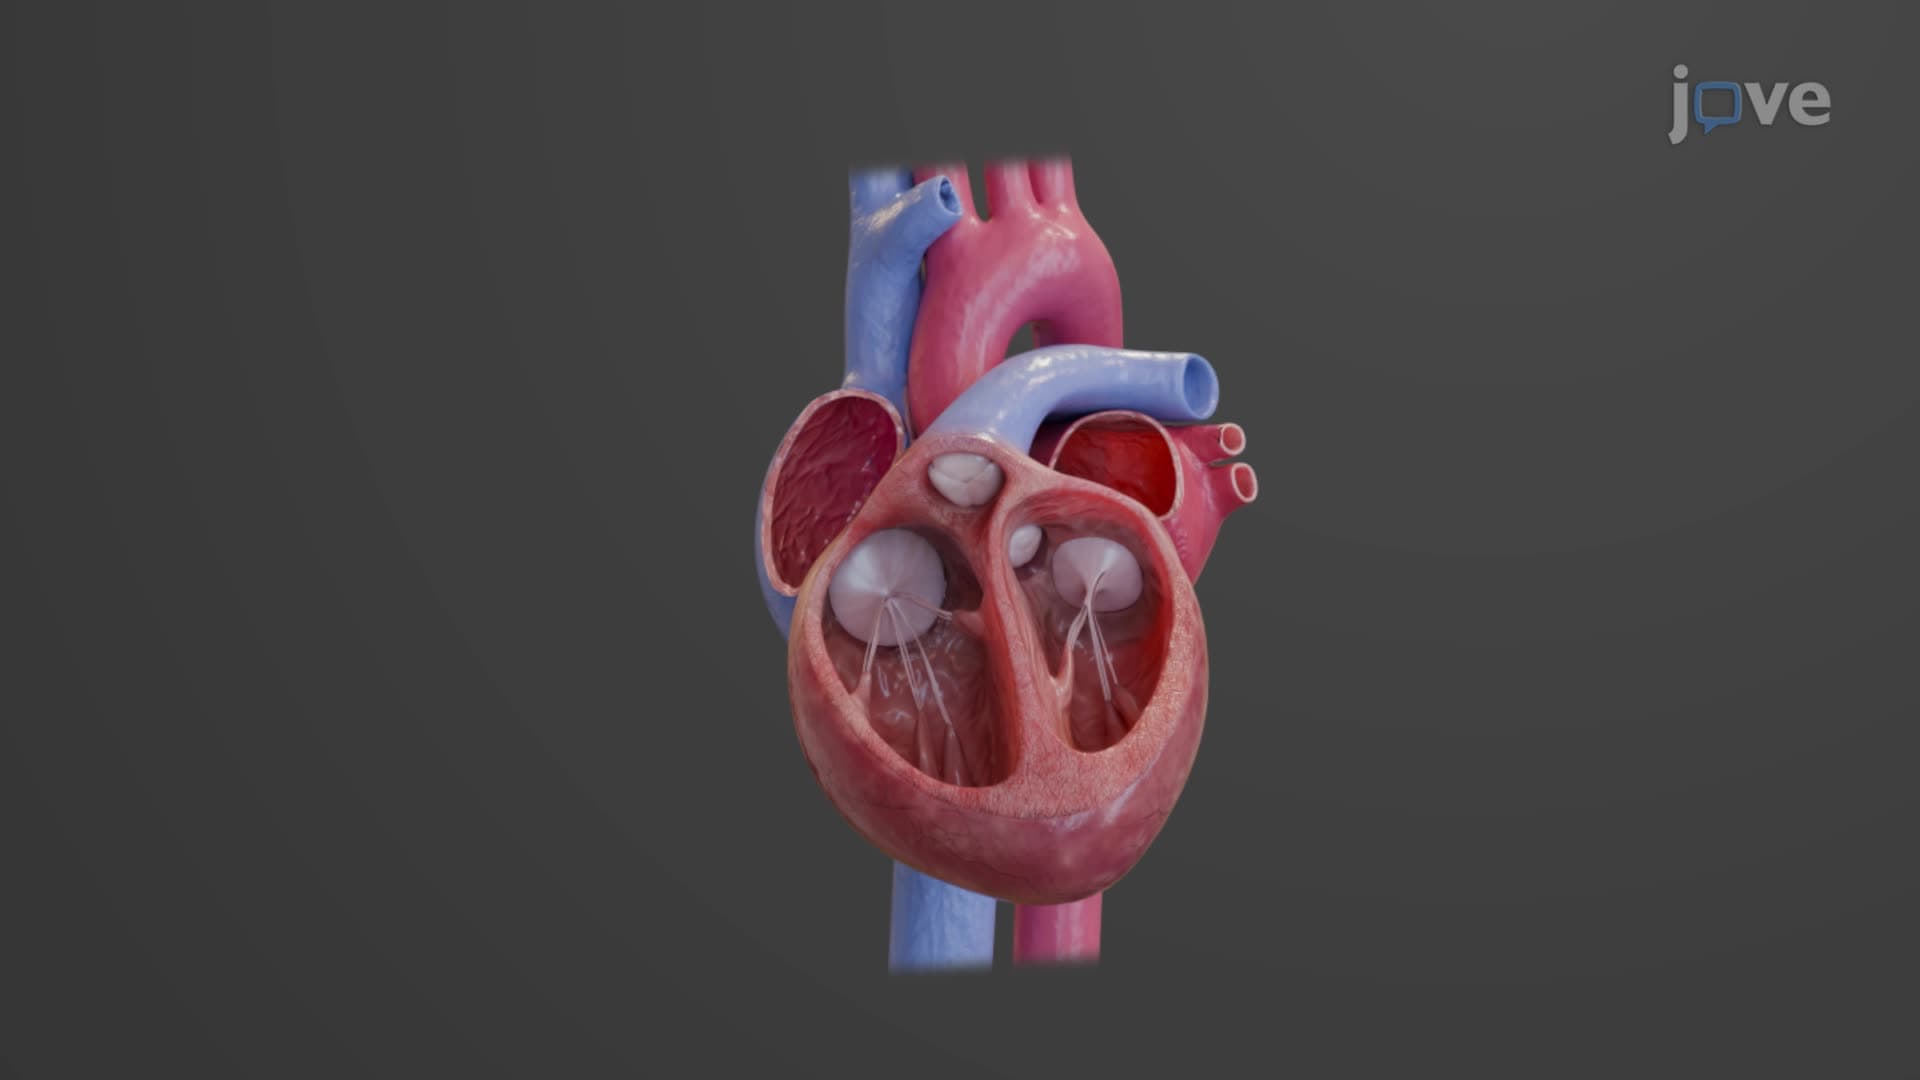
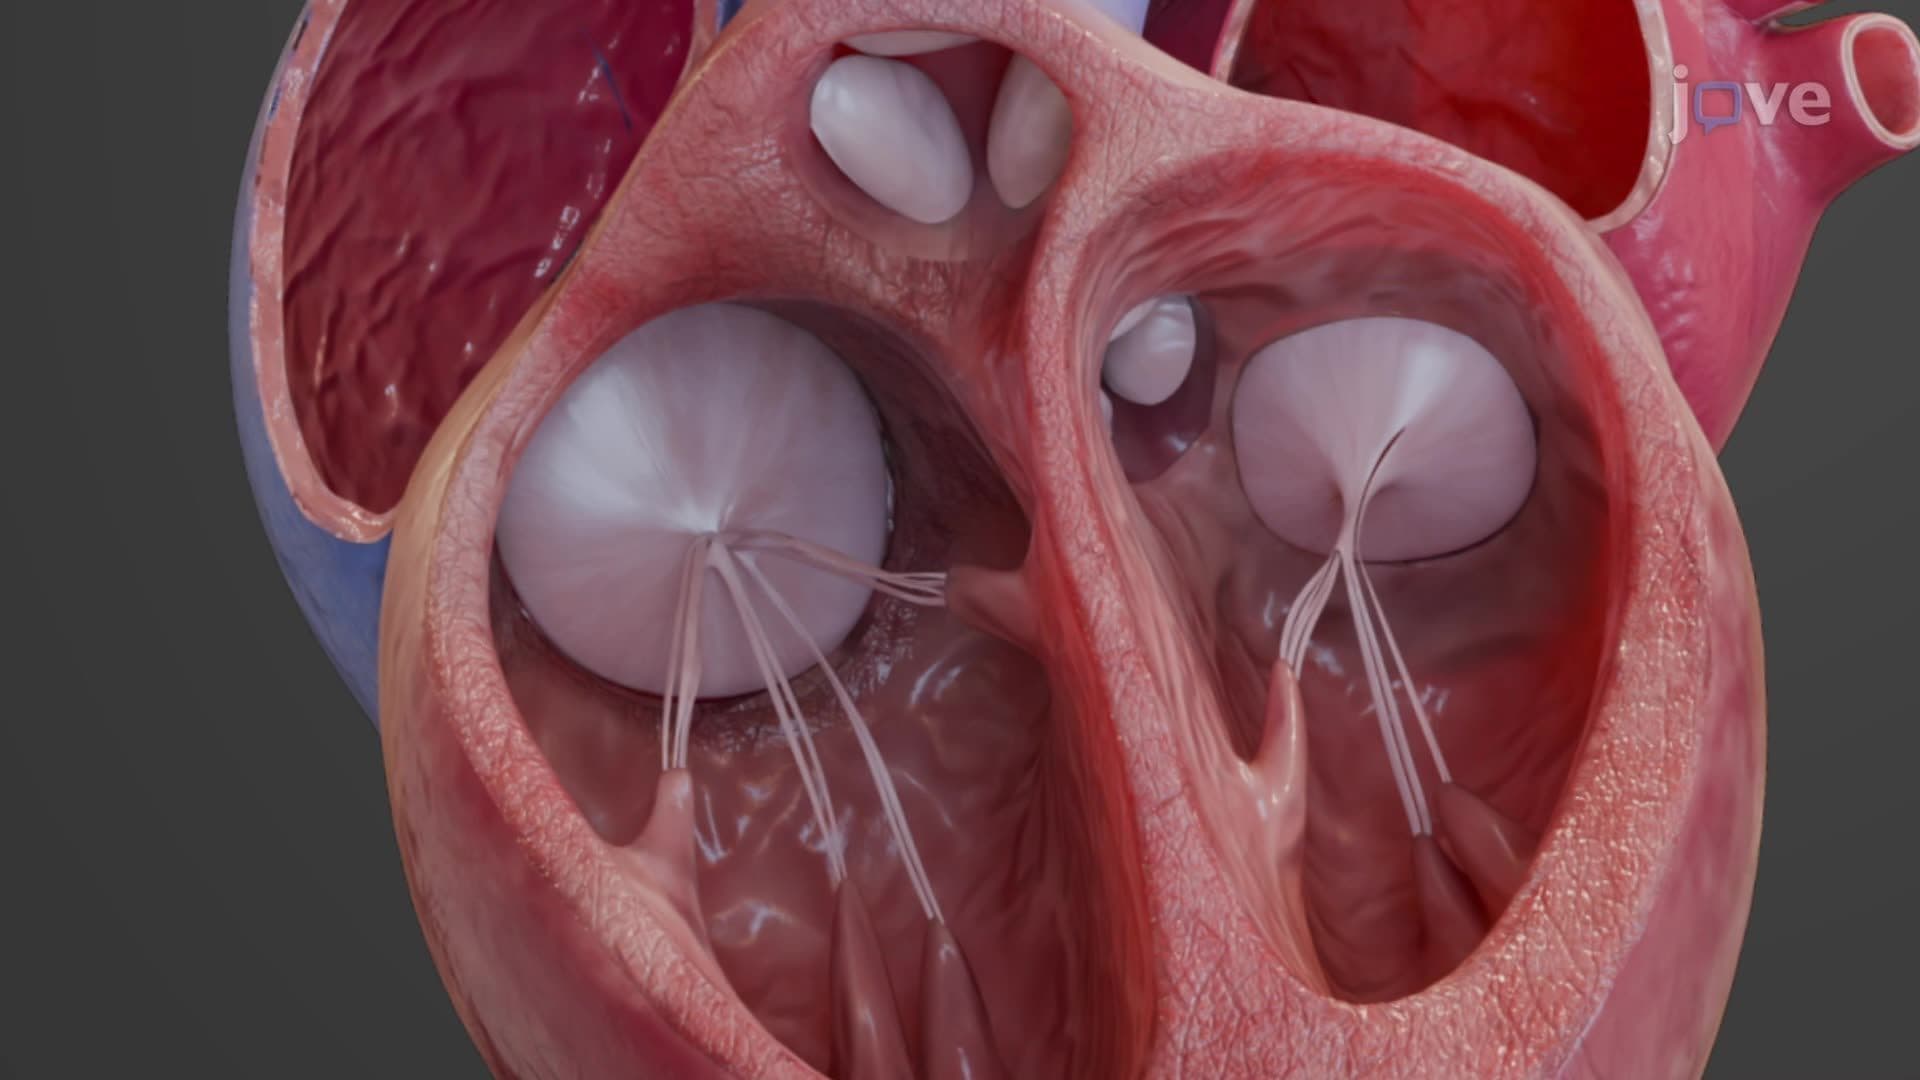
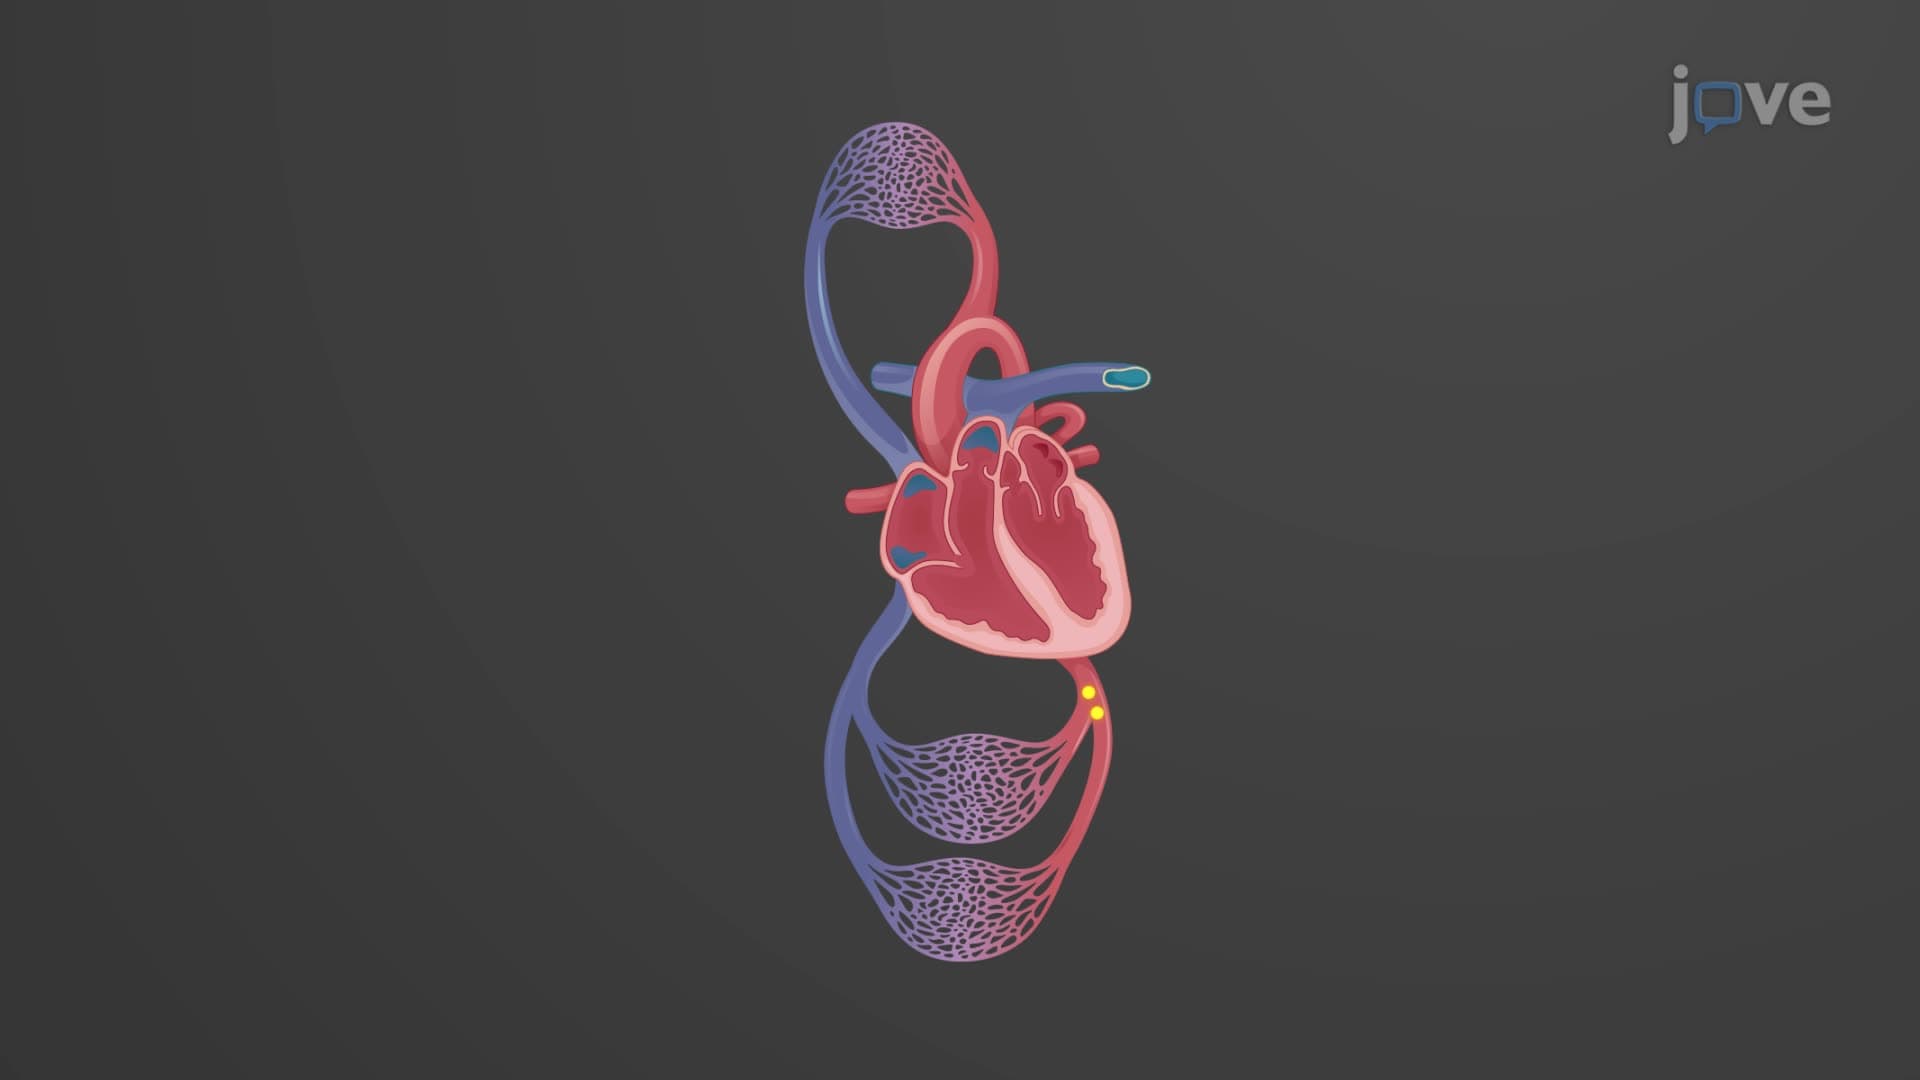
The ECG cardiac cycle correlation represents one of cardiology's most elegant principles: electrical activity always precedes mechanical function. This relationship allows healthcare professionals across US hospitals-from emergency rooms in Houston to cardiac units in Boston-to predict heart function simply by analyzing electrical patterns. The electrocardiogram doesn't just show what the heart is doing; it reveals what the heart is about to do.
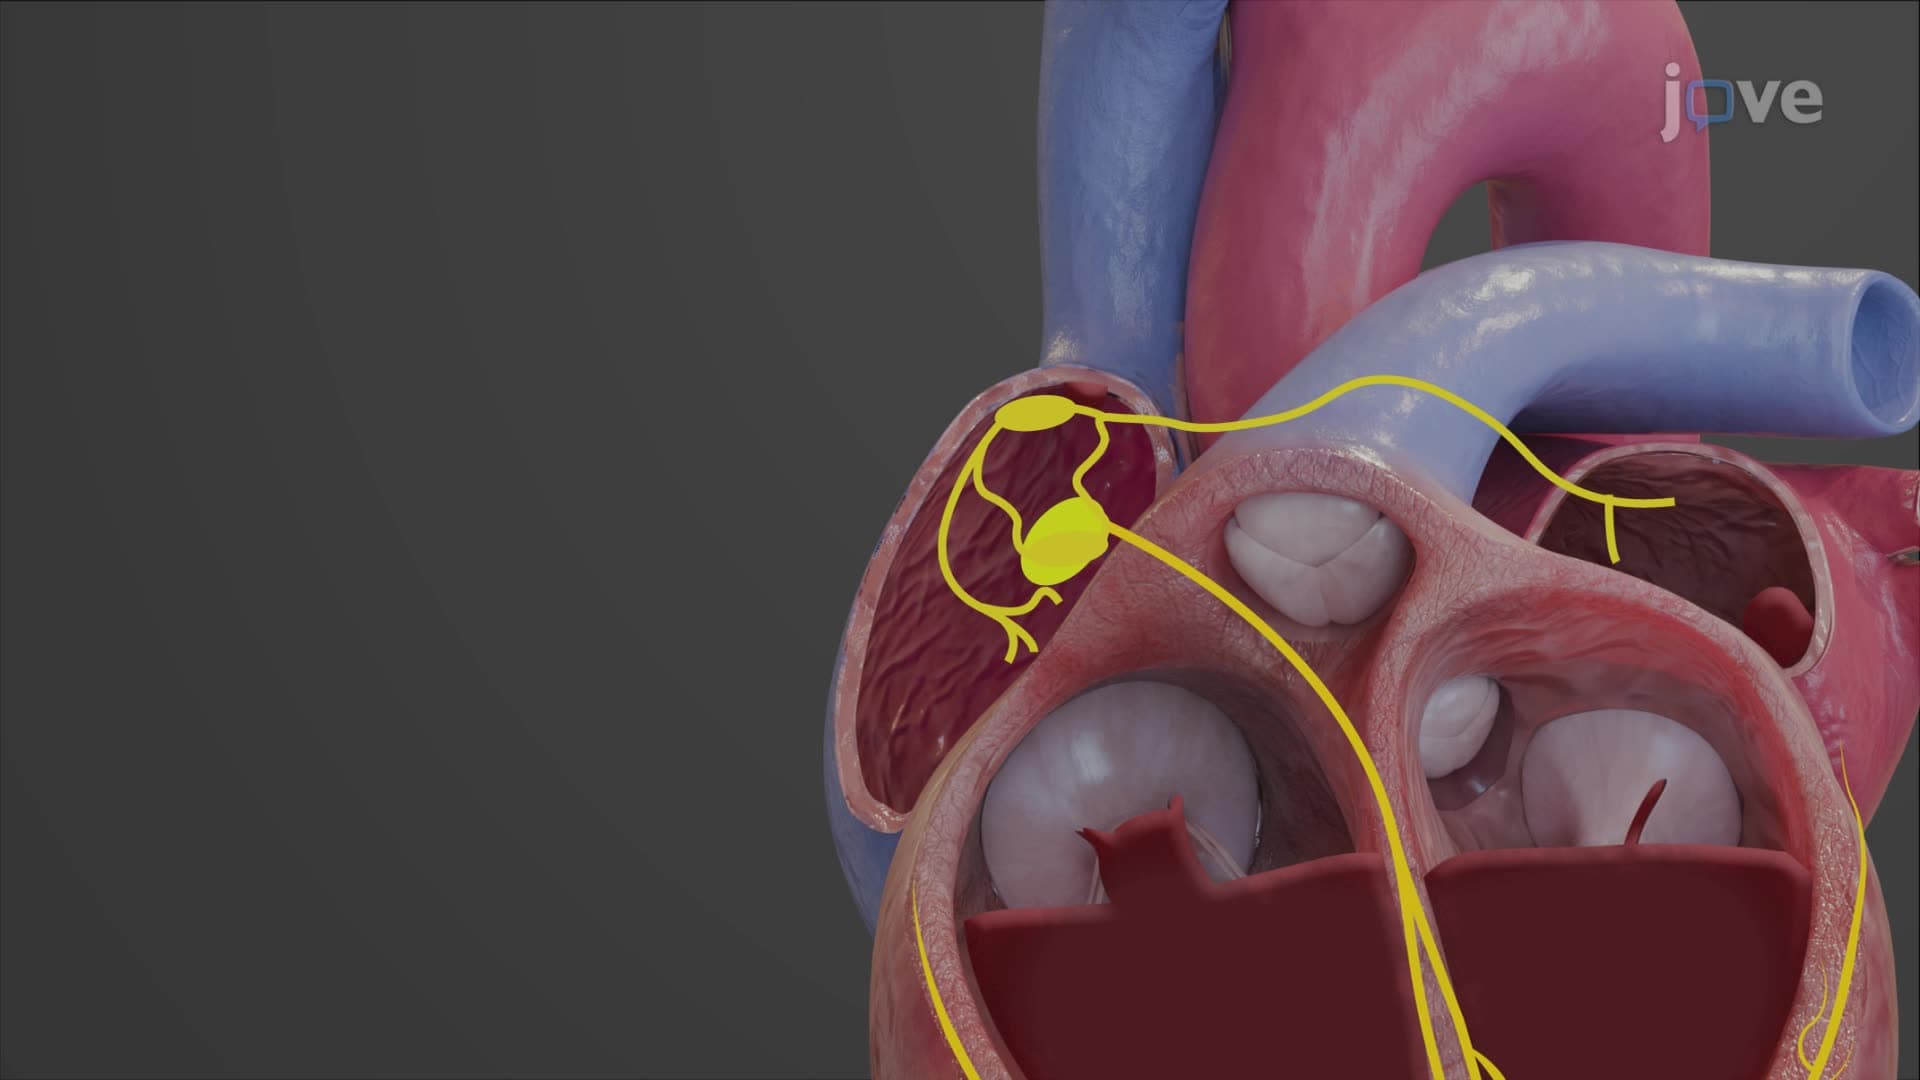
P wave atrial depolarization initiates each cardiac cycle, originating from the sinoatrial (SA) node. This electrical wave spreads across both atria in approximately 80 milliseconds. However, the mechanical response-atrial systole-doesn't begin until 0.1 seconds after the P wave starts. This delay occurs because electrical depolarization must reach a threshold before calcium channels open and trigger muscle contraction. During AP Biology exams and MCAT preparation, students often struggle with this timing concept, but remember: electricity travels faster than mechanical muscle response.
The QRS ventricular depolarization represents the heart's most powerful electrical event, typically occurring 0.2 seconds after the P wave. This complex travels down the interventricular septum, spreads across the ventricular walls, and triggers ventricular systole. The mechanical contraction begins immediately after the QRS complex ends, spanning the entire S-T interval. This correlation proves crucial for USMLE Step 1 questions, where test-takers must identify normal versus abnormal timing relationships.
T wave repolarization marks the electrical recovery phase, occurring approximately 0.4 seconds post-P wave. This process resets the ventricular electrical system, preparing for the next cycle. Mechanical relaxation (ventricular diastole) begins shortly after the T wave, creating the brief 0.2-second period where both atria and ventricles rest simultaneously. Understanding this cardiac electrical mechanical relationship helps explain why certain medications affect both ECG patterns and heart function-a concept frequently tested in nursing school NCLEX examinations and medical school cardiology rotations.
Related Micro-courses