Loading subject page…


1,870 views


Video Summary: What Is Bewley Lattice Diagram
Ever wonder why your Wi-Fi signal sometimes drops when you move between rooms? Understanding lossy lines and overvoltages starts with analyzing how electrical signals behave when they encounter obstacles-much like internet data traveling through fiber optic cables across Manhattan's complex network infrastructure. The Bewley Lattice Diagram provides a powerful graphical method to visualize and calculate these signal interactions, showing how waves reflect and refract at transmission line junctions. Watch the full video on JoVE Coach to master this concept with expert-led visuals and step-by-step explanations.
The Bewley Lattice Diagram serves as a fundamental tool in electrical engineering for analyzing transient behavior in transmission line systems. Named after L.V. Bewley, this graphical method transforms complex mathematical calculations into intuitive visual representations. The diagram uses a coordinate system where the horizontal axis represents distance along the transmission line, while the vertical axis represents time in discrete units. Diagonal lines within this framework represent traveling waves, with their slope indicating the wave's velocity and direction.
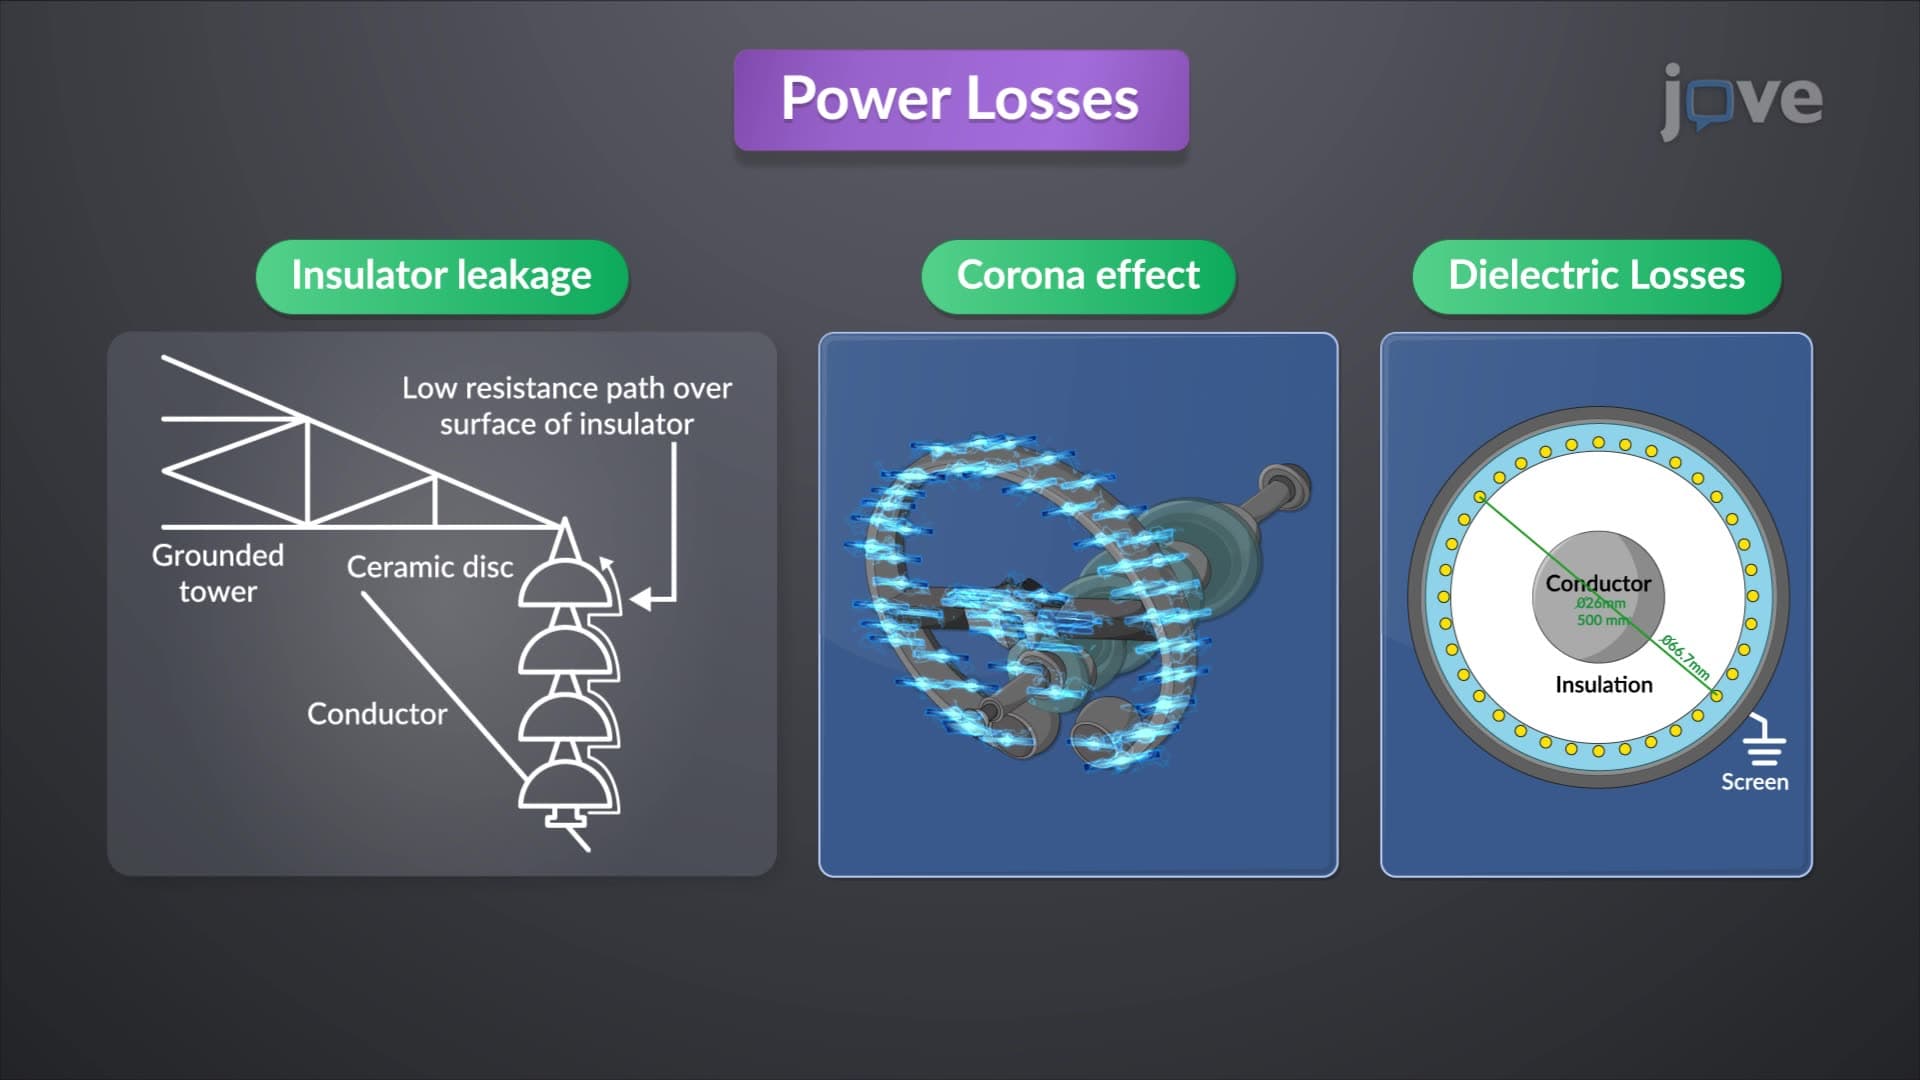
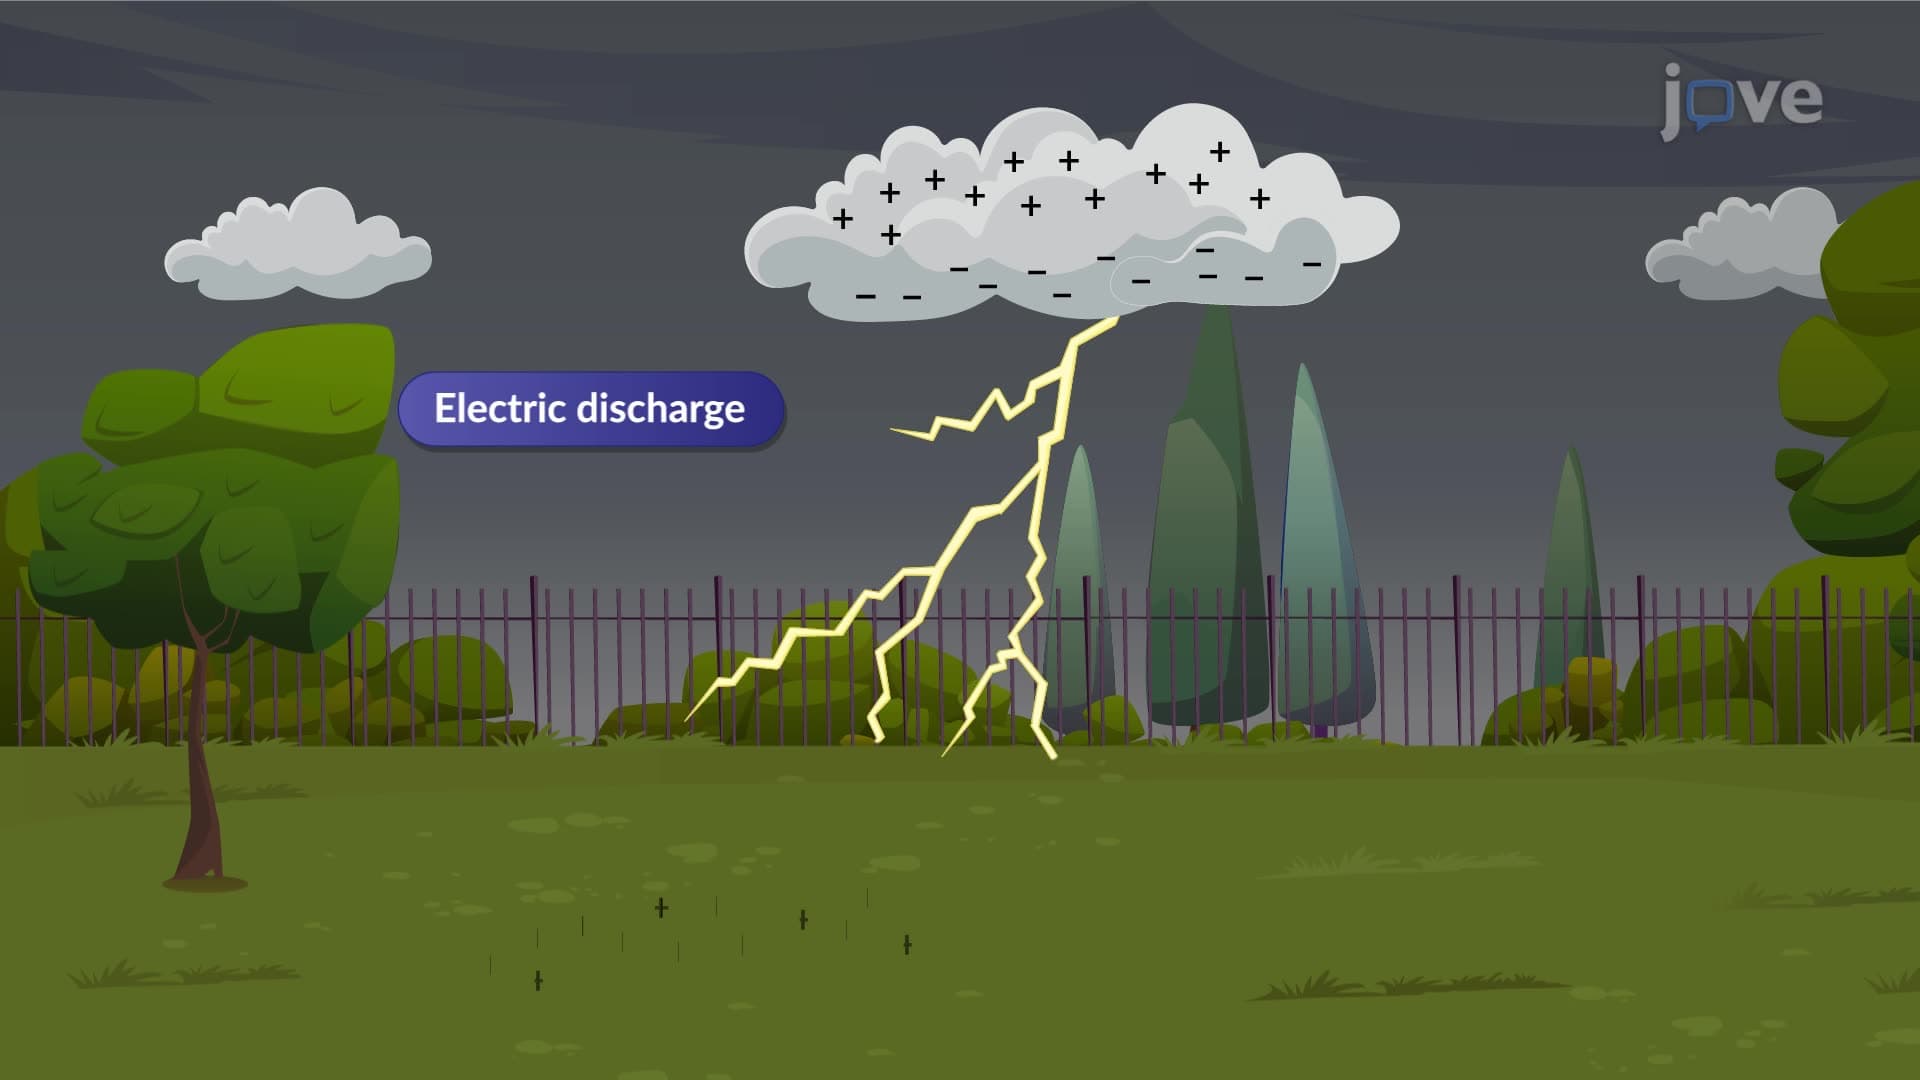
When examining lossy lines and overvoltages, engineers must account for real-world imperfections that cause signal degradation. Unlike idealized lossless lines, actual transmission systems-from the high-voltage power grid spanning from California's Pacific Gas & Electric to New York's Con Edison-experience resistance, inductance, and capacitance effects. These characteristics lead to overvoltage conditions during switching operations or lightning strikes. For instance, when Pacific Northwest's Bonneville Power Administration experiences sudden load changes, the resulting overvoltages can exceed normal operating levels by 200-300%, potentially damaging expensive equipment worth millions of dollars.
The power of the Bewley Lattice Diagram becomes evident when analyzing signal behavior at transmission line junctions. When an electrical wave encounters an impedance discontinuity-such as where underground cables connect to overhead lines in urban power distribution systems-part of the wave reflects back toward the source while another portion continues forward. The reflection coefficient, calculated as (Z2-Z1)/(Z2+Z1), determines the magnitude and polarity of the reflected wave. Students preparing for the AP Physics C exam or college-level circuit analysis courses frequently encounter these calculations, as they form the foundation for understanding power system protection schemes used by utilities like Florida Power & Light.
Contemporary applications extend beyond simple two-line junctions to complex networks resembling the interconnected grid systems managed by regional transmission organizations like PJM Interconnection, which coordinates electricity flow across 13 states. The lattice diagram methodology scales effectively to analyze these multi-junction scenarios, enabling engineers to predict voltage and current distributions throughout extensive networks. This capability proves crucial for designing protective relay systems that prevent cascading failures similar to the 2003 Northeast blackout that affected 55 million people across the northeastern United States.
Related Micro-courses