Loading subject page…


3,495 views
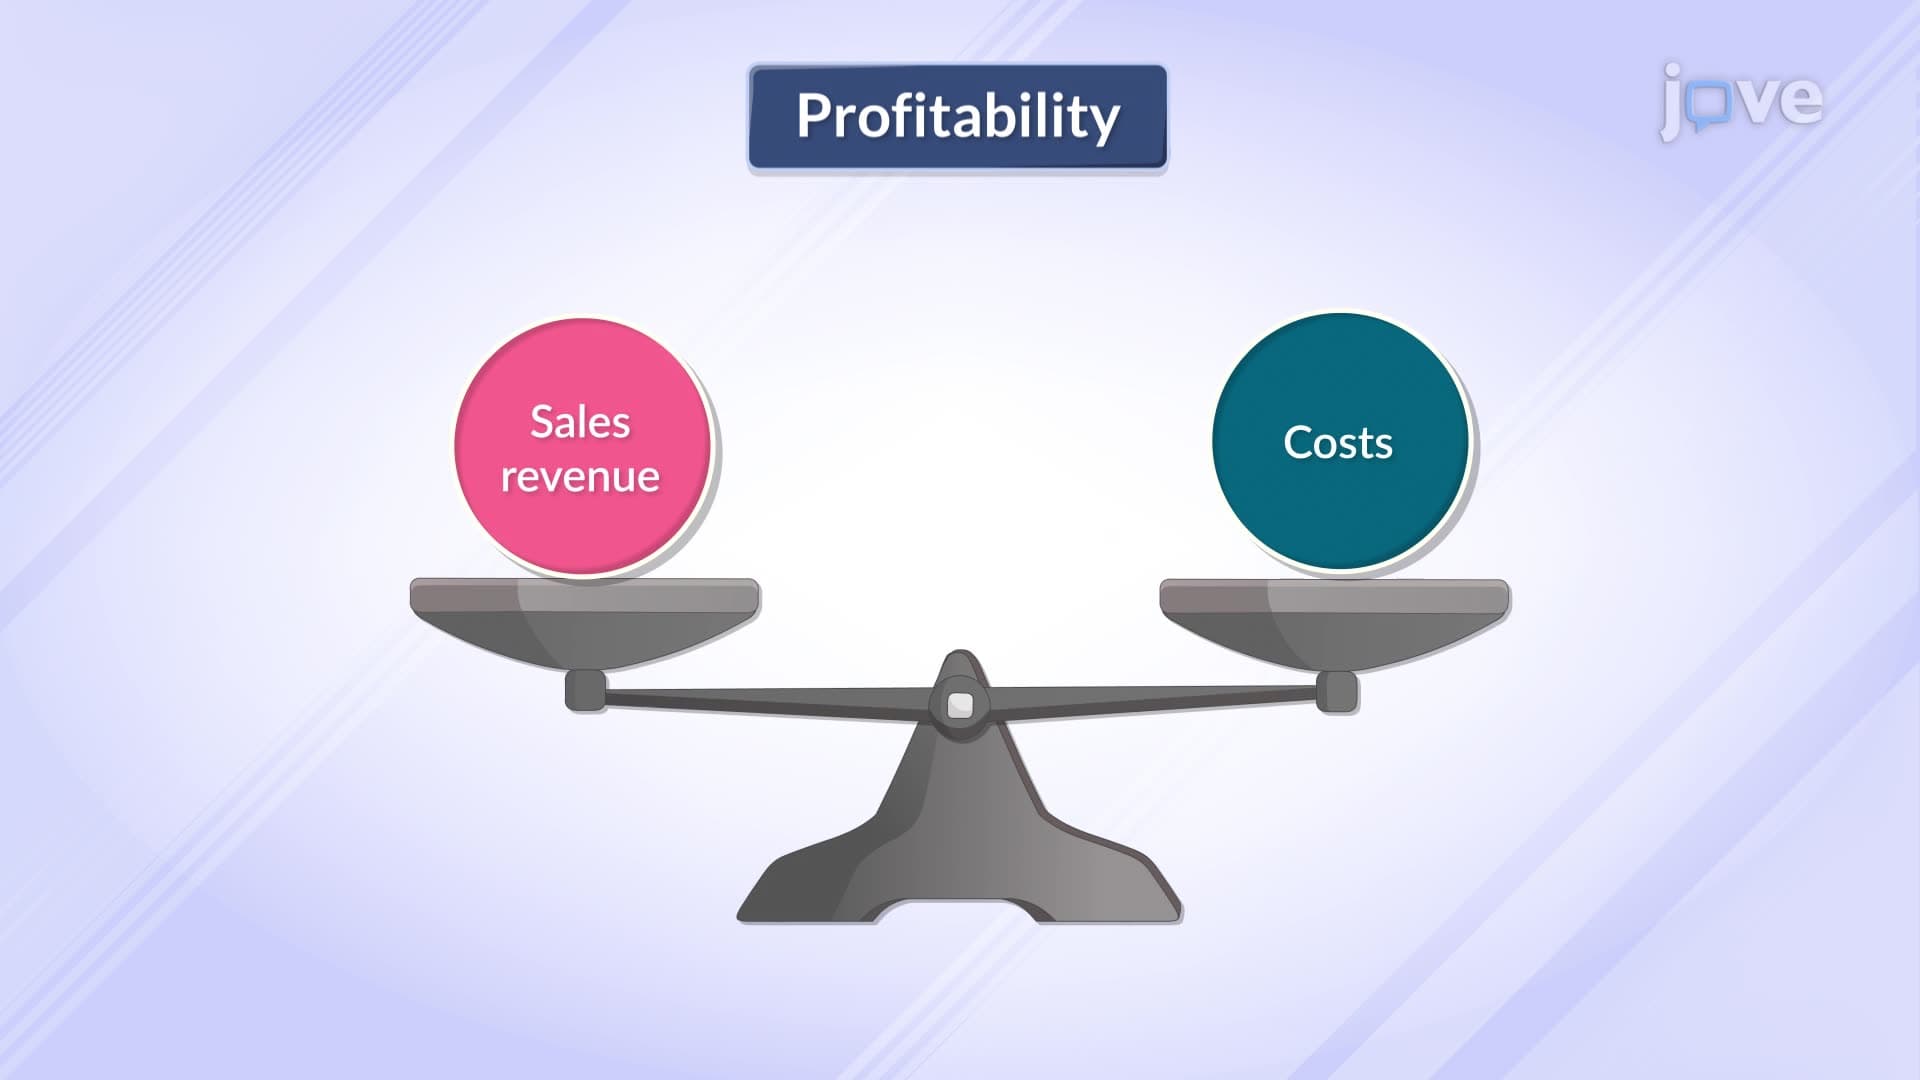

Video Summary: Margins and Profits Margins I Explained
Understanding margins and profits margins is critical when companies like Apple report gross margins of 43% while competitors struggle at 20%. These profitability metrics drive pricing decisions, operational efficiency initiatives, and investor confidence across industries. Margins And Profits Margins I Explained breaks down four essential calculations-gross margin, net margin, contribution margin, and markup-that directly impact your company's bottom line and competitive positioning. Watch the full video on JoVE Coach to master this concept with expert-led visuals and step-by-step explanations.
When Walmart's CFO discusses maintaining gross margins while expanding into higher-margin services, they're leveraging the same fundamental profitability metrics that drive decision-making across every industry. Margin analysis serves as the financial foundation for pricing strategies, operational improvements, and competitive positioning that determine long-term business success.
Gross margin reveals the fundamental economics of your core business by measuring revenue retention after direct production costs. Consider Tesla's automotive gross margin of approximately 25%-this metric tells investors and management how efficiently the company converts raw materials and manufacturing into profitable vehicles. The calculation is straightforward: if your product generates $1,000 in revenue with $600 in cost of goods sold, your gross margin is 40%. This percentage becomes your baseline for evaluating pricing power, manufacturing efficiency, and competitive sustainability.
Net margin captures your organization's complete financial picture by incorporating all operational expenses, taxes, and interest payments. Amazon famously operated with razor-thin net margins below 5% for years while building market dominance-a strategic choice that required sophisticated margin analysis to balance growth investment with profitability expectations. When your company reports $2 million in revenue against $1.8 million in total costs, that 10% net margin becomes the metric stakeholders use to evaluate management effectiveness and business model sustainability.
Contribution margin drives short-term decision-making by isolating variable costs from fixed expenses. If your software service generates $500 monthly recurring revenue with $200 in variable costs, that $300 contribution margin determines capacity for customer acquisition spending and operational scaling. Markup calculations complement this analysis by establishing pricing relationships-when Starbucks prices a $2.50 cost coffee at $5.00, they're implementing a 100% markup strategy that reflects brand positioning and market acceptance.
These margin metrics interconnect to form comprehensive profitability frameworks that inform everything from product development to market expansion. Manufacturing companies use gross margins to evaluate automation investments, while service businesses leverage contribution margins for staffing optimization and capacity planning decisions.
Related Micro-courses