Loading subject page…


3,495 views


Video Summary: Product and Portfolio Metrics I Explained
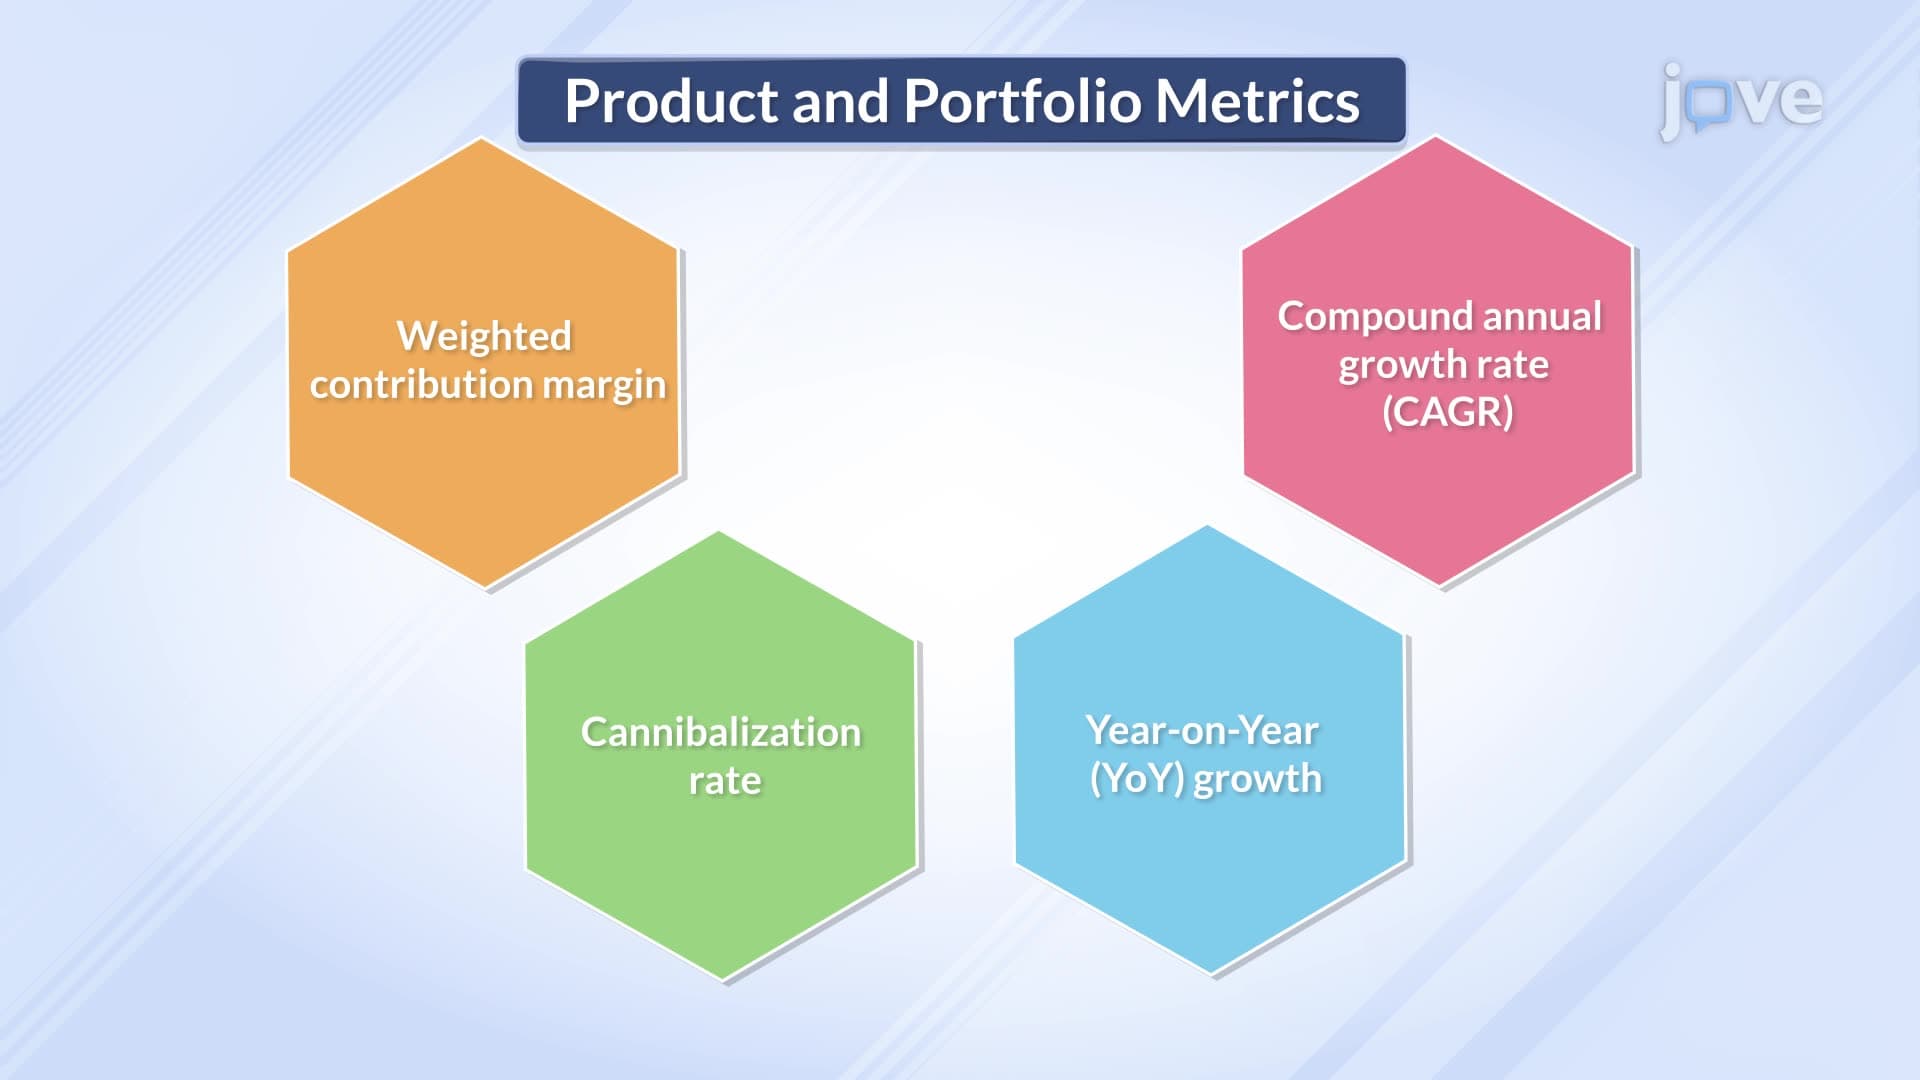
Product portfolio metrics drive critical investment decisions for companies like Procter & Gamble, where measuring trial rates and repeat purchases across 65+ brands determines which products receive additional marketing spend and which face discontinuation. These product portfolio metrics provide the quantitative foundation for strategic portfolio management, enabling leaders to optimize resource allocation and maximize market share. Understanding Product And Portfolio Metrics I Explained becomes essential when presenting performance data to executives or justifying budget requests for product development. Watch the full video on JoVE Coach to master this concept with expert-led visuals and step-by-step explanations.
When Coca-Cola launches a new beverage variant, executives don't rely on gut instinct-they deploy sophisticated product portfolio metrics to guide million-dollar decisions. These metrics transform raw sales data into strategic intelligence that drives competitive advantage and shareholder value creation.
Trial volume and trial rate serve as leading indicators of market acceptance and brand resonance. While trial volume captures absolute first-time purchase numbers, trial rate reveals market penetration depth by measuring what percentage of your target demographic actually converted. For consumer goods companies like Unilever, achieving a 3-5% trial rate in the first quarter often predicts long-term product viability. Smart portfolio managers use these metrics to optimize media spend allocation and identify geographic markets requiring additional promotional support.
Repeat volume and repeat rate metrics separate sustainable products from one-time novelties. Amazon's private label strategy heavily weights repeat rate data when deciding which products deserve expanded shelf space or enhanced search visibility. A 60% repeat rate typically indicates strong product-market fit, while rates below 30% signal fundamental product or positioning issues requiring immediate strategic intervention. These metrics directly impact customer lifetime value calculations and inform pricing strategy decisions.
Product introduction forecasted volume bridges current performance with future capacity planning. General Mills uses these projections to coordinate supply chain investments, manufacturing schedules, and distribution partnerships. Accurate forecasting prevents costly inventory write-offs while ensuring adequate supply during peak demand periods. Portfolio managers who master these projections gain competitive advantage through superior operational efficiency and market responsiveness.
Leading companies integrate these metrics into quarterly business reviews, using standardized dashboards to compare performance across product lines. This systematic approach enables data-driven decisions about product discontinuation, line extensions, and market expansion priorities. The most successful portfolio managers combine these quantitative insights with qualitative market intelligence to build comprehensive strategic narratives that resonate with C-suite executives and board members.
Related Micro-courses