Loading subject page…


3,495 views

Video Summary: Product and Portfolio Metrics Ii Explained
Product portfolio metrics drive critical resource allocation decisions for companies like Amazon, which uses sophisticated metrics to optimize its vast product ecosystem across AWS, Prime, and retail divisions. These product portfolio metrics enable executives to identify which offerings generate sustainable growth versus those requiring strategic repositioning. Understanding Product And Portfolio Metrics II Explained helps professionals make data-driven decisions about product investments, market positioning, and competitive strategy. Watch the full video on JoVE Coach to master this concept with expert-led visuals and step-by-step explanations.
Modern portfolio management extends far beyond traditional financial metrics. Companies like Microsoft have transformed their business model by applying sophisticated product portfolio analysis to shift from one-time software licenses to subscription-based services. This strategic pivot required deep understanding of how different products contribute to overall company performance and long-term value creation.
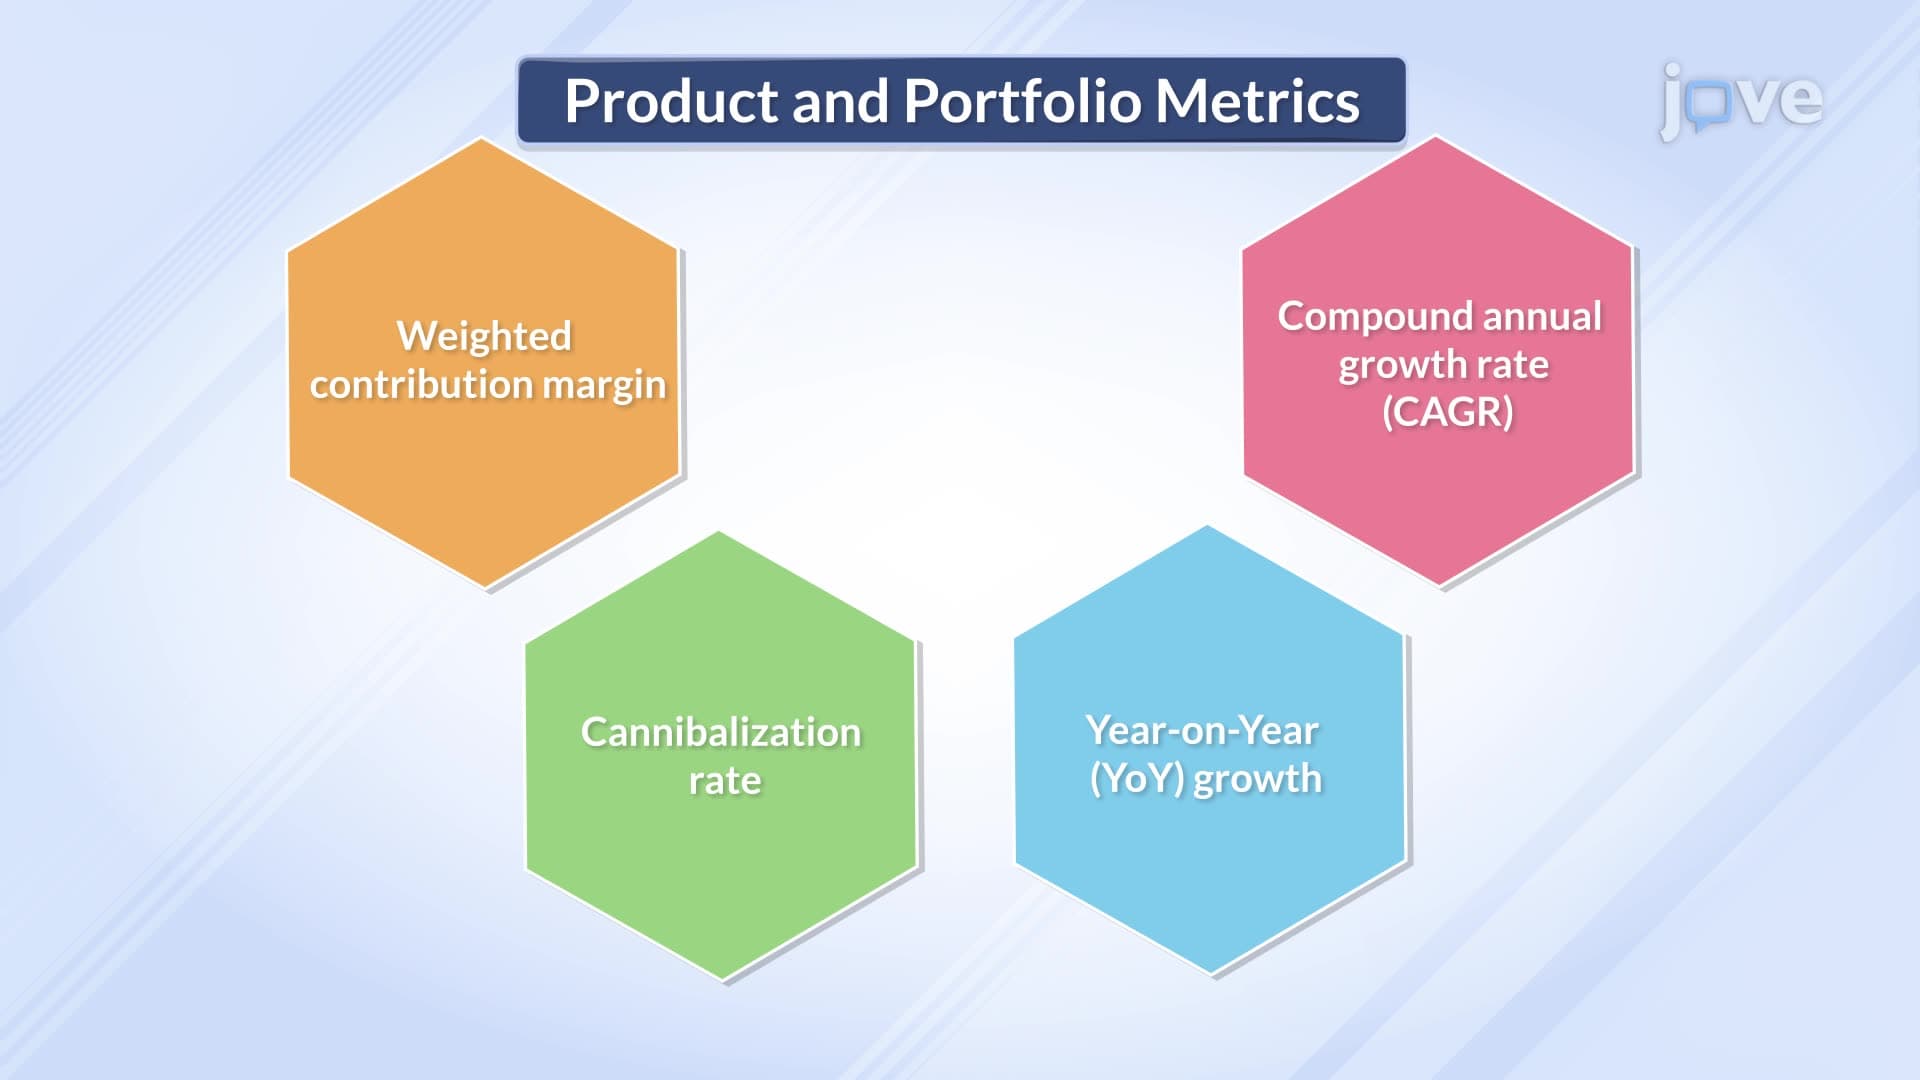
Weighted contribution margin represents the most critical metric for executive decision-making because it combines profitability with market impact. Unlike simple profit margins, this metric accounts for a product's relative importance within the overall portfolio. For instance, Apple's iPhone generates lower margins than some accessories, but its weighted contribution margin remains highest due to ecosystem lock-in effects and volume scale. Senior leaders use this metric to determine where to invest R&D dollars, marketing spend, and operational resources. The calculation involves multiplying each product's contribution margin by its percentage of total company revenue, providing a weighted average that reflects true strategic value.
Cannibalization rates reveal the hidden costs of product proliferation and innovation. Tesla's Model 3 launch cannibalized Model S sales, but the company strategically accepted this trade-off to capture the broader mid-market segment. Effective cannibalization analysis helps executives distinguish between healthy market expansion and destructive internal competition. Companies must establish acceptable cannibalization thresholds-typically 15-25% for planned obsolescence scenarios, but much lower for premium product lines. This metric becomes especially critical during product launch cycles and competitive responses.
CAGR provides the long-term growth narrative essential for investor relations and strategic planning, while year-over-year metrics capture operational effectiveness and market responsiveness. Netflix exemplifies this balance-reporting consistent CAGR for subscriber growth while using YoY metrics to demonstrate content strategy success and regional expansion effectiveness. Professional analysts must understand when each metric provides more actionable insights. CAGR works best for 3-5 year strategic planning, while YoY metrics drive quarterly business reviews and tactical adjustments. The interplay between these metrics often reveals inflection points where strategic intervention becomes necessary.
Related Micro-courses