Loading subject page…


445 views


Video Summary: Introduction to Exponential Functions and Their Properties
Did you know that a single radioactive carbon-14 atom has a 50% chance of decaying every 5,730 years, following an exponential pattern that helps archaeologists date ancient artifacts? This introduction to exponential functions and their properties reveals how these mathematical models describe everything from population growth in major US cities like Phoenix and Austin to medication concentrations in patients at hospitals across America. Understanding exponential functions unlocks the ability to predict and analyze real-world phenomena that change at rates proportional to their current values. Watch the full video on JoVE Coach to master this concept with expert-led visuals and step-by-step explanations.
Exponential functions represent one of mathematics' most powerful tools for modeling real-world phenomena. The introduction to exponential functions and their properties begins with recognizing their distinctive form: f(x) = a × b^x, where 'a' represents the initial value, 'b' is the base (a positive number not equal to 1), and 'x' is the exponent. This seemingly simple structure captures complex behaviors found throughout science, finance, and everyday life.
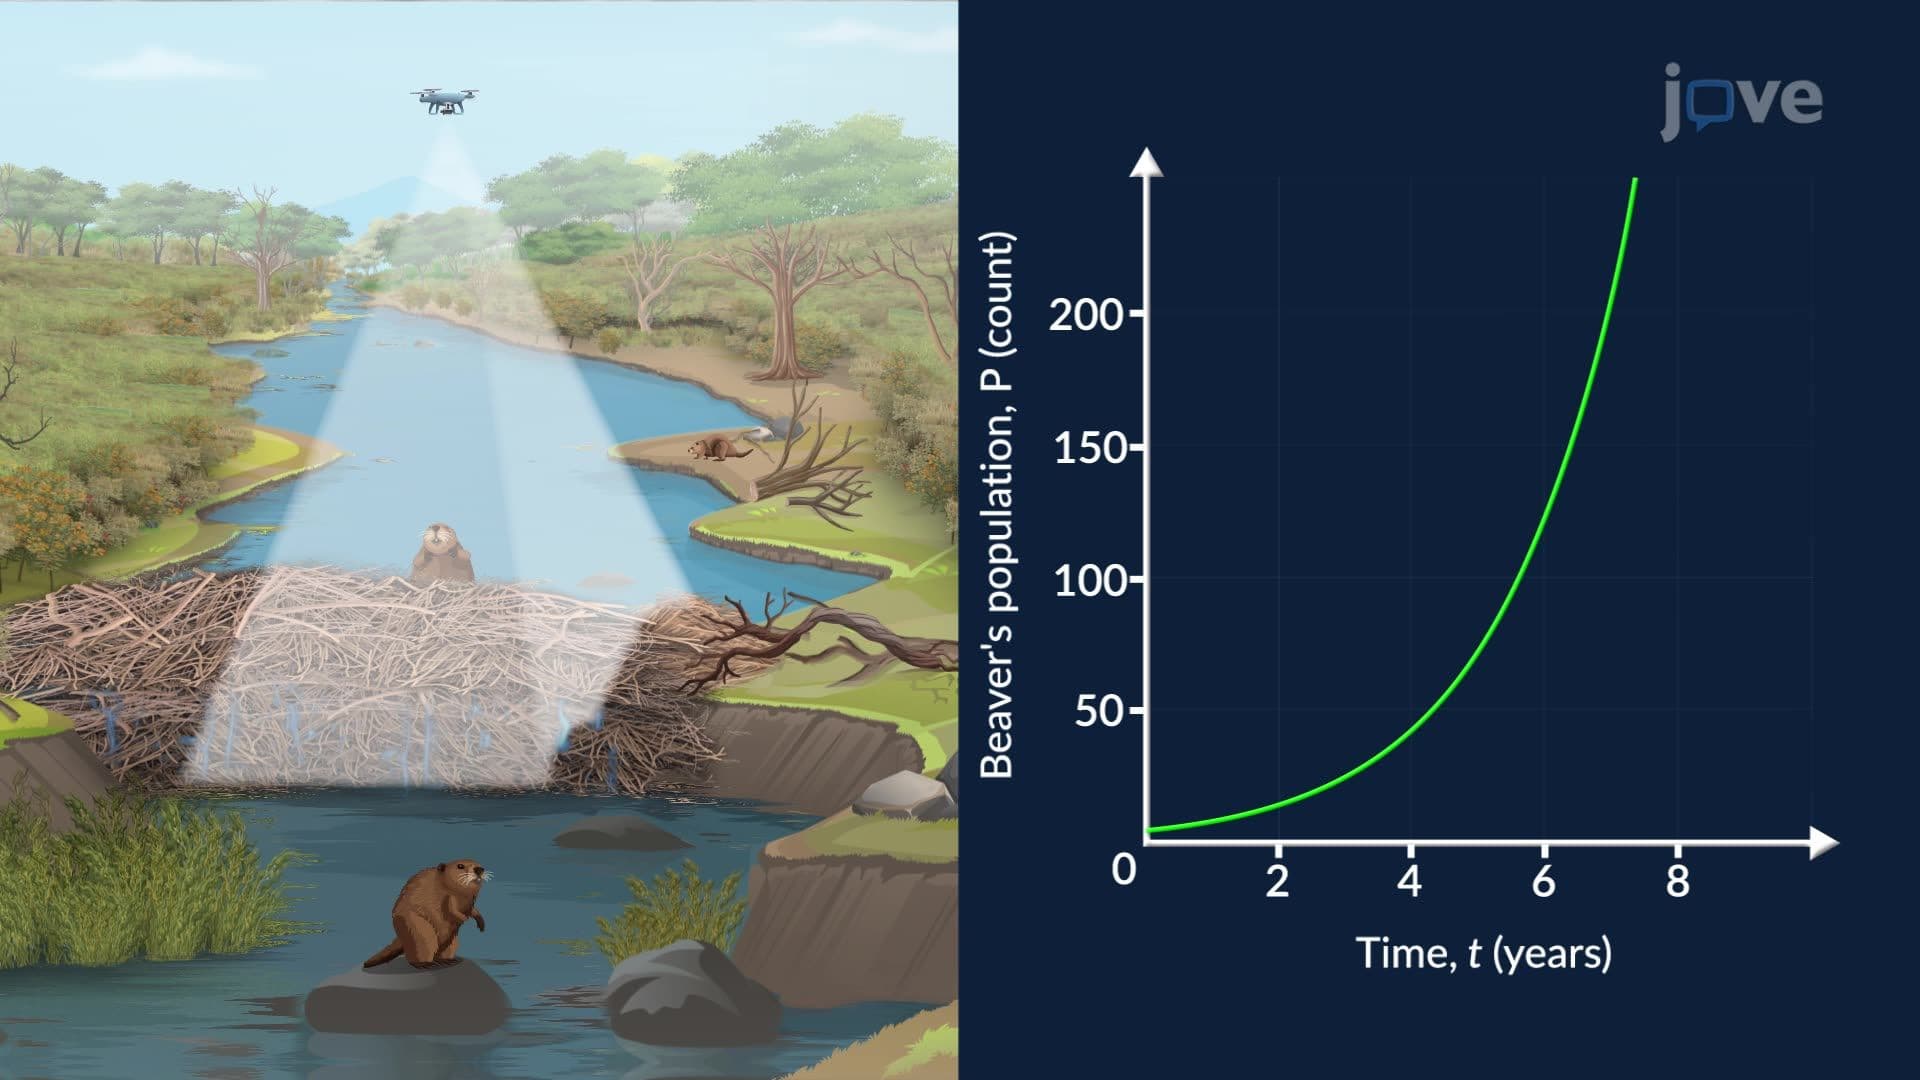
The base value fundamentally determines whether an exponential function models growth or decay. When b > 1, the function exhibits exponential growth, meaning values increase rapidly over time. Consider the population of Austin, Texas, which has grown exponentially, roughly doubling every 20 years due to tech industry expansion. Conversely, when 0 < b < 1, exponential decay occurs. The half-life of medical isotopes used in nuclear medicine at facilities like Mayo Clinic follows this pattern, with radioactive materials losing half their potency at predictable intervals.
Exponential functions appear throughout American academic and professional landscapes. In AP Calculus courses, students analyze compound interest calculations for college savings plans, where A = P(1 + r/n)^(nt) demonstrates exponential growth. The Centers for Disease Control and Prevention (CDC) uses exponential models to track epidemic spread, as seen during COVID-19 when infection rates initially followed exponential patterns before intervention measures took effect. Financial advisors at firms like Fidelity and Vanguard rely on exponential functions to project retirement account growth over decades.
Exponential function graphs display distinctive features that make them instantly recognizable. Growth functions curve upward dramatically, starting slowly then accelerating rapidly-imagine a skateboard ramp that becomes increasingly steep. Decay functions begin high and drop quickly before leveling off, approaching but never reaching zero. This behavior creates horizontal asymptotes, invisible barriers that the function approaches infinitely close but never touches. For students preparing for the SAT Math Level 2 Subject Test or college calculus exams, understanding these graphical properties proves essential for analyzing function behavior and solving optimization problems.
Related Micro-courses