Loading subject page…


4,328 views


Video Summary: Input Efficiency Production Contract Curve Explained
Ever wonder how Apple and Google decide to allocate their engineering talent and capital investments between different product lines? The input efficiency production contract demonstrates how two producers can optimally distribute limited resources like labor and capital to maximize total output without waste. This Input Efficiency Production Contract Curve Explained concept shows that efficient allocation occurs when both firms have equal marginal rates of technical substitution, creating a curve where no reallocation can improve one producer's output without harming the other's. Watch the full video on JoVE Coach to master this concept with expert-led visuals and step-by-step explanations.
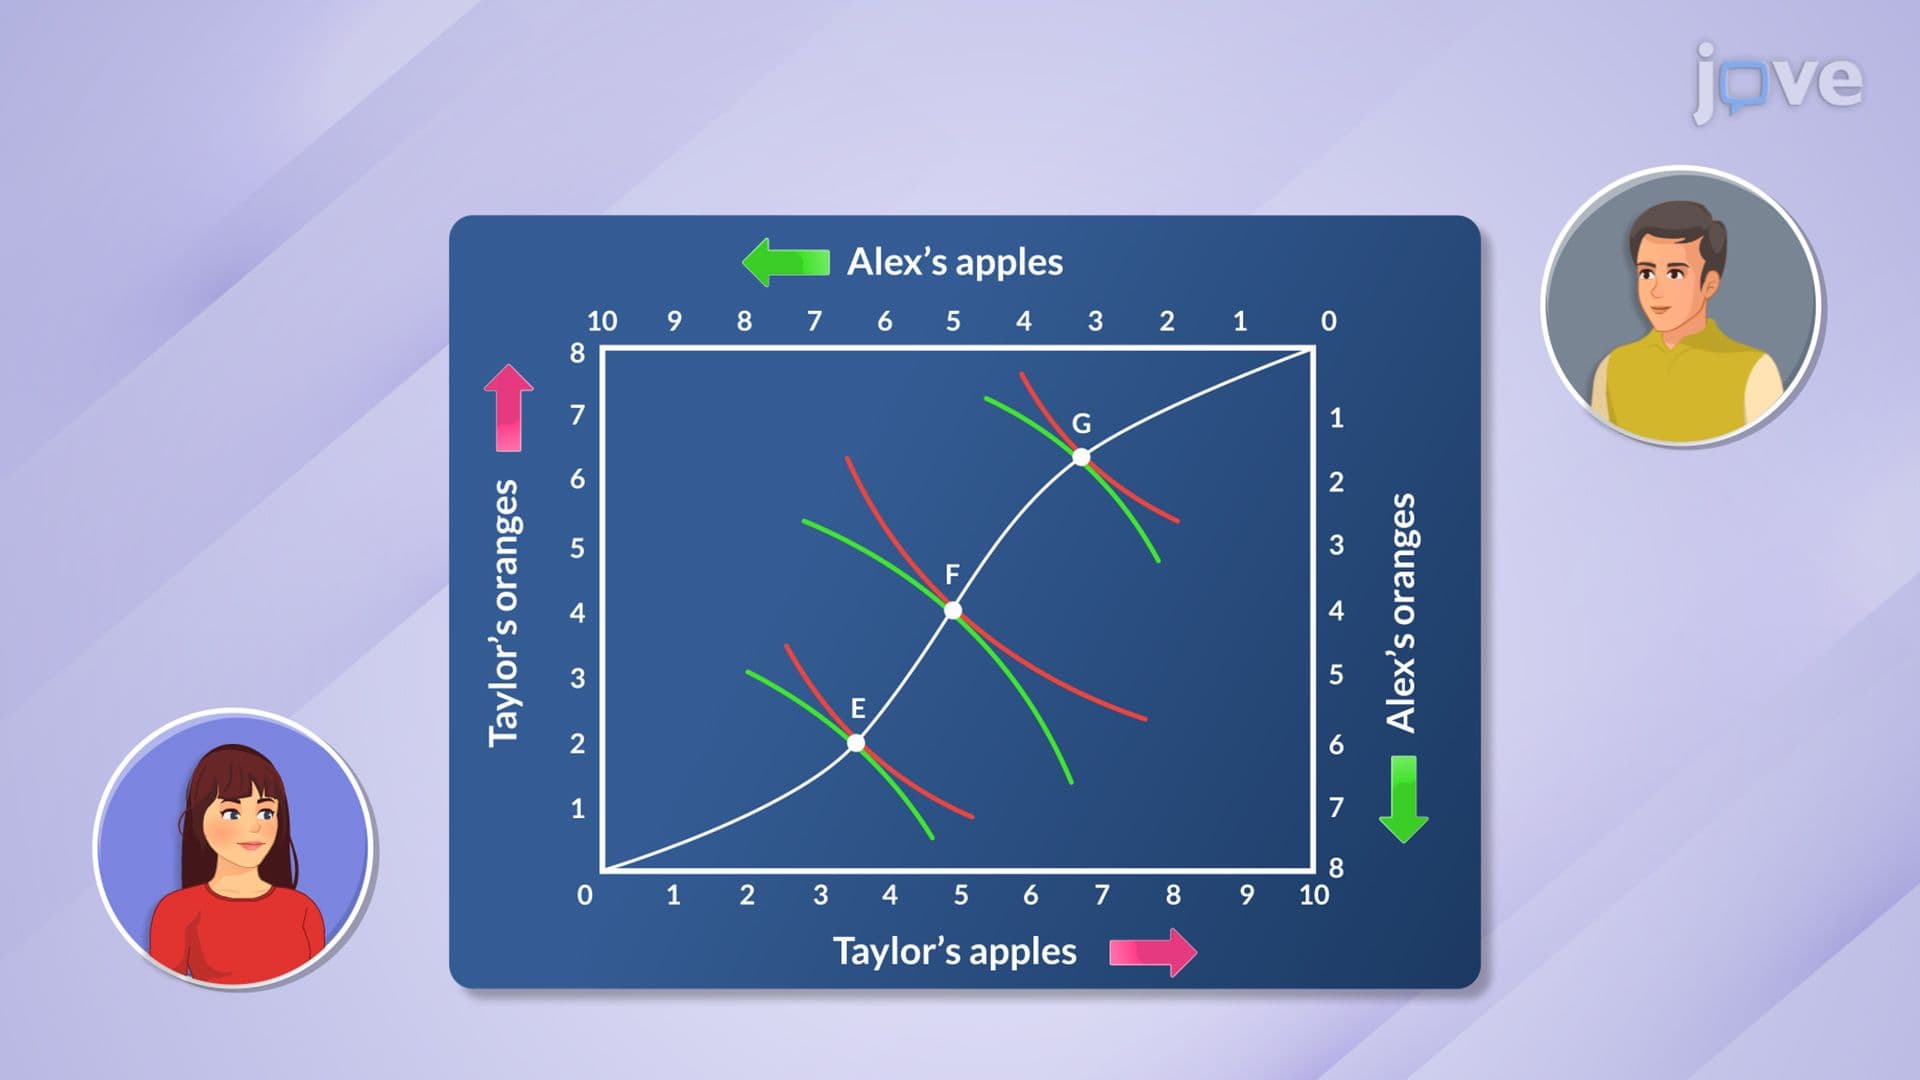
The input efficiency production contract curve represents one of microeconomics' most elegant solutions to resource allocation problems. When two producers compete for limited inputs-such as skilled workers, machinery, or raw materials-this curve identifies every possible efficient distribution. Unlike simple supply and demand models, the contract curve addresses the fundamental question: how can society maximize total production when resources are scarce?
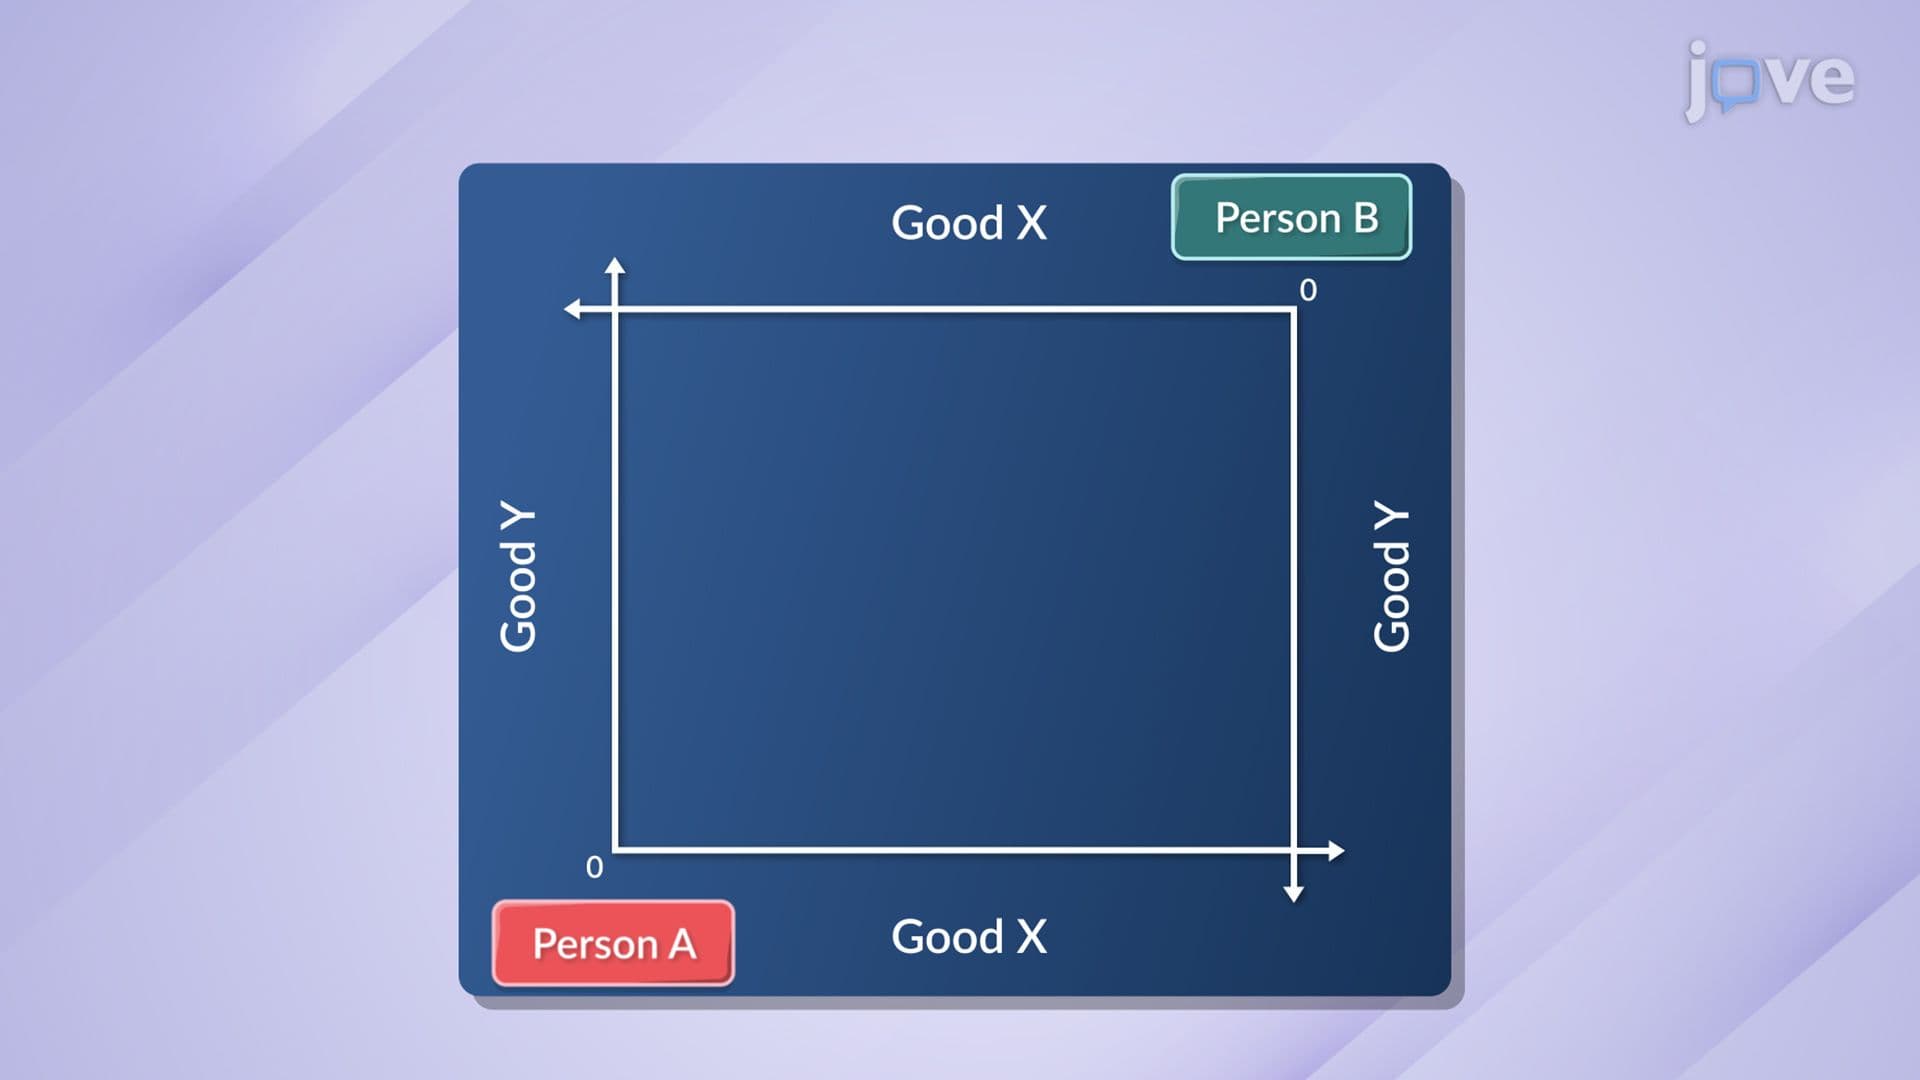
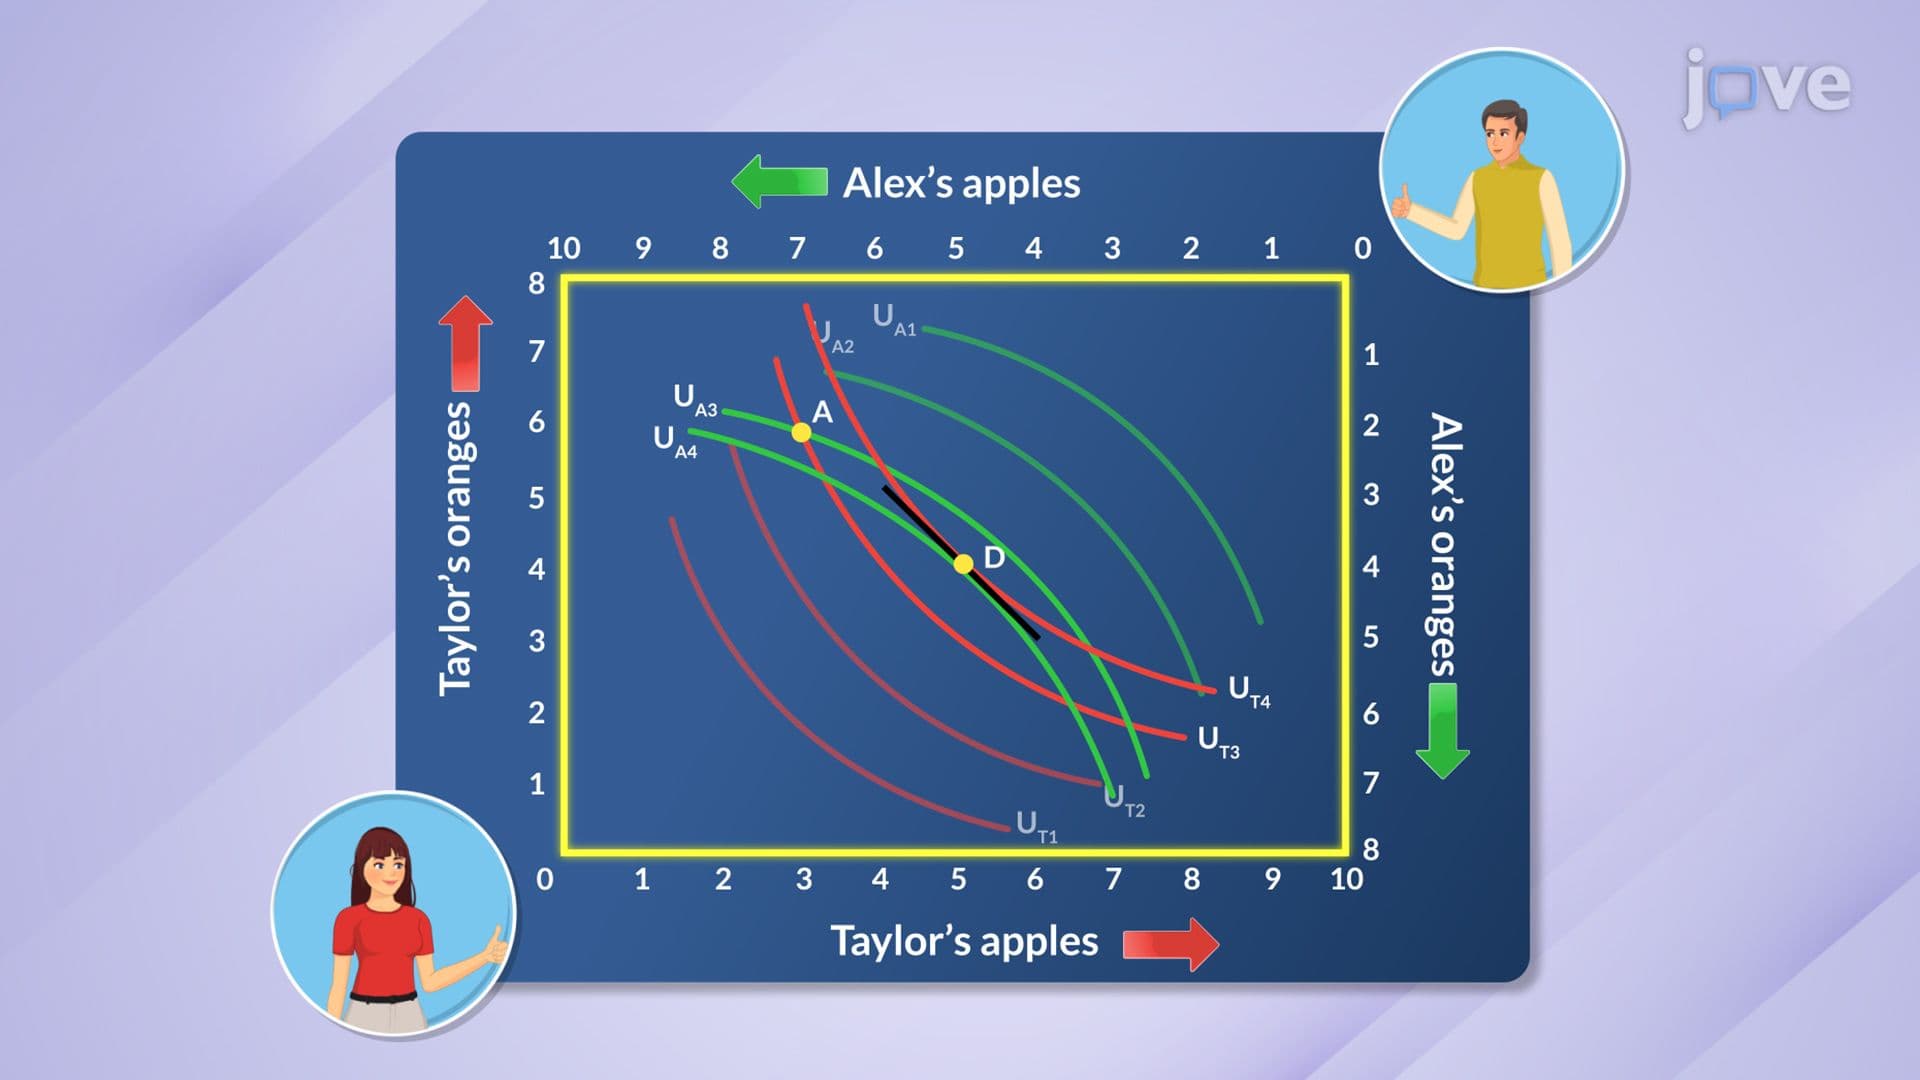
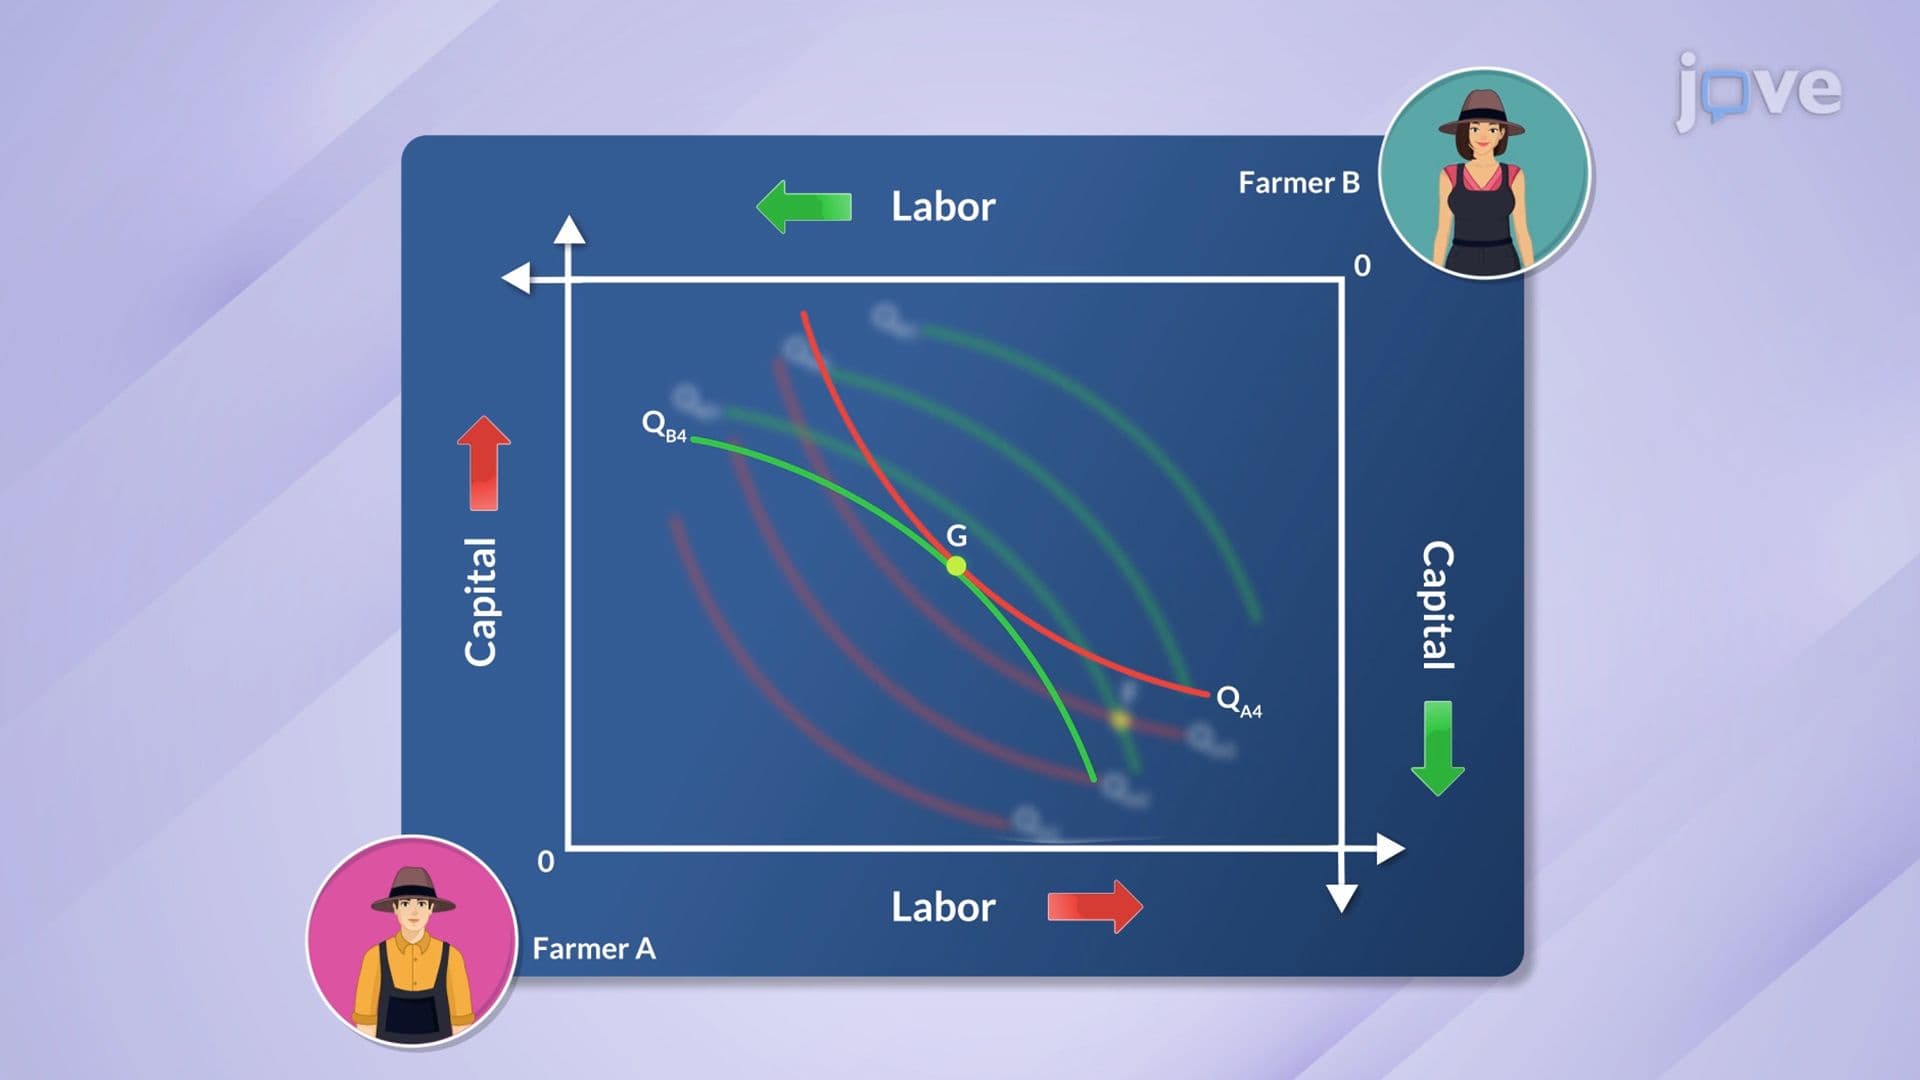
The contract curve emerges from the intersection of isoquants (curves showing equal output levels) for both producers within an Edgeworth box. At every point along this curve, the marginal rate of technical substitution (MRTS) between inputs equals for both firms. Mathematically, this condition appears as: MRTS(A) = MRTS(B), where A and B represent the two producers.
For students preparing for AP Microeconomics or college intermediate microeconomics courses, understanding this equality proves crucial. The MRTS measures how much of one input (say, capital) a firm can give up while maintaining constant output if it gains one additional unit of another input (labor). When these rates equalize across firms, no further beneficial trades exist.
Consider how technology giants like Microsoft and Amazon allocate their software engineers and server infrastructure between competing projects. If Microsoft's gaming division and cloud computing division both need programming talent, the contract curve would show efficient allocations where neither division could improve its output by reallocating programmers without hurting the other division's productivity.
Similarly, agricultural cooperatives in California's Central Valley face these decisions when distributing water rights and farm equipment between almond and grape production. The contract curve helps identify allocations where total agricultural output reaches its maximum given available irrigation and machinery.
Students encountering contract curve problems on MCAT economics sections, AP Microeconomics exams, or college midterms should focus on identifying the efficiency condition. Most problems provide production functions or isoquant information, requiring students to find points where marginal rates of technical substitution equalize. Practice problems often involve calculating optimal input distributions or identifying inefficient allocations that could be improved through resource reallocation.
Related Micro-courses