Loading subject page…
- Pharmacokinetics and Pharmacodynamics
- Bioavailability and Bioequivalence
- Bioequivalence Data: Statistical Interpretation
Micro-course: Bioavailability and Bioequivalence
1,059 views
Learn key concepts and earn your certificate.
















Bioequivalence Data: Statistical Interpretation

00:00
01:16
Video Summary: What Is Bioequivalence Data Statistical Interpretation
When the FDA evaluates whether a generic cholesterol medication works identically to Lipitor, bioequivalence data statistical interpretation becomes the critical decision-making tool. This sophisticated analytical approach determines if different drug formulations deliver identical therapeutic effects by comparing absorption rates and blood concentration patterns. For instance, when Pfizer's Lipitor patent expired, dozens of generic manufacturers needed to prove their versions were statistically equivalent using rigorous bioequivalence data statistical interpretation methods. Watch the full video on JoVE Coach to master this concept with expert-led visuals and step-by-step explanations.
- Understand what bioequivalence data statistical interpretation means and its critical role in pharmaceutical regulation and generic drug approval processes
- Identify the key statistical parameters used in bioequivalence studies, including AUC (Area Under Curve), C-max values, and their normal distribution assumptions
- Analyze why log-transformation of bioequivalence data is necessary when dealing with limited sample sizes that don't follow normal distribution patterns
- Compare ANOVA (Analysis of Variance) and confidence interval approaches as the two primary statistical methods for bioequivalence assessment
- Evaluate statistical significance using p-values below 0.05 and understand when differences between test and reference products become meaningful
- Apply the 90% confidence interval method to determine if bioavailability parameters fall within the acceptable 20% difference threshold
- Recognize the two one-sided test procedure (TOST) as the standard approach for contrasting test formulations against reference products
- Explore real-world applications in FDA drug approval processes and how these statistical interpretations impact patient safety and healthcare costs
Understanding Bioequivalence Data Statistical Interpretation Fundamentals
Bioequivalence data statistical interpretation represents the mathematical backbone of modern pharmaceutical regulation, particularly in the United States where the FDA oversees generic drug approvals worth billions of dollars annually. This analytical framework determines whether two drug formulations-typically a generic version and its brand-name reference-deliver therapeutically identical effects in the human body. The stakes are enormous: incorrect interpretations could either deny patients access to affordable generic medications or, worse, approve potentially harmful formulations that don't perform as expected.
Statistical Distribution Challenges and Log-Transformation Solutions
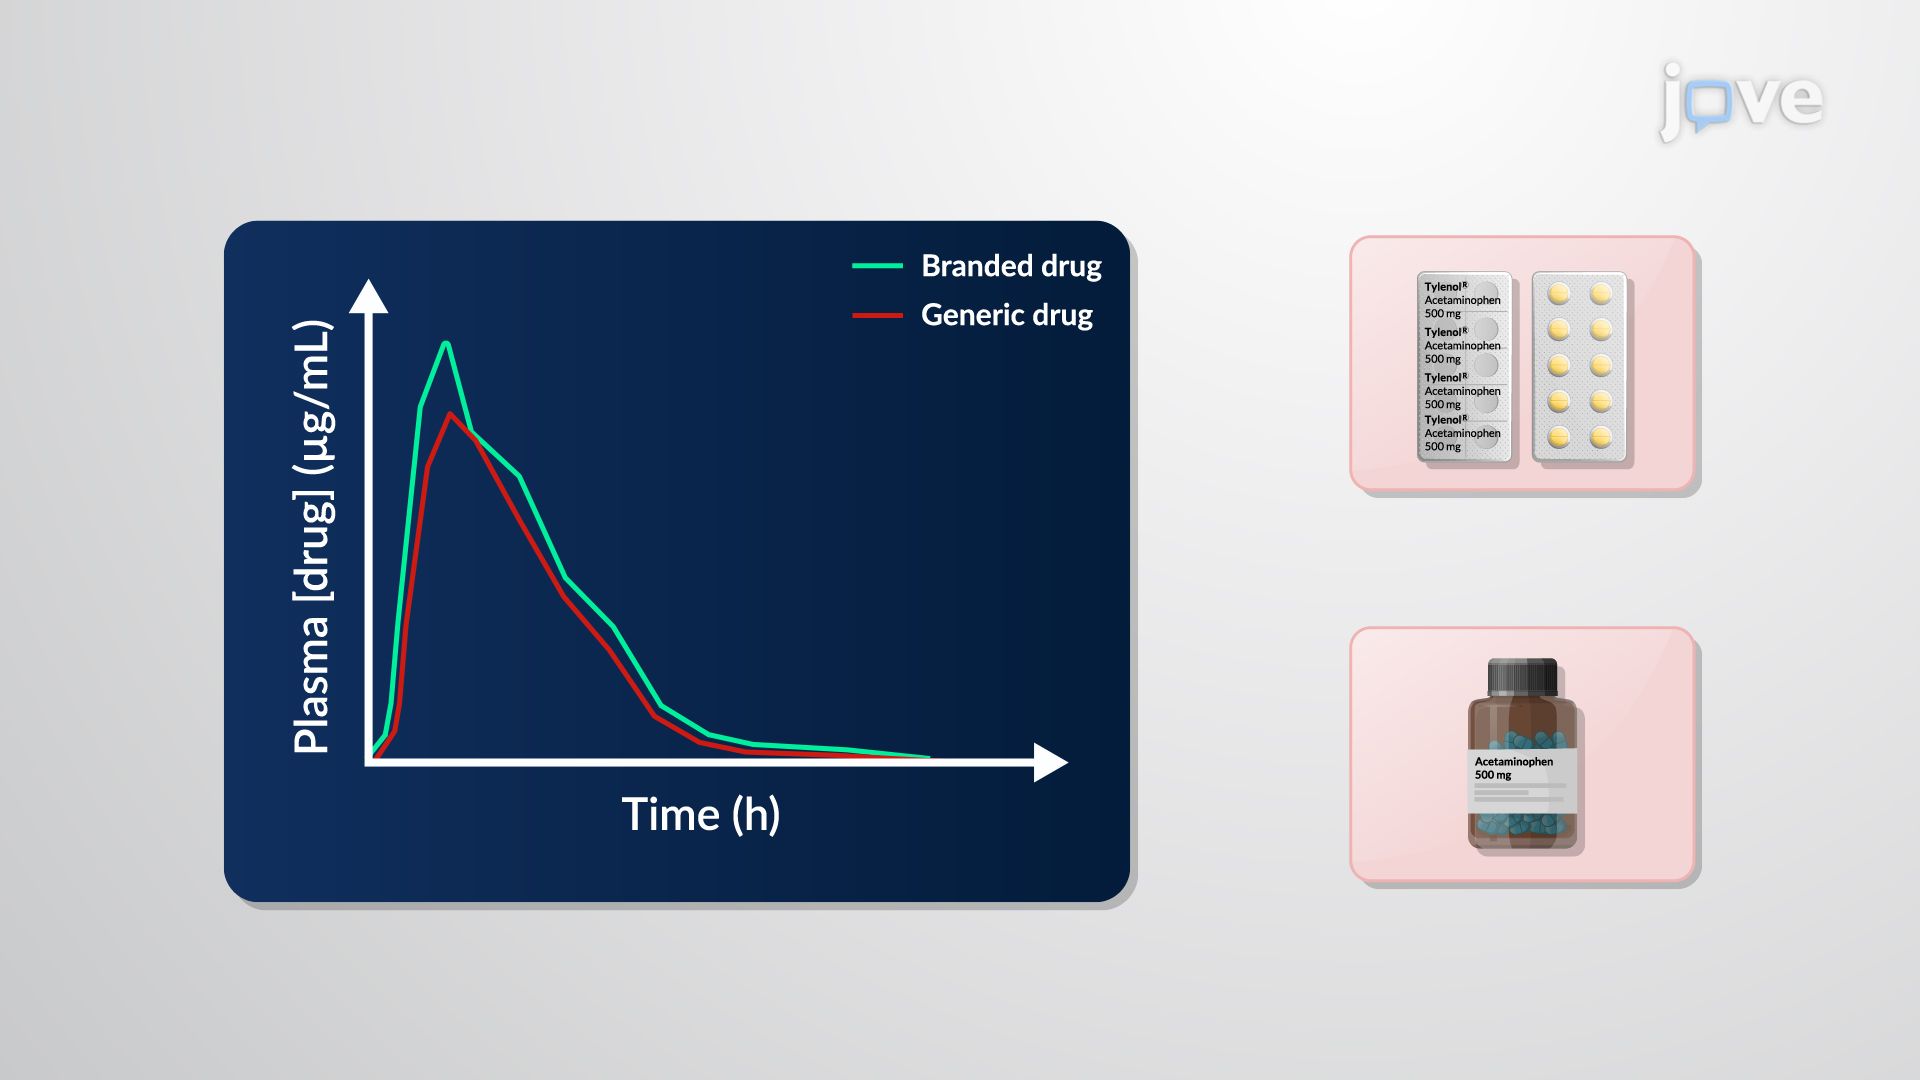
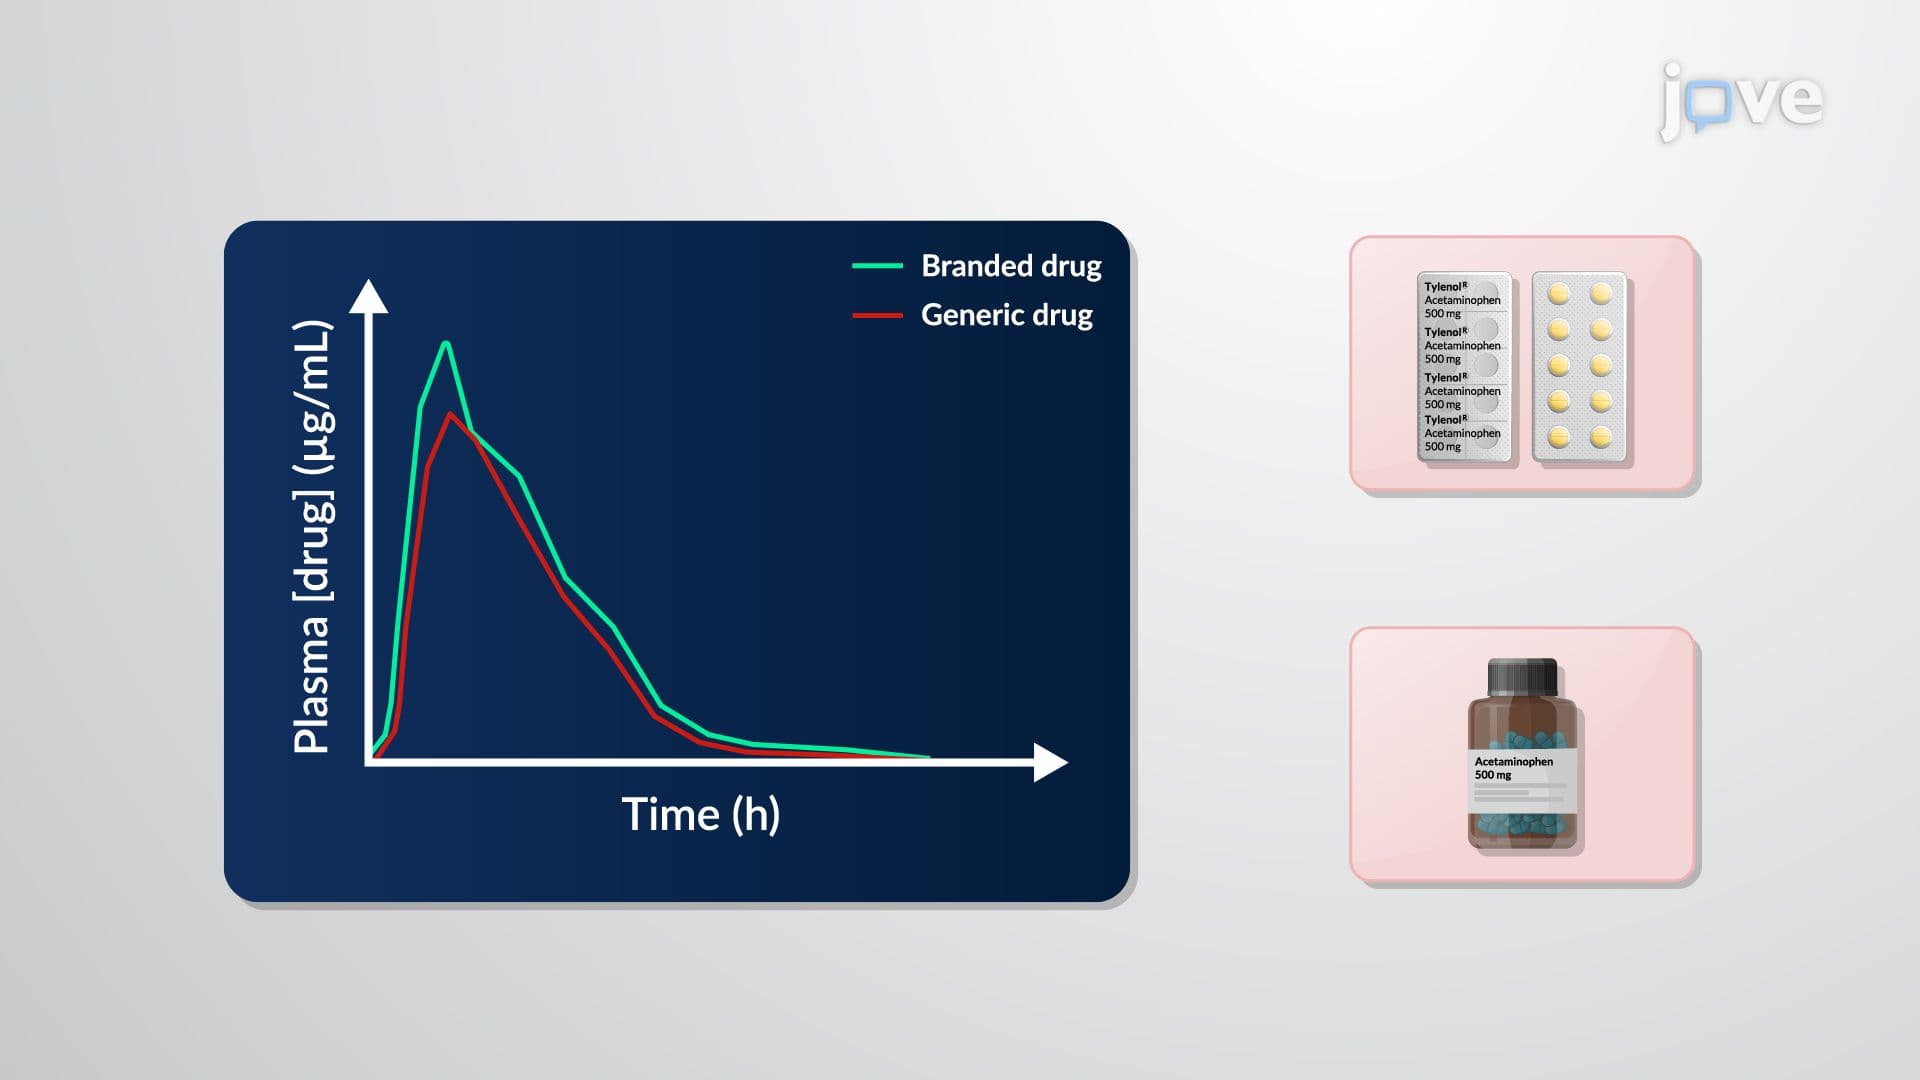
The complexity of bioequivalence data statistical interpretation stems from the inherent variability in human pharmacokinetics. While statisticians typically assume normal, bell-shaped distributions for most biological data, bioequivalence studies often involve relatively small sample sizes-usually 24-36 healthy volunteers-that may not follow perfect normal distributions. Key parameters like C-max (maximum plasma concentration) and AUC (area under the concentration-time curve) frequently exhibit skewed patterns that can mislead traditional statistical analyses.
This is where log-transformation becomes crucial. When bioequivalence data undergoes logarithmic transformation, the resulting values typically approximate normal distributions much more closely, enabling reliable statistical comparisons. For students preparing for the MCAT or advanced placement biology exams, understanding this transformation concept proves essential, as it demonstrates how mathematical tools solve real-world biological data challenges.
ANOVA vs. Confidence Interval Approaches
Two primary statistical methodologies dominate bioequivalence data statistical interpretation: ANOVA (Analysis of Variance) and the confidence interval approach. ANOVA examines differences both within individual study groups and between the test and reference formulations. When ANOVA yields p-values below 0.05, statisticians conclude that observed differences are statistically significant rather than due to random variation.
However, the pharmaceutical industry increasingly favors the confidence interval method, specifically the two one-sided test procedure (TOST). This approach directly compares the bioavailability of test formulations against reference products, requiring that bioavailability parameters fall within 80-125% of the reference values with 90% confidence. This translates to the practical requirement that generic drugs must demonstrate bioequivalence within a 20% margin, ensuring therapeutic equivalence while accounting for normal biological variation.
Real-World Applications and Regulatory Impact
Consider how these statistical interpretations affected the 2012 generic Lipitor launch. When Pfizer's patent expired, multiple manufacturers submitted bioequivalence studies to the FDA. Each study required rigorous statistical interpretation to demonstrate that their generic atorvastatin formulations delivered identical therapeutic effects. The FDA's approval of these generics, based on sound bioequivalence data statistical interpretation, eventually saved American consumers over $3 billion annually in prescription costs while maintaining therapeutic safety and efficacy standards.
Frequently Asked Questions
Bioequivalence data statistical interpretation is the analytical process used to determine if different drug formulations deliver identical therapeutic effects by comparing their absorption patterns and blood concentrations. It's essential because it enables the FDA to approve safe, effective generic medications that can save patients thousands of dollars annually while ensuring therapeutic equivalence to brand-name drugs. This statistical framework protects both public health and healthcare affordability.
MCAT questions frequently test bioequivalence concepts through pharmacokinetics passages requiring students to interpret AUC curves, analyze statistical significance, and evaluate confidence intervals. Students might encounter scenarios asking them to determine whether generic formulations meet FDA bioequivalence standards or to calculate therapeutic windows based on statistical data. AP Biology and college biochemistry courses also incorporate these concepts when covering drug metabolism and regulatory science.
The 90% confidence interval method directly addresses the specific question of therapeutic equivalence rather than just statistical difference. While ANOVA can detect differences between formulations, the confidence interval approach specifically tests whether those differences fall within clinically acceptable limits (80-125% of reference values). This method aligns perfectly with FDA regulatory requirements and provides more meaningful information for drug approval decisions than simple statistical significance testing.
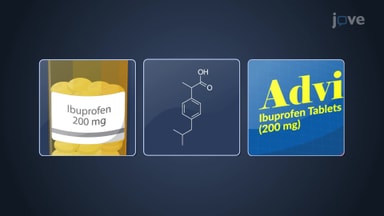
When CVS or Walgreens offers generic alternatives to brand-name medications like Advil (ibuprofen) or Tylenol (acetaminophen), those generics received FDA approval through rigorous bioequivalence studies. Statistical interpretation of these studies demonstrated that the generic versions deliver identical pain relief and safety profiles as their brand-name counterparts. This process has made essential medications accessible to millions of Americans who otherwise couldn't afford brand-name prices, particularly impacting chronic disease management for conditions like diabetes and hypertension.
While bioequivalence interpretation involves sophisticated statistical methods, the fundamental concepts are accessible to high school students with basic statistics knowledge. Understanding means, standard deviations, and confidence intervals provides sufficient foundation for grasping the core principles. The mathematical complexity lies in the calculations, but the conceptual framework-comparing drug absorption patterns to ensure therapeutic equivalence-remains straightforward and builds naturally on introductory biology and chemistry knowledge.
Focus on understanding the practical applications rather than memorizing statistical formulas. Practice interpreting pharmacokinetic graphs, identify key parameters like AUC and C-max, and understand why the 20% bioequivalence window matters clinically. Create concept maps connecting statistical methods to real FDA approval processes, and practice explaining why generic drugs cost less but work identically to brand-name versions. This application-focused approach proves more valuable for exams than rote memorization of statistical procedures.
Students should investigate pharmacokinetics modeling, drug metabolism pathways, and regulatory science frameworks. Understanding how factors like liver enzyme variations, drug interactions, and patient genetics affect bioequivalence provides deeper insight into personalized medicine. Exploring FDA approval processes, clinical trial design, and pharmaceutical economics also builds valuable knowledge for students considering careers in medicine, pharmacy, or biotechnology industries.
Related Micro-courses