Loading video…


 9 Concepts
 540 views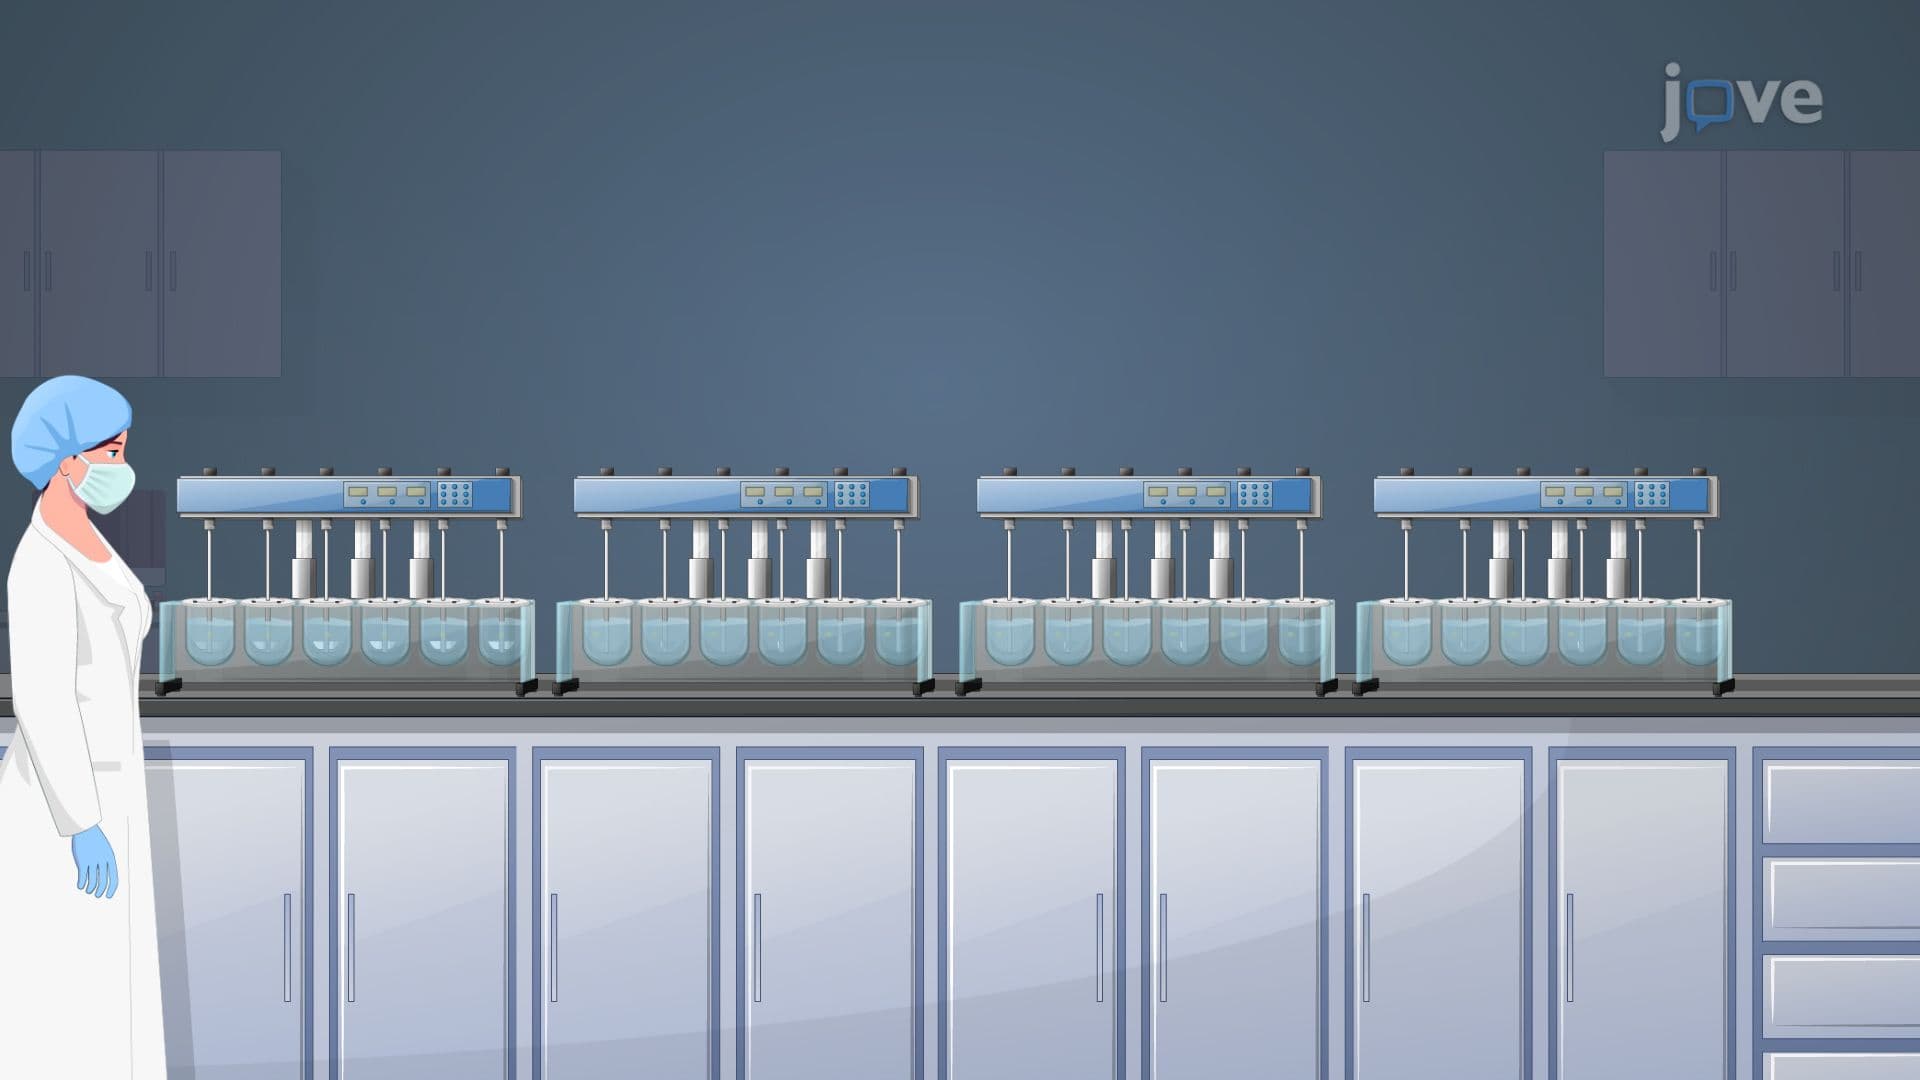

Video Summary: Drug Dissolution Requirements and Profile Comparison Explained
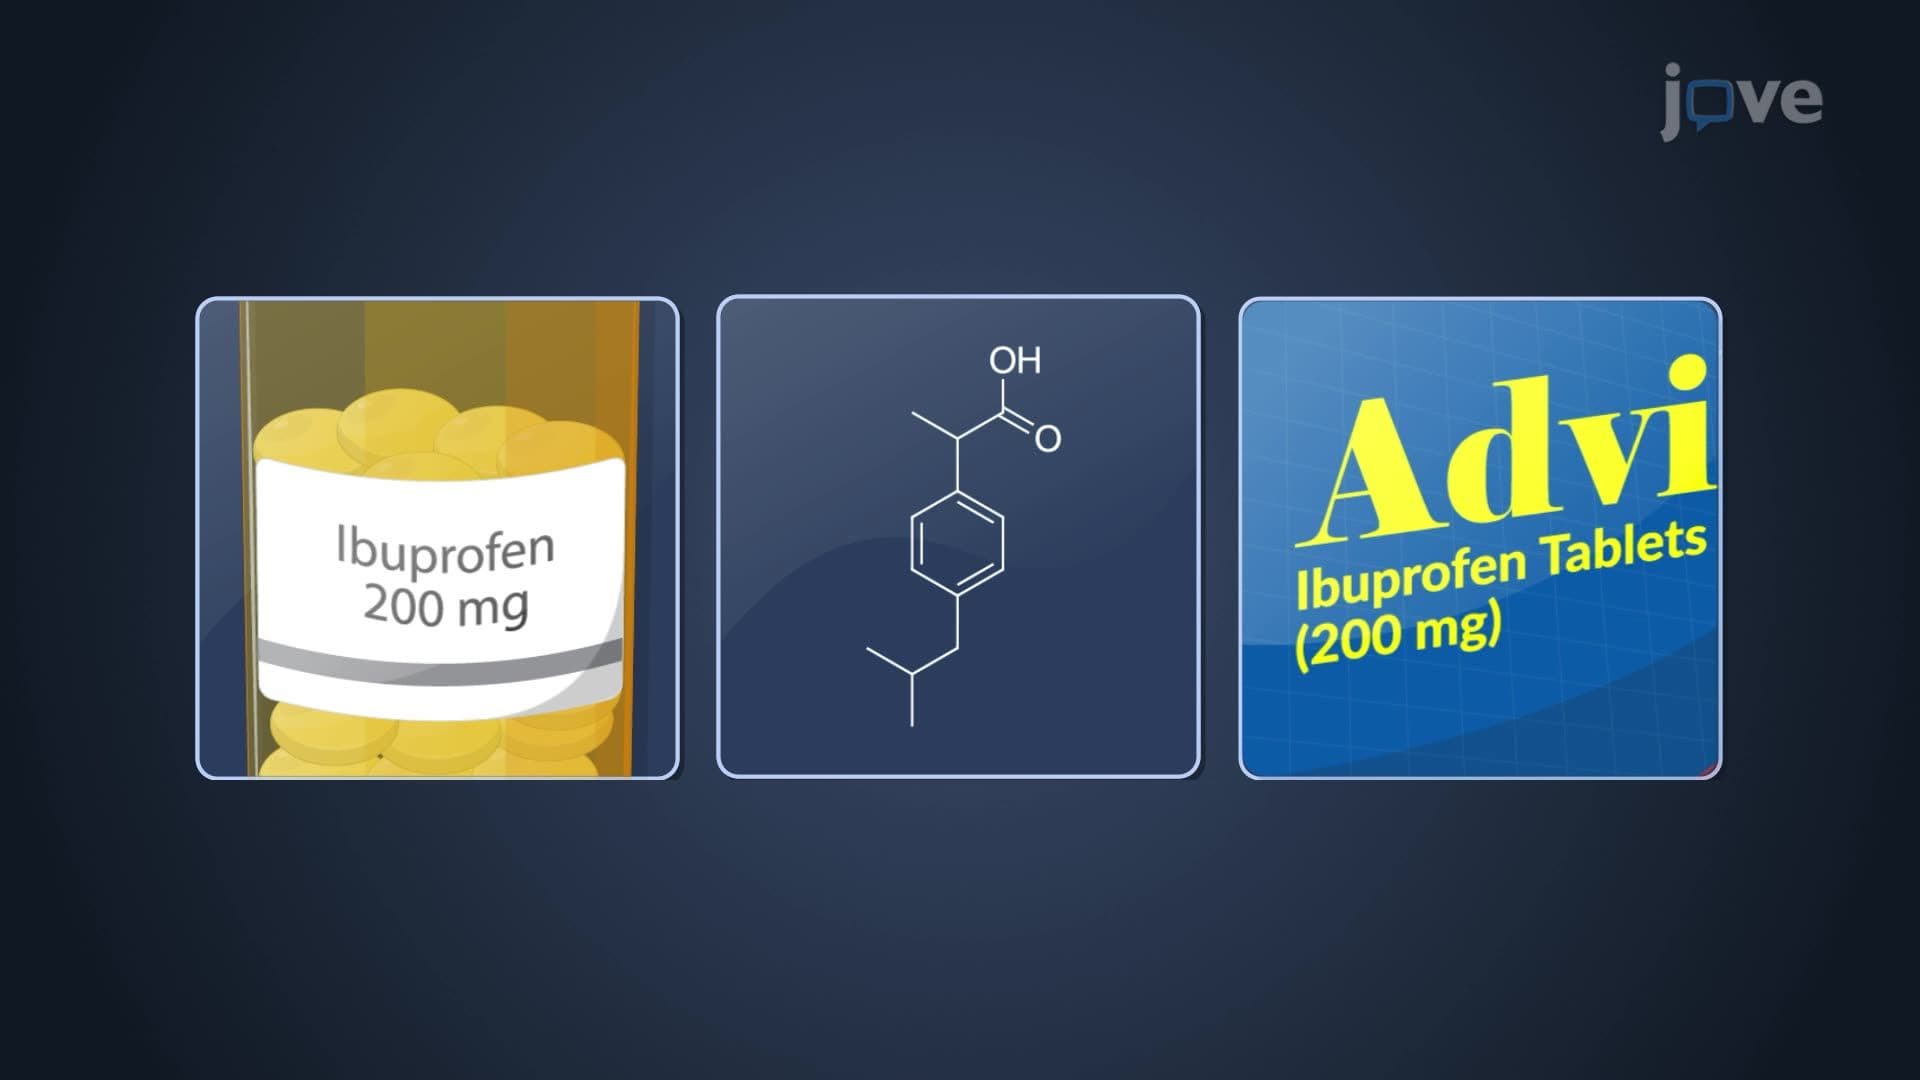
Ever wonder how the FDA ensures that generic medications like ibuprofen work exactly like brand-name Advil in your body? Drug dissolution requirements profile testing is the rigorous scientific process that guarantees pharmaceutical equivalence. When Pfizer develops a generic version of a blockbuster drug, they must prove their formulation dissolves at precisely the same rate as the original through standardized dissolution profile comparison studies. Drug Dissolution Requirements And Profile Comparison Explained reveals the three-stage testing protocol and mathematical similarity factors that protect millions of American patients. Watch the full video on JoVE Coach to master this concept with expert-led visuals and step-by-step explanations.
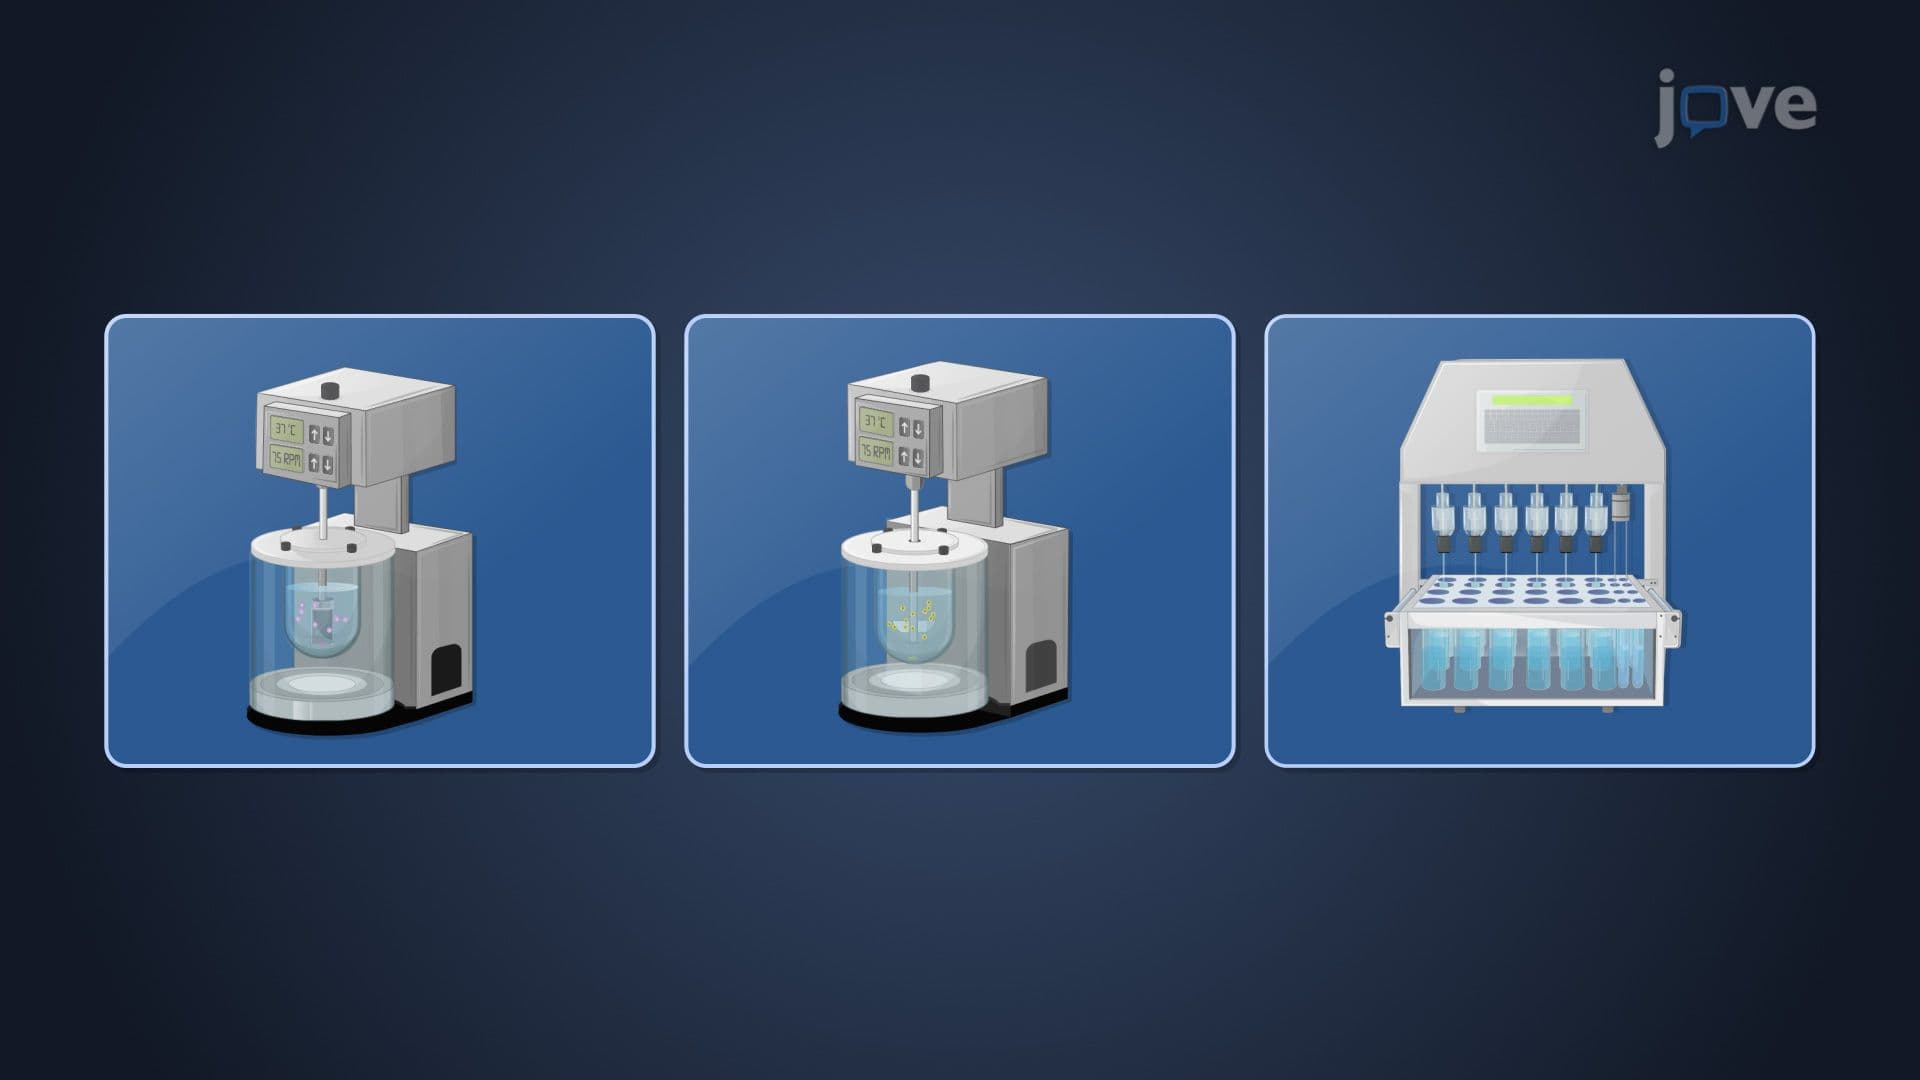
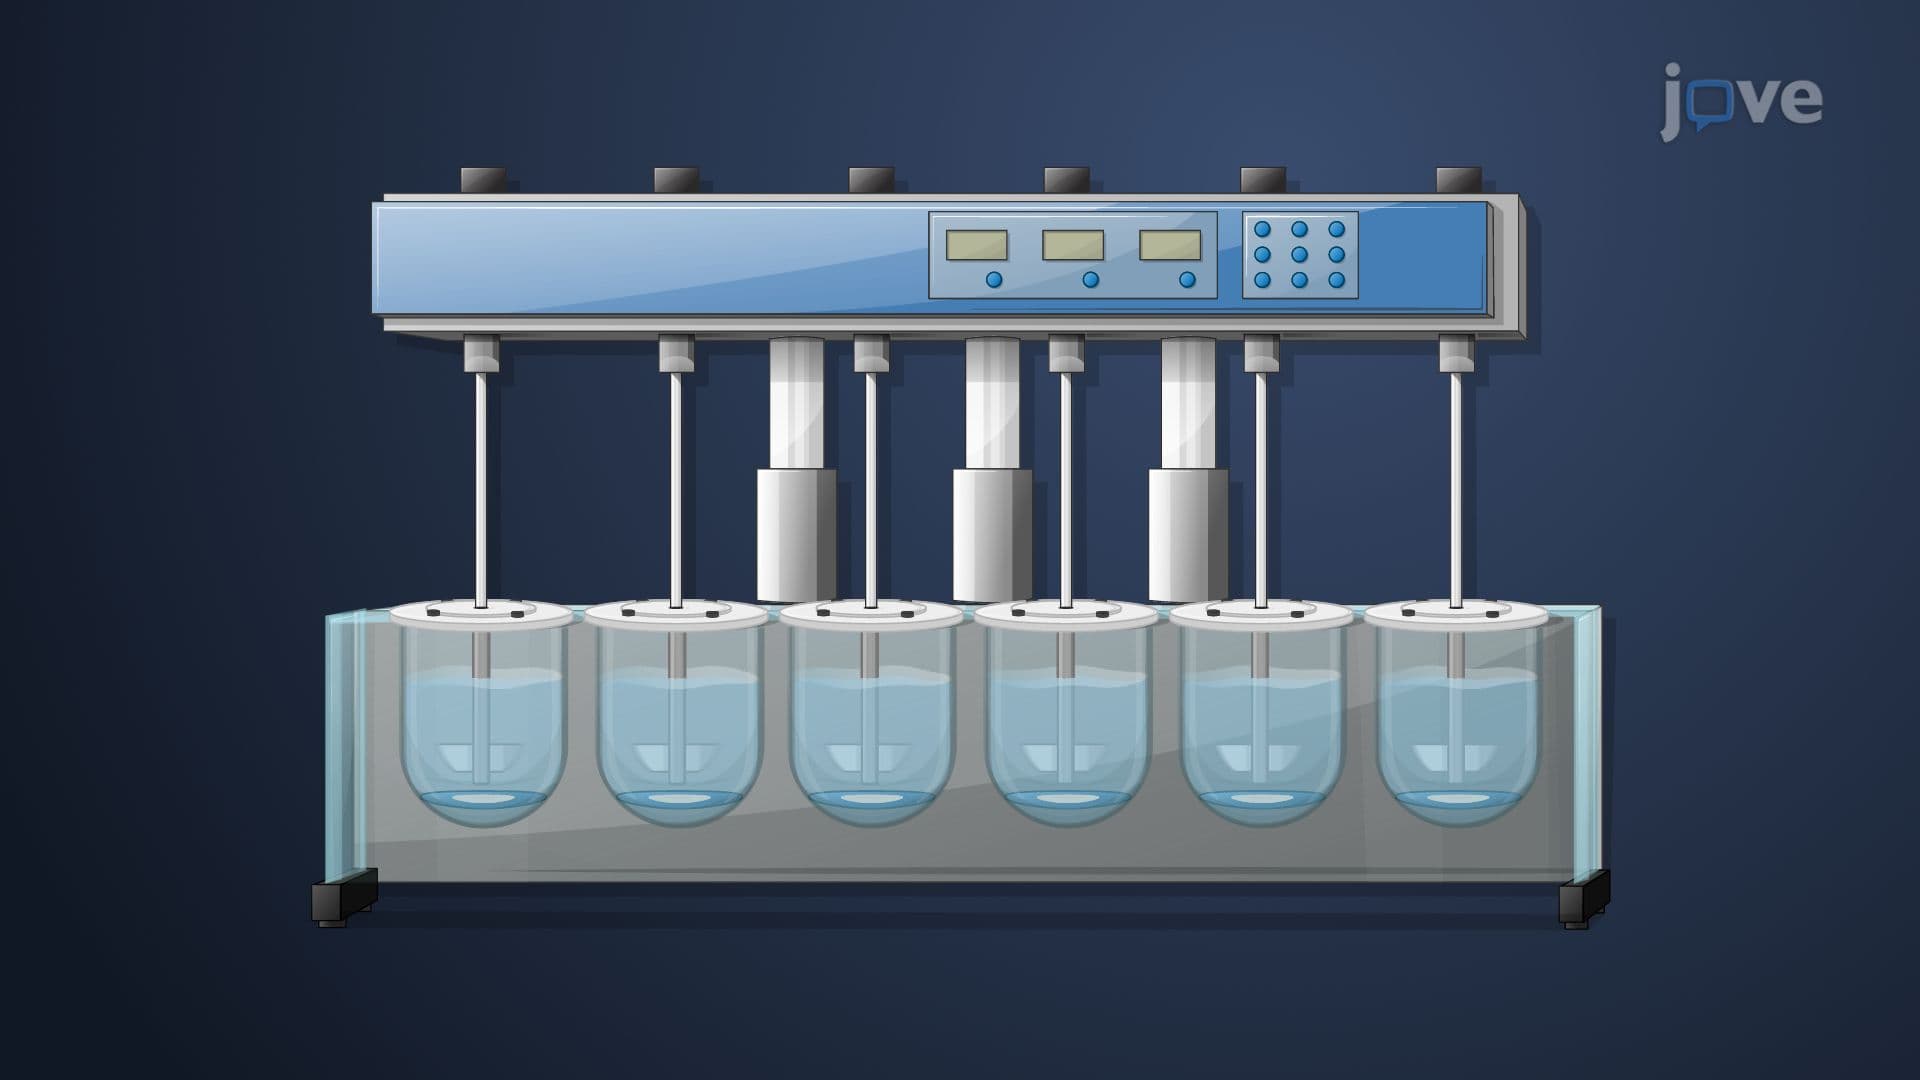
Drug dissolution requirements profile testing represents one of the most critical quality control measures in pharmaceutical manufacturing. This standardized methodology evaluates how quickly and completely a solid dosage form releases its active ingredient into solution, directly predicting how the medication will behave in the human digestive system. The FDA mandates these tests for all oral solid dosage forms, from common over-the-counter medications to complex extended-release formulations prescribed by physicians nationwide.
The dissolution testing process follows a hierarchical three-stage approach designed to minimize testing burden while maintaining rigorous quality standards. Stage 1 testing begins with six dosage units, requiring each unit to meet the Q+5% criteria, where Q represents the specified percentage of drug that must dissolve within the designated timeframe. For example, if a tablet must release 80% of its active ingredient within 30 minutes, each of the six units must achieve at least 85% dissolution.
When Stage 1 fails, testing advances to Stage 2 with twelve additional units. Here, the average dissolution of all twelve units must meet the Q value, while no individual unit can fall below Q-15%. This stage provides statistical confidence while accounting for normal manufacturing variability. Stage 3, the final level, requires testing twenty-four units total, with an average meeting Q value, no more than two units below Q-15%, and absolutely no units below Q-25%.
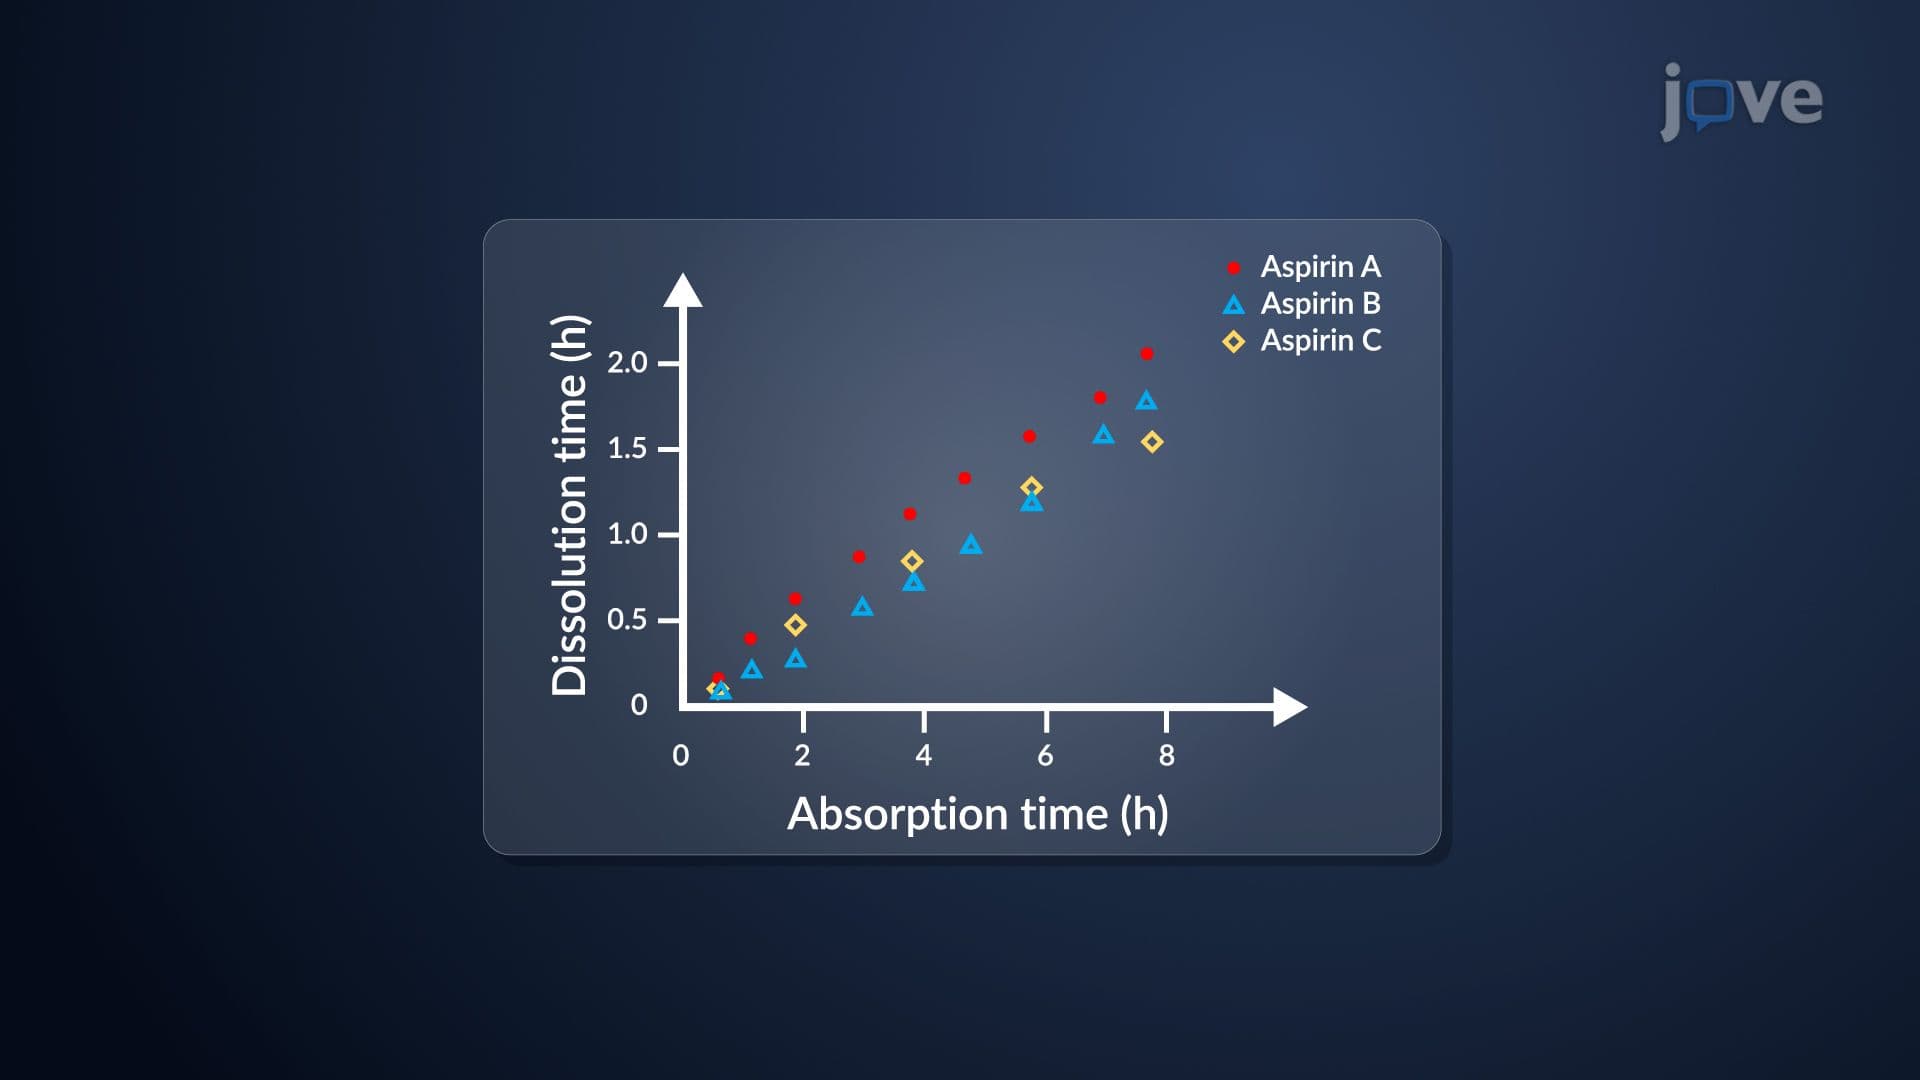
Drug dissolution requirements and profile comparison extends beyond single-point testing to comprehensive profile evaluation. The difference factor (f1) quantifies the percent error between test and reference profiles, calculated as: f1 = (sum of absolute differences / sum of reference values) × 100. Values between 0-15 indicate acceptable similarity. The similarity factor (f2) measures the logarithmic reciprocal of the sum of squared differences: f2 = 50 × log[(1 + mean squared differences)^(-0.5) × 100]. Values between 50-100 demonstrate bioequivalence, with f2=100 representing identical profiles.
These dissolution profile comparisons prove essential for generic drug manufacturers seeking FDA approval. When Teva Pharmaceuticals develops a generic version of Lipitor, they must demonstrate dissolution similarity to Pfizer's original formulation. The FDA uses f1 and f2 calculations to evaluate whether the generic product will deliver equivalent therapeutic outcomes. This process has enabled Americans to access affordable medications while maintaining safety standards, with generic drugs comprising over 90% of prescriptions filled in US pharmacies.
Students preparing for MCAT, PCAT, or pharmaceutical science courses encounter these concepts in physical pharmacy and biopharmaceutics coursework, where understanding dissolution kinetics proves crucial for predicting drug absorption and bioavailability.
Related Micro-courses