Loading subject page…


22,529 views

Video Summary: Ladder Diagrams Acid Base Equilibria Explained
Ever wondered how water treatment plants determine the exact pH needed to remove contaminants? Ladder diagrams acid base systems provide the visual roadmap chemists use to predict which ionic species will dominate at any pH level. These powerful graphical tools help explain why fluoride toothpaste works differently in acidic versus basic mouth environments. Ladder Diagrams Acid Base Equilibria Explained reveals how to interpret these critical chemistry diagrams for real-world applications. Watch the full video on JoVE Coach to master this concept with expert-led visuals and step-by-step explanations.
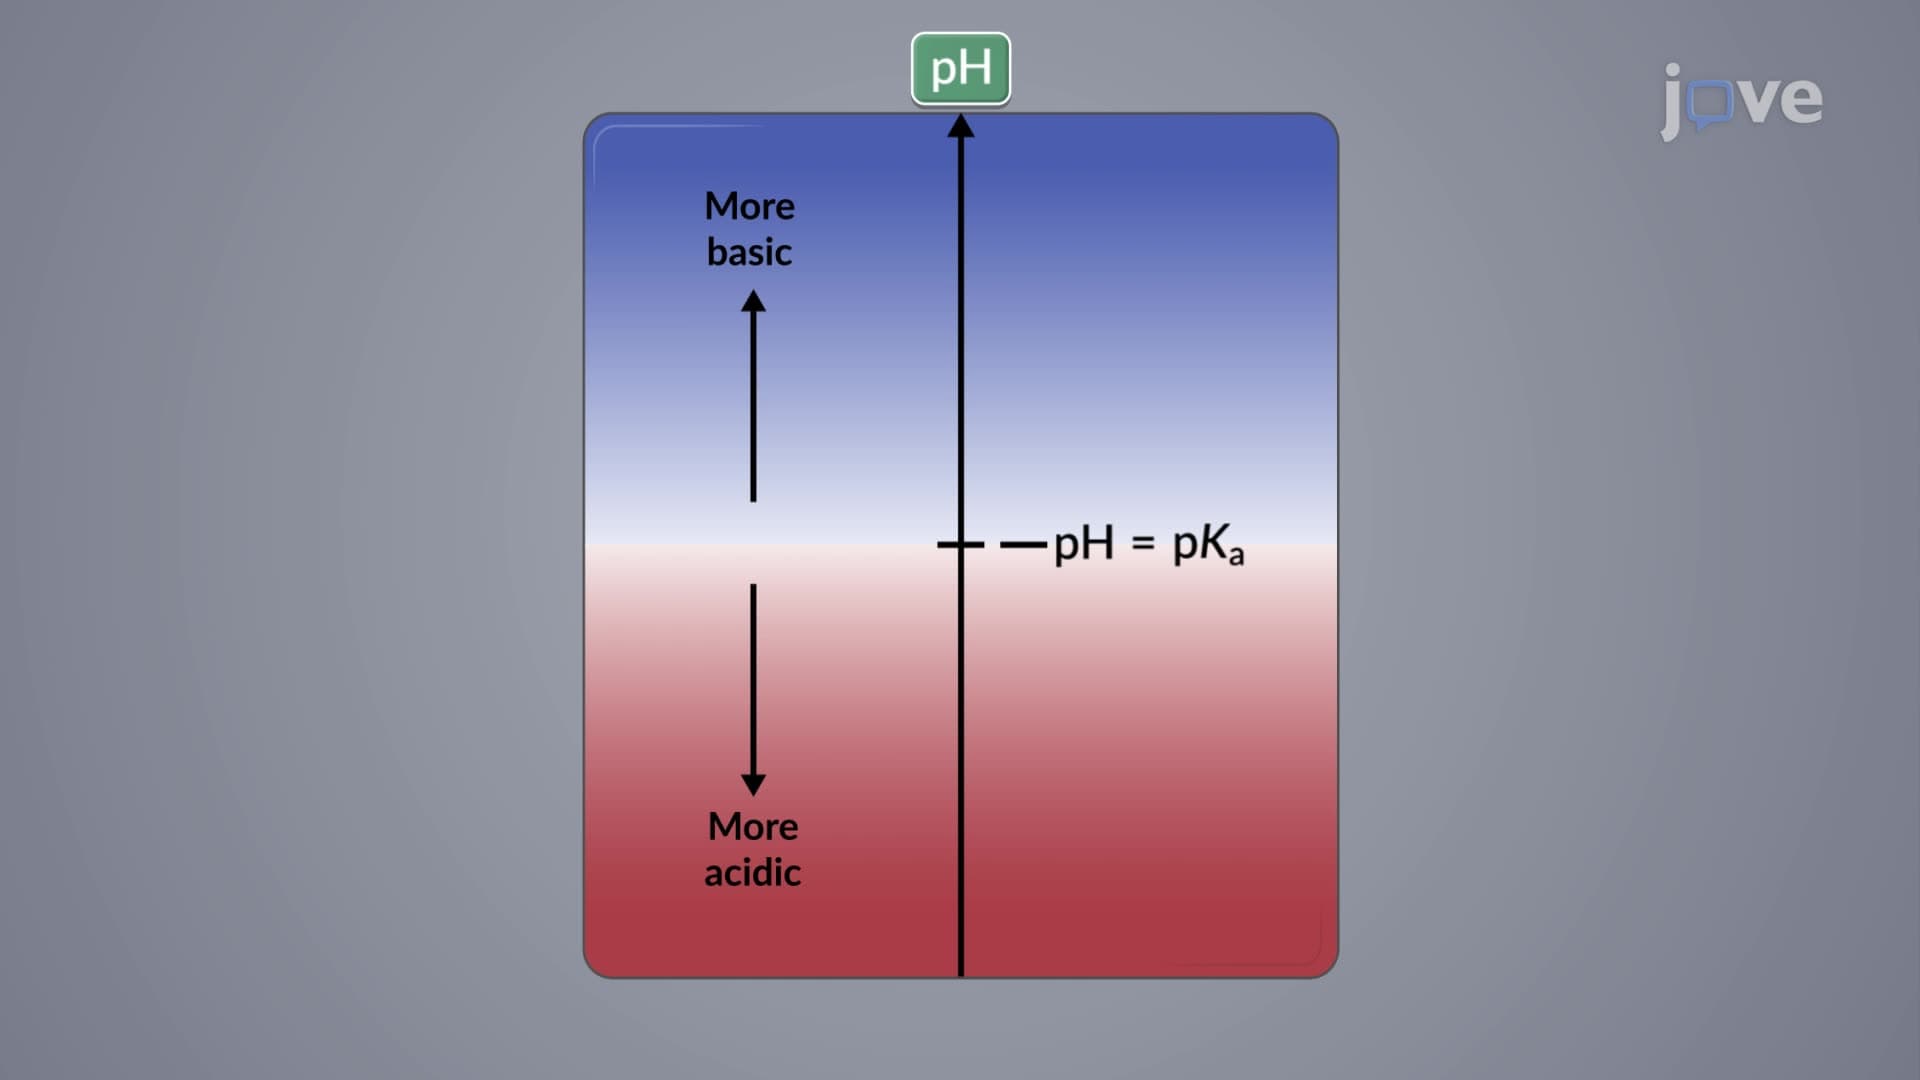
Ladder diagrams acid base representations transform complex equilibrium calculations into intuitive visual tools. These diagrams plot pH on the vertical axis while using horizontal lines to mark critical pKa values, creating distinct regions where specific chemical species predominate. Unlike traditional equilibrium expressions, ladder diagrams instantly reveal which forms of an acid or base will be most abundant at any environmental pH.
The foundation of any acid base ladder diagram chemistry lies in identifying pKa values and drawing horizontal reference lines. For a simple monoprotic system like hydrofluoric acid (HF/F-), the pKa of 3.17 creates a horizontal dividing line. Below pH 3.17, the molecular HF form dominates because the solution is too acidic for significant deprotonation. Above pH 3.17, the fluoride ion (F-) becomes the major species as the basic conditions favor the deprotonated form.
When multiple acid-base pairs exist simultaneously, ladder diagrams become more sophisticated. The HF/NH3 system demonstrates this complexity with two key pKa values: HF at 3.17 and NH4+ at 9.24. This creates three distinct pH regions with different predominant species combinations. Understanding these zones helps predict chemical behavior in mixed systems commonly encountered in environmental analysis and pharmaceutical formulations.
Learning how to draw acid base ladder diagrams proves essential for success on AP Chemistry exams, MCAT preparation, and undergraduate analytical chemistry courses. These diagrams frequently appear in problems involving buffer calculations, titration endpoint predictions, and species distribution analysis. For instance, municipal water treatment facilities use ladder diagram principles to optimize coagulant addition, ensuring maximum pollutant removal efficiency.
The pharmaceutical industry relies heavily on pKa ladder diagram analysis for drug formulation and bioavailability studies. Aspirin absorption in the stomach versus small intestine depends on pH-driven speciation changes that ladder diagrams clearly illustrate. Similarly, environmental chemists use these tools to predict heavy metal mobility in contaminated groundwater, where pH variations dramatically affect metal ion speciation and transport behavior.
College-level chemistry courses expand ladder diagram applications to include polyprotic acids, complex formation equilibria, and simultaneous equilibrium systems. Students preparing for standardized exams should focus on rapid diagram interpretation rather than detailed construction, as most test questions emphasize species identification and predominance zone analysis rather than artistic precision.
Related Micro-courses