Loading subject page…


22,529 views


Video Summary: What Is Ladder Diagrams Complexation Equilibria
Ever wonder how water treatment plants remove toxic metals like cadmium from drinking water? Ladder diagrams complexation reveal exactly which chemical species dominate under different conditions, making them essential tools for environmental engineers. What is Ladder Diagrams Complexation Equilibria becomes clear when studying how metal ions bind with ligands like ammonia in predictable patterns. Watch the full video on JoVE Coach to master this concept with expert-led visuals and step-by-step explanations.
Ladder diagrams complexation represent one of analytical chemistry's most powerful visualization tools, displaying how metal-ligand complex species distribute across different ligand concentrations. These diagrams plot the negative logarithm of free ligand concentration (pL) on the x-axis against the logarithm of formation constants, creating distinct "steps" that resemble a ladder-hence the name.
The horizontal lines in complexation equilibria ladder diagram correspond to logarithmic formation constants (log K values), which define the thermodynamic stability of each complex. For cadmium-ammonia systems, when pNH3 exceeds 2.55, free Cd2+ ions predominate because insufficient ammonia exists to form stable complexes. As ammonia concentration increases (lower pNH3), sequential complexes form: [Cd(NH3)]2+, [Cd(NH3)2]2+, [Cd(NH3)3]2+, and finally [Cd(NH3)4]2+.
Water treatment facilities across the United States employ these principles when designing chelation processes. For example, EDTA treatment systems in California's semiconductor manufacturing plants use metal ligand ladder diagram calculations to optimize metal removal efficiency. Similarly, pharmaceutical companies developing contrast agents for MRI procedures rely on gadolinium complexation diagrams to ensure stable, non-toxic formulations.
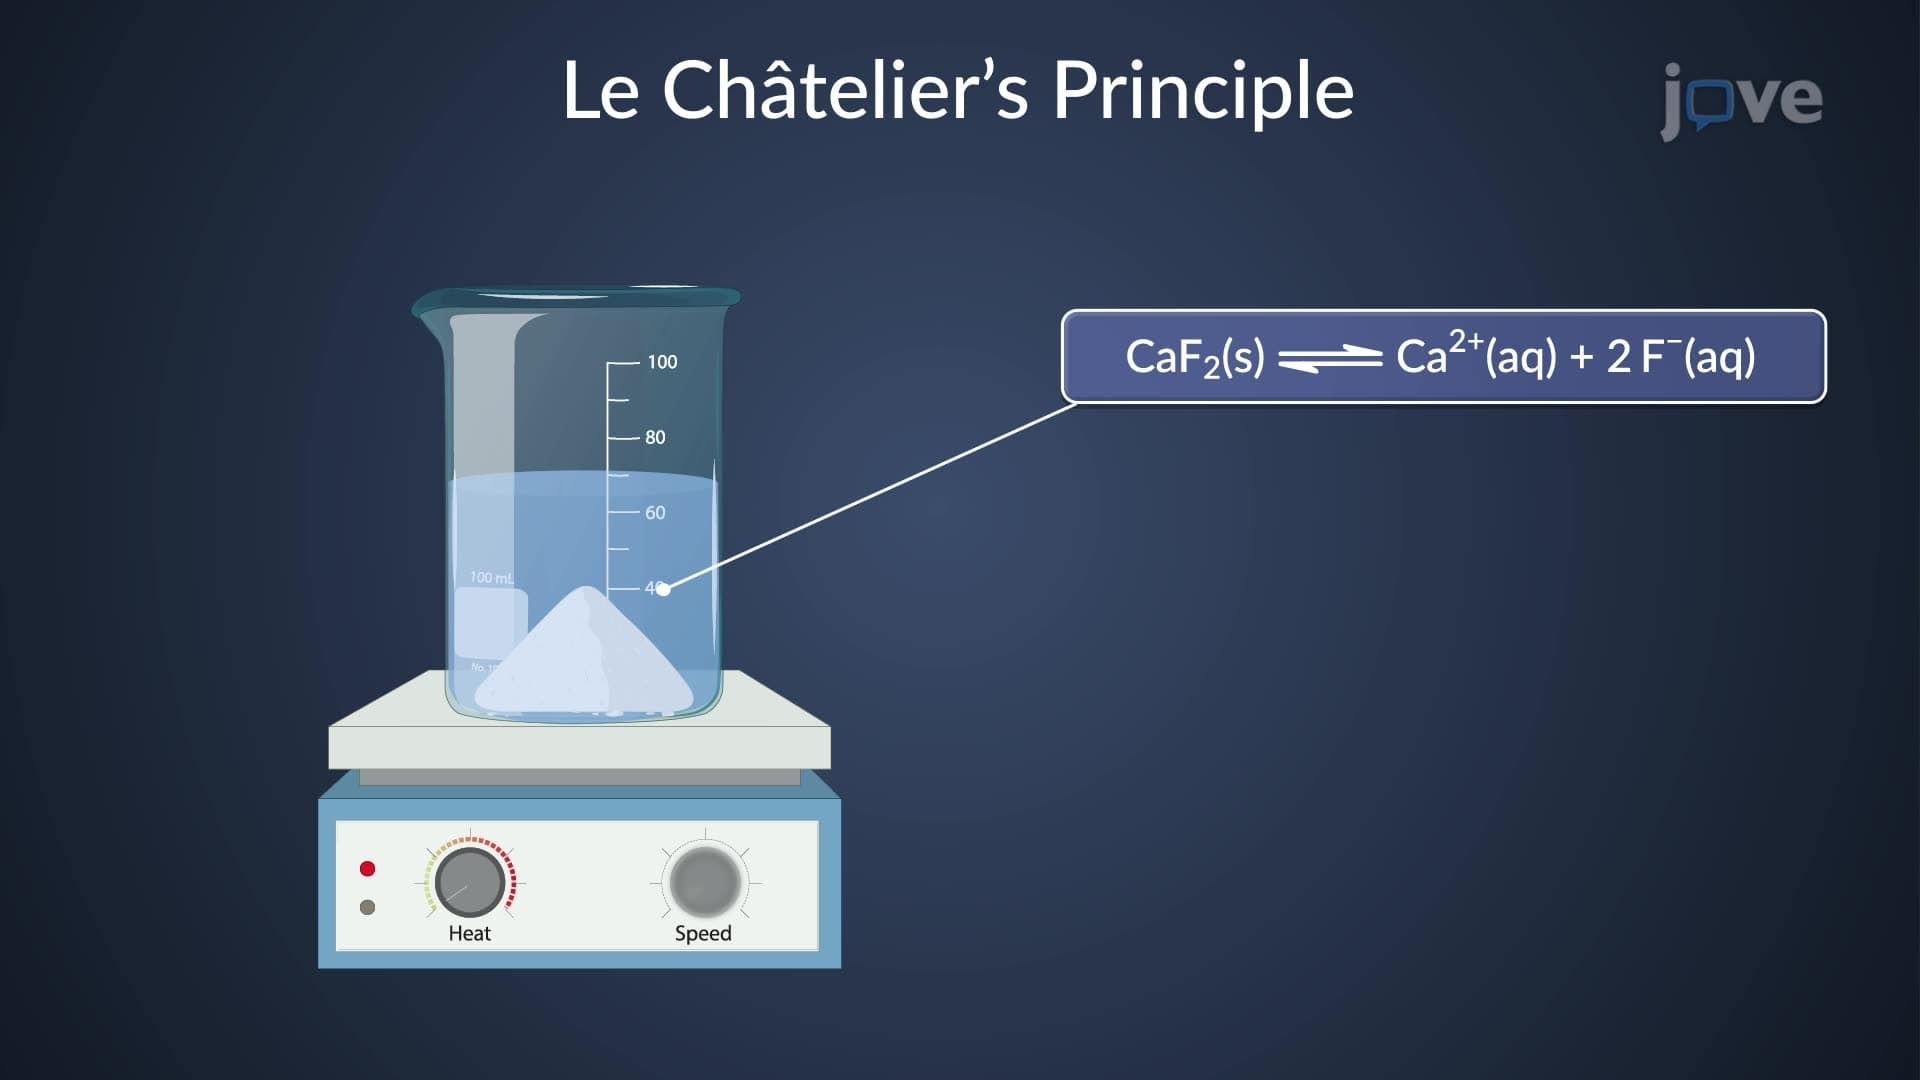
Students preparing for AP Chemistry exams encounter these concepts when studying equilibrium systems and Le Chatelier's principle. College-level analytical chemistry courses at institutions like MIT and UC Berkeley extensively use ladder diagrams for quantitative analysis problems. The MCAT frequently tests understanding of metal-ligand interactions in biological systems, where iron complexation with hemoglobin exemplifies these principles.
Understanding complex species distribution through ladder diagrams proves essential for environmental monitoring, pharmaceutical development, and industrial process optimization-making this concept invaluable for future chemists, environmental scientists, and engineers.
Related Micro-courses