Loading subject page…


22,530 views


Video Summary: What Is Ladder Diagrams Redox Equilibria
Ever wonder how battery manufacturers predict which metals will power your smartphone most efficiently? Ladder diagrams redox systems provide the roadmap by plotting electrochemical potentials to show which oxidation states dominate under specific conditions. For instance, understanding What is Ladder Diagrams Redox Equilibria helps explain why lithium-ion batteries in Tesla vehicles maintain consistent voltage output across temperature ranges. Watch the full video on JoVE Coach to master this concept with expert-led visuals and step-by-step explanations.
Ladder diagrams redox equilibria represent one of the most powerful visualization tools in electrochemistry, transforming complex redox relationships into intuitive graphical representations. These diagrams plot electrochemical potential (E) on the vertical axis against different oxidation states of elements, creating a "ladder" where each "rung" represents a specific half-reaction with its corresponding standard reduction potential (E°).
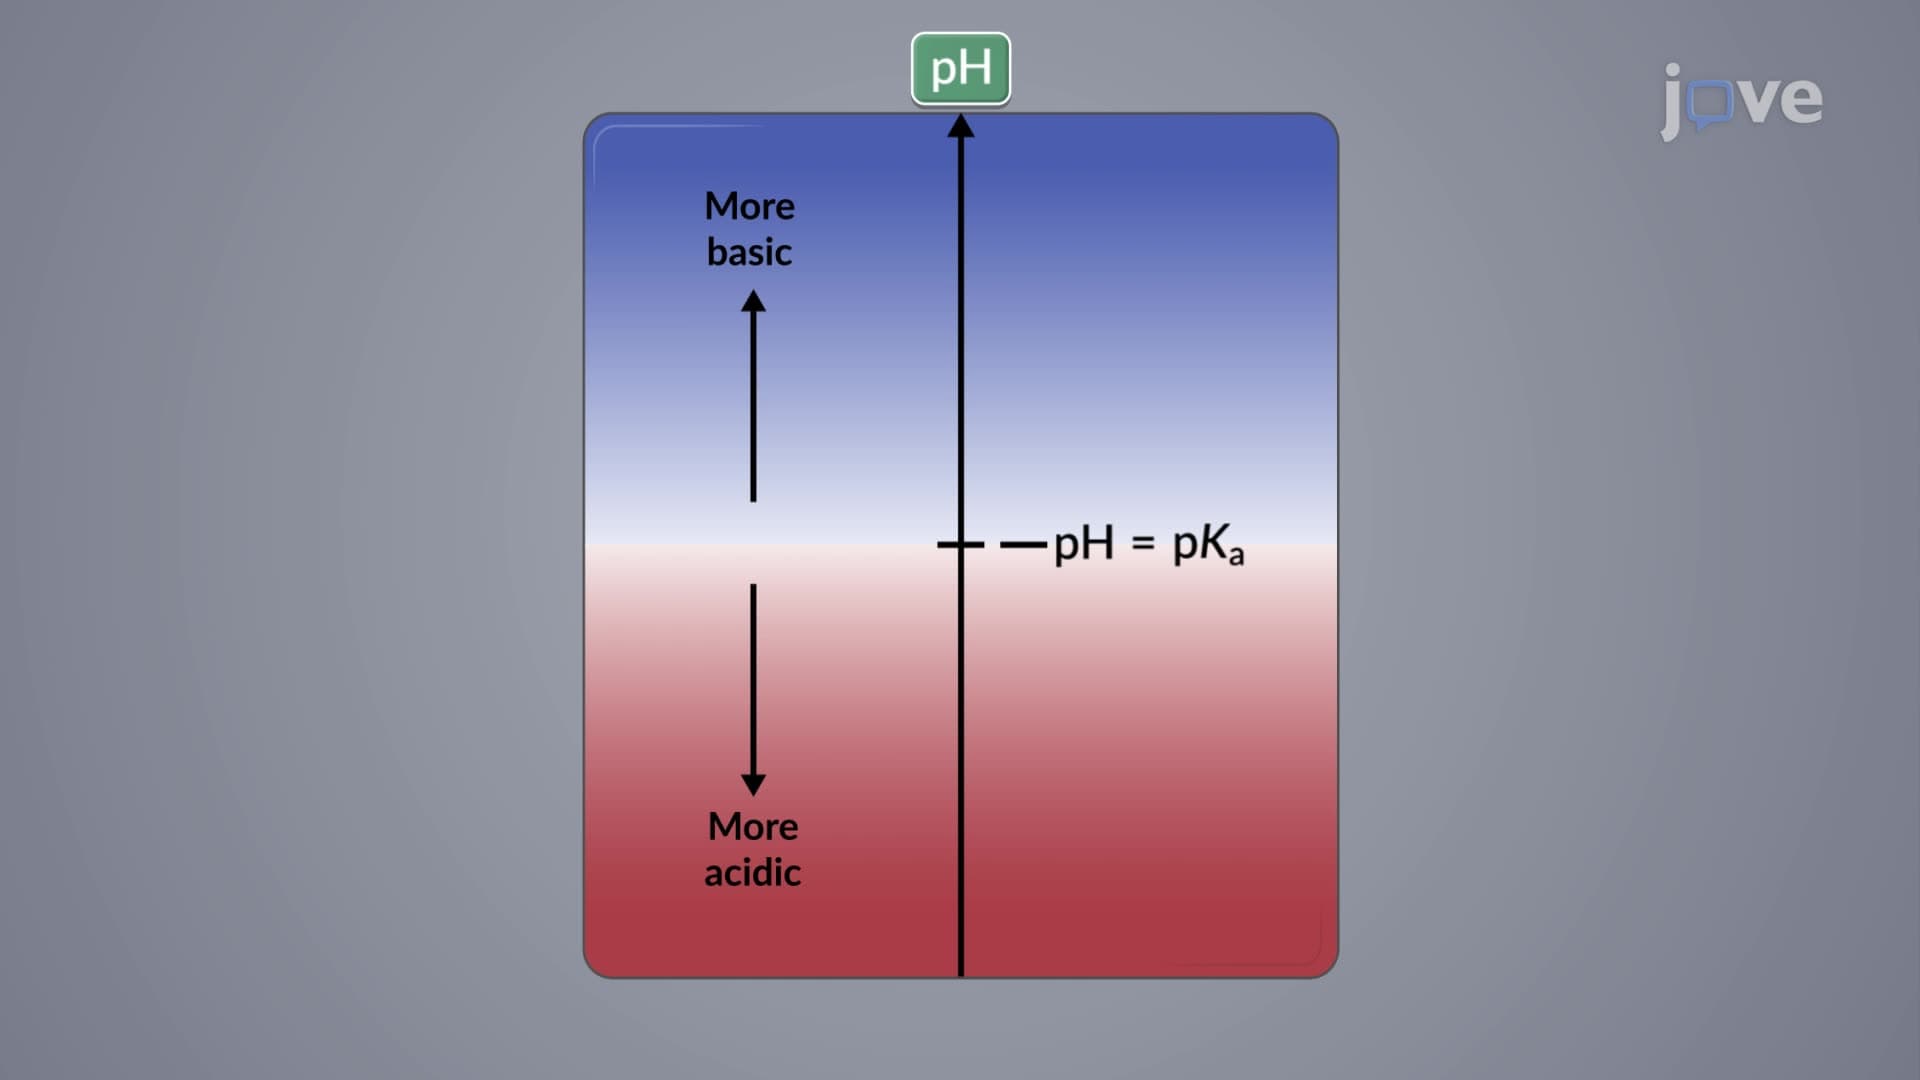
The fundamental principle underlying redox ladder diagram chemistry centers on the concept that at any given potential, only one oxidation state predominates for each element. When the system potential equals the standard reduction potential for a particular half-reaction, both oxidation states exist in equal concentrations. Above this potential, the oxidized form dominates; below it, the reduced form prevails.
How to interpret redox ladder diagrams requires understanding that electrons naturally flow from higher potential to lower potential positions on the diagram. Consider the iron system: Fe³⁺/Fe²⁺ has E° = +0.771 V, while the tin system Sn⁴⁺/Sn²⁺ shows E° = +0.154 V. When these systems interact, electrons flow from the tin couple (lower potential) to the iron couple (higher potential), driving the reaction: Sn²⁺ + 2Fe³⁺ → Sn⁴⁺ + 2Fe²⁺.
This principle explains why galvanized steel (zinc-coated iron) resists corrosion-zinc's lower reduction potential means it preferentially oxidizes, protecting the underlying iron. The same logic applies to cathodic protection systems used on underground pipelines and ship hulls across the United States.
The reduction potential ladder diagram becomes more complex when pH variations occur. Many half-reactions involve H⁺ ions, causing their E° values to shift with changing pH according to the Nernst equation. The uranium example (UO₂²⁺/U⁴⁺) demonstrates this pH dependence, where E° changes from +0.327 V at pH 0 to different values as pH increases.
This pH sensitivity proves crucial in environmental chemistry applications. For instance, the EPA uses ladder diagrams to model arsenic speciation in groundwater systems, where pH changes determine whether toxic As(III) or less harmful As(V) predominates. Similarly, water treatment facilities employ these principles when designing systems to remove heavy metals from industrial wastewater.
Redox equilibria visualization through ladder diagrams appears frequently in AP Chemistry exams, college-level analytical chemistry courses, and MCAT preparation. Students encounter these concepts when studying electrochemical cells, corrosion mechanisms, and biological electron transport chains. The visual nature of ladder diagrams makes them particularly valuable for understanding complex multi-electron systems like those found in photosynthesis and cellular respiration.
In industrial applications, battery manufacturers like those producing Tesla's lithium-ion cells use sophisticated ladder diagram analysis to optimize electrode materials and predict battery performance under various operating conditions.
Related Micro-courses