Loading subject page…

- Analytical Chemistry
- Introduction to Molecular Spectroscopy
- UV–Vis Spectrum
Micro-course: Introduction to Molecular Spectroscopy
36,707 views
Learn key concepts and earn your certificate.




UV–Vis Spectrum

00:00
01:30
Video Summary: What Is Uv Vis Spectrum
Ever wonder how forensic labs identify unknown drugs or how pharmaceutical companies ensure medication purity? The UV Vis spectrum explained reveals how molecules absorb specific wavelengths of ultraviolet and visible light, creating unique "fingerprints" for identification. When the FDA tests aspirin tablets for quality control, they analyze the UV Vis absorption spectrum to verify the active ingredient concentration and detect impurities. Understanding what is UV Vis spectrum enables scientists to determine molecular structure and concentration with remarkable precision. Watch the full video on JoVE Coach to master this concept with expert-led visuals and step-by-step explanations.
- Understand what is UV Vis spectrum and how it represents the relationship between light absorption and wavelength for molecular analysis
- Identify the key components of UV Vis spectra including lambda max values, absorption bands, and molar absorptivity measurements
- Analyze how the Beer-Lambert law connects absorbance to concentration and explains why log epsilon is plotted on the y-axis
- Recognize the significance of absorption bands and why molecules absorb light over broad wavelength ranges rather than at single points
- Evaluate proper solvent selection criteria for UV Vis spectroscopy to minimize interference and obtain accurate spectral data
- Apply UV Vis spectral interpretation to determine molecular electronic transitions from HOMO to LUMO energy levels
- Compare absorption intensities using log epsilon values to distinguish between strong and weak electronic transitions
- Explore real-world applications of UV Vis spectrum analysis in pharmaceutical quality control and environmental monitoring
Understanding the UV Vis Spectrum Fundamentals
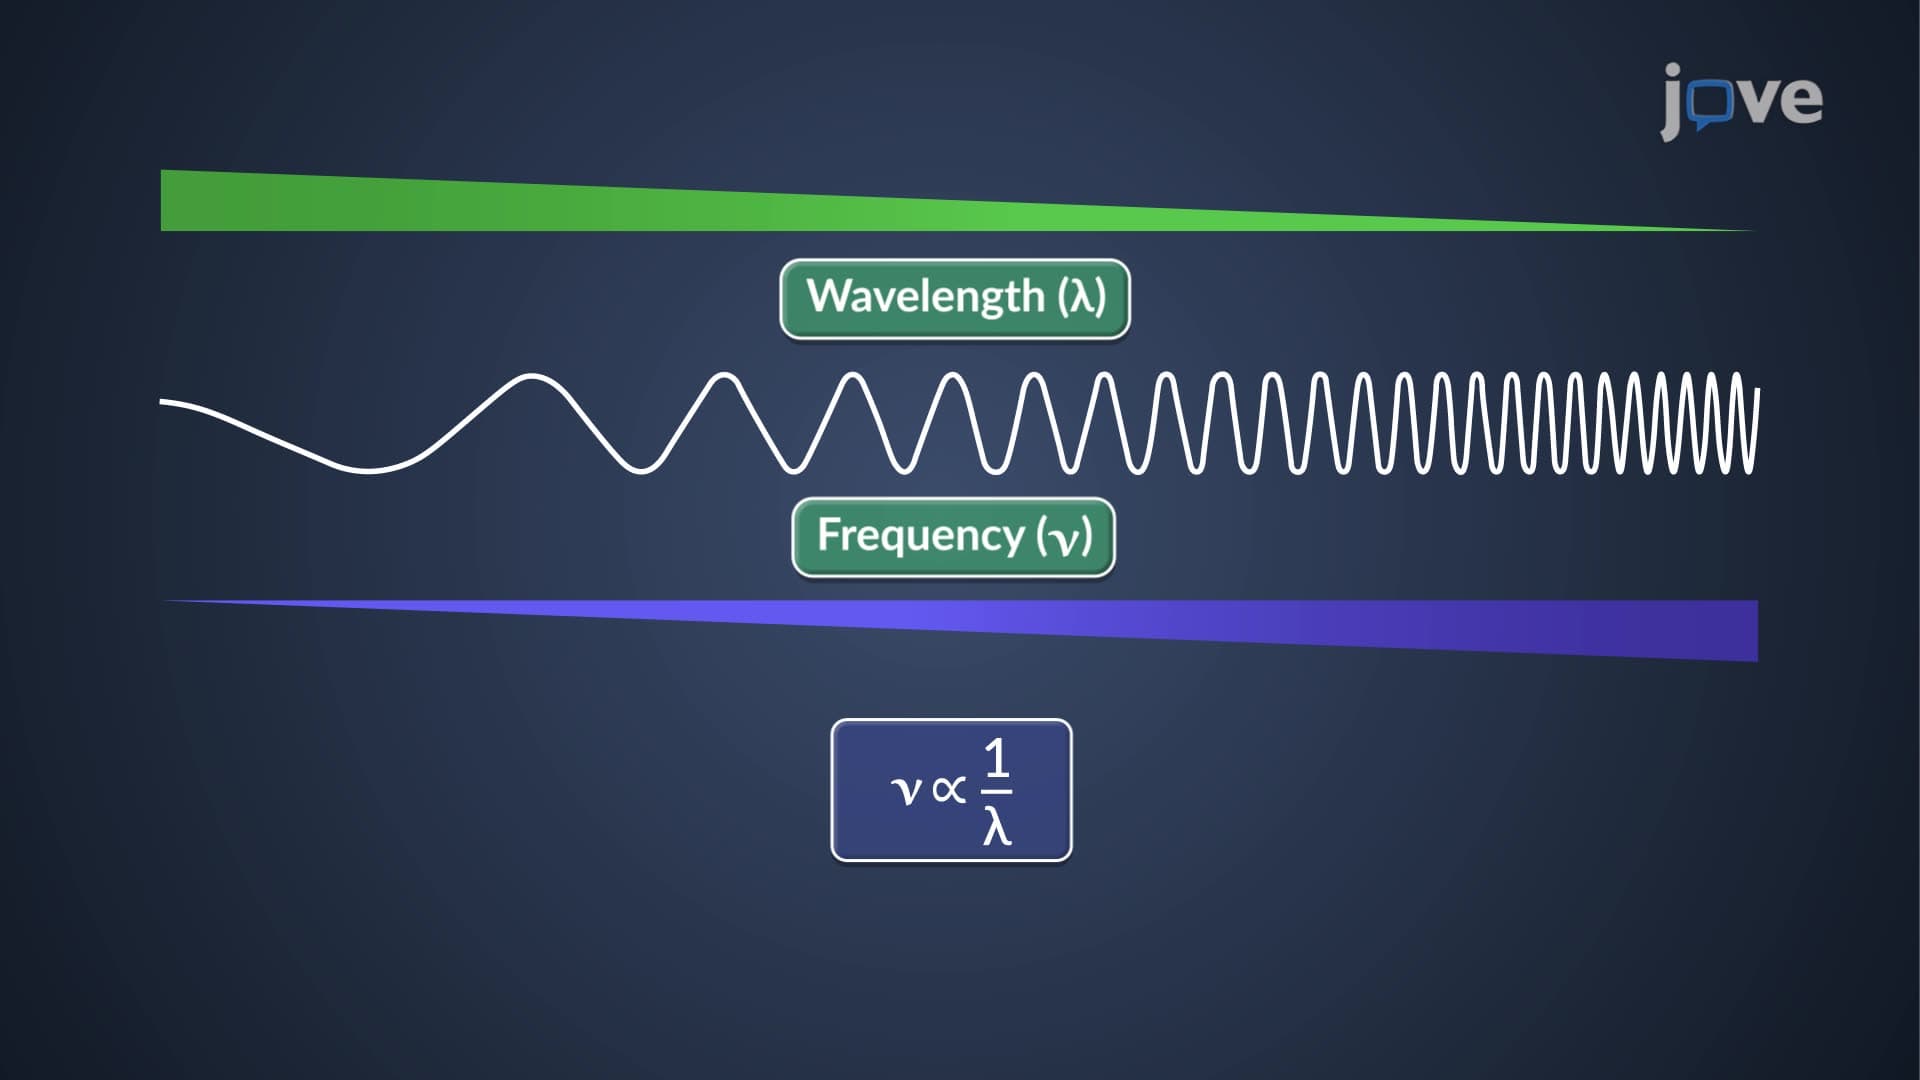
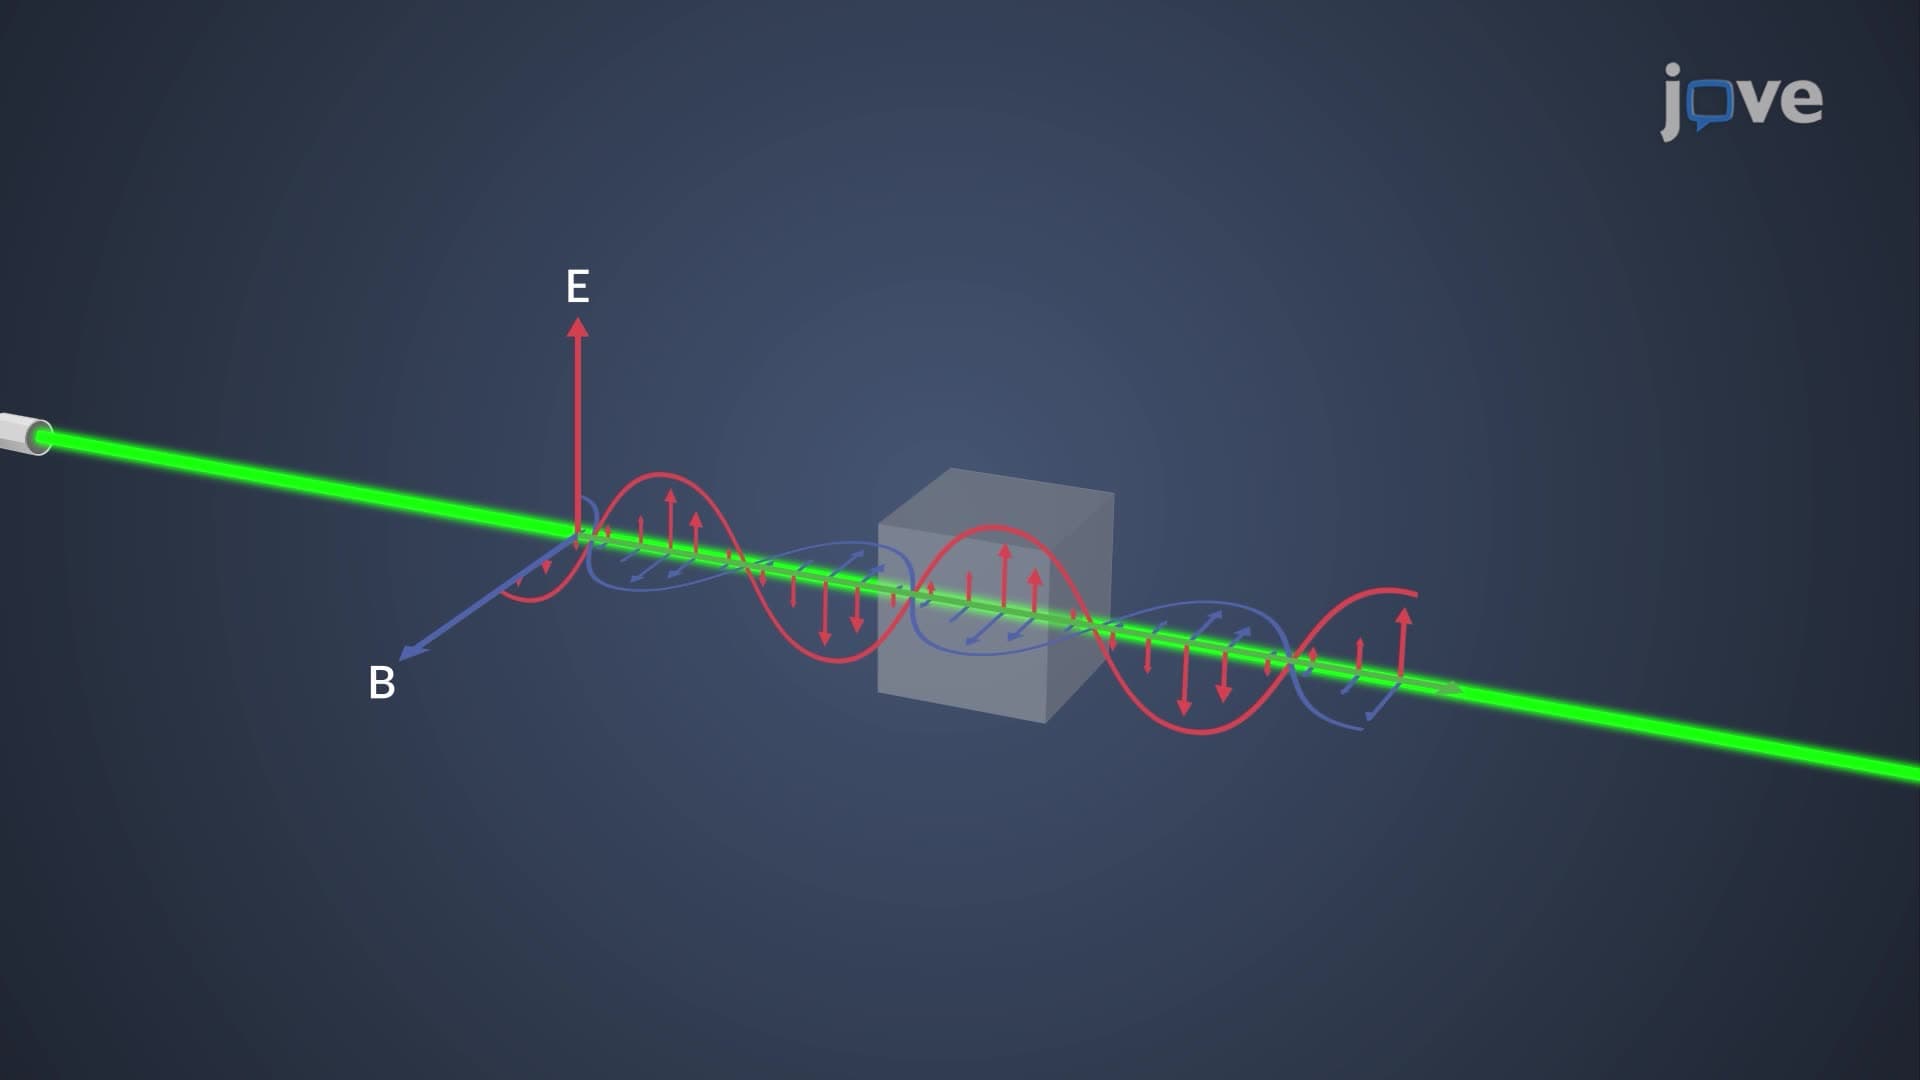
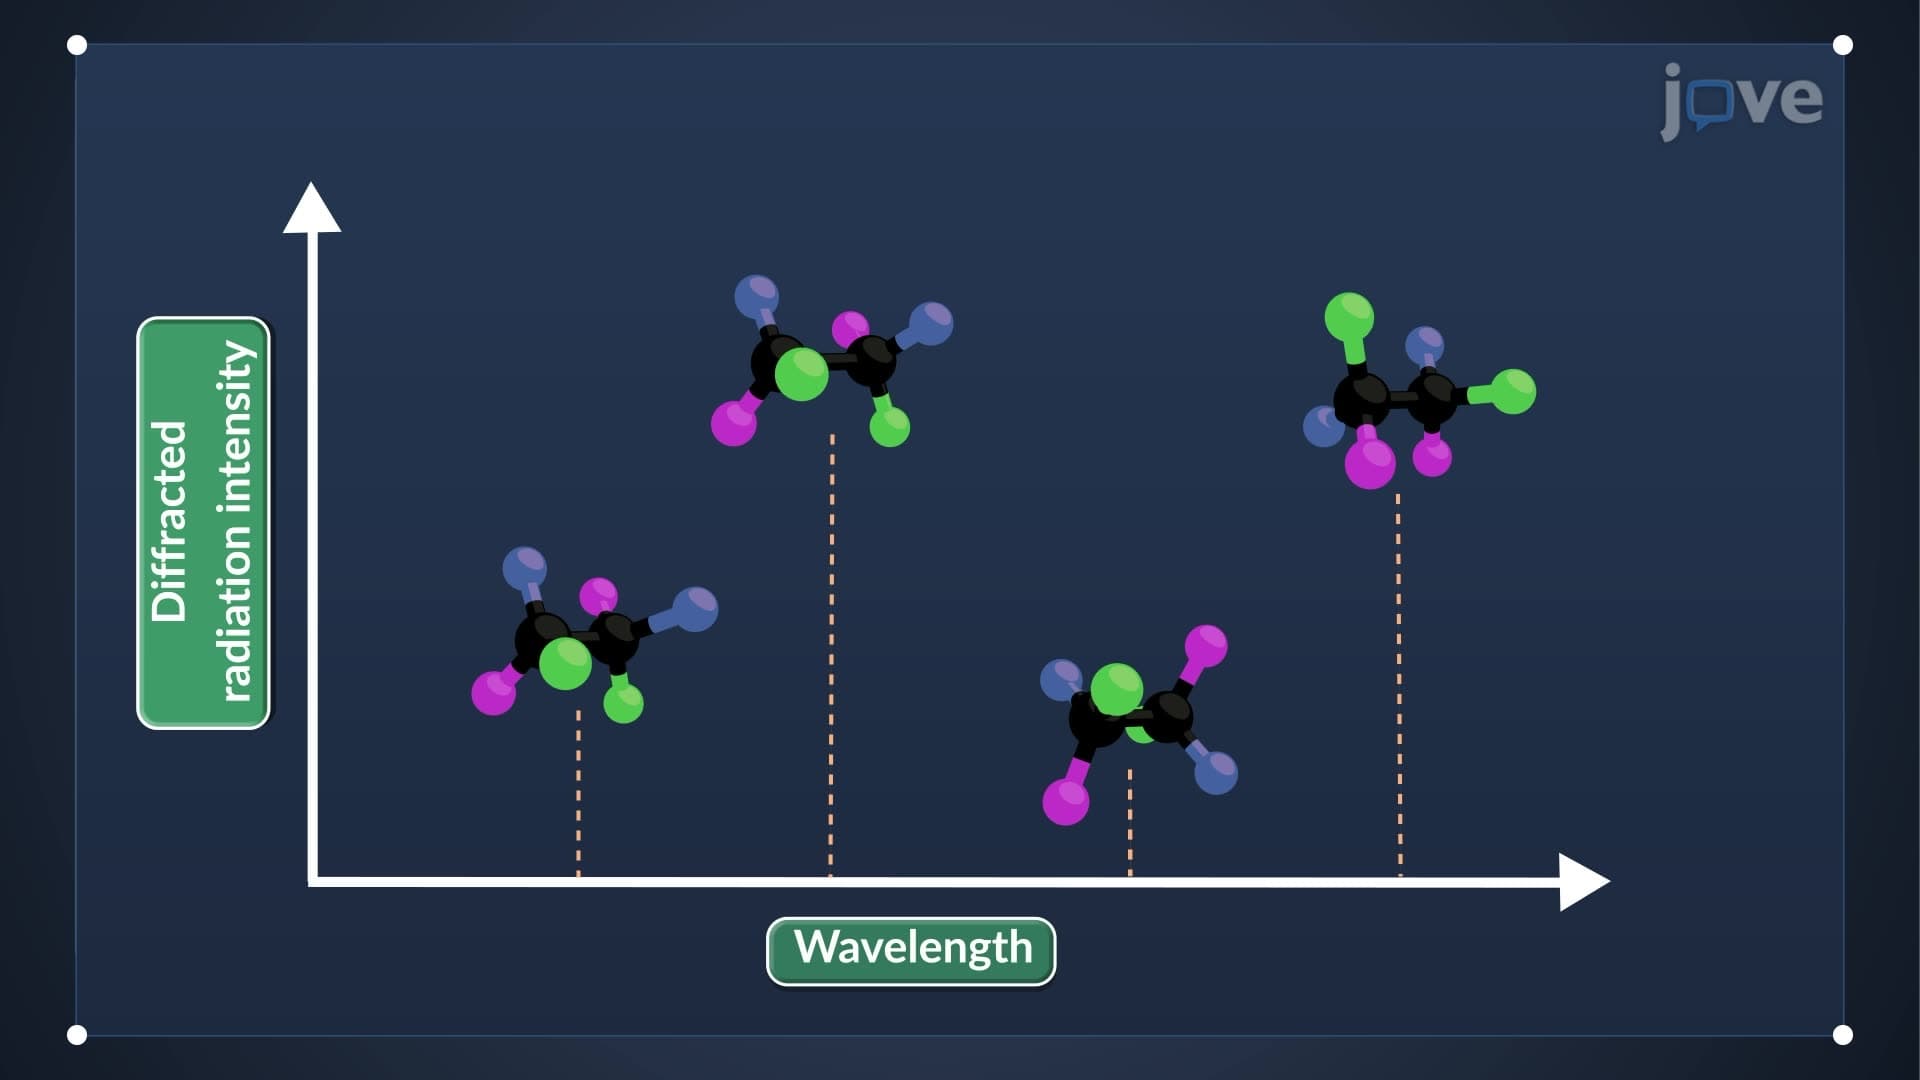
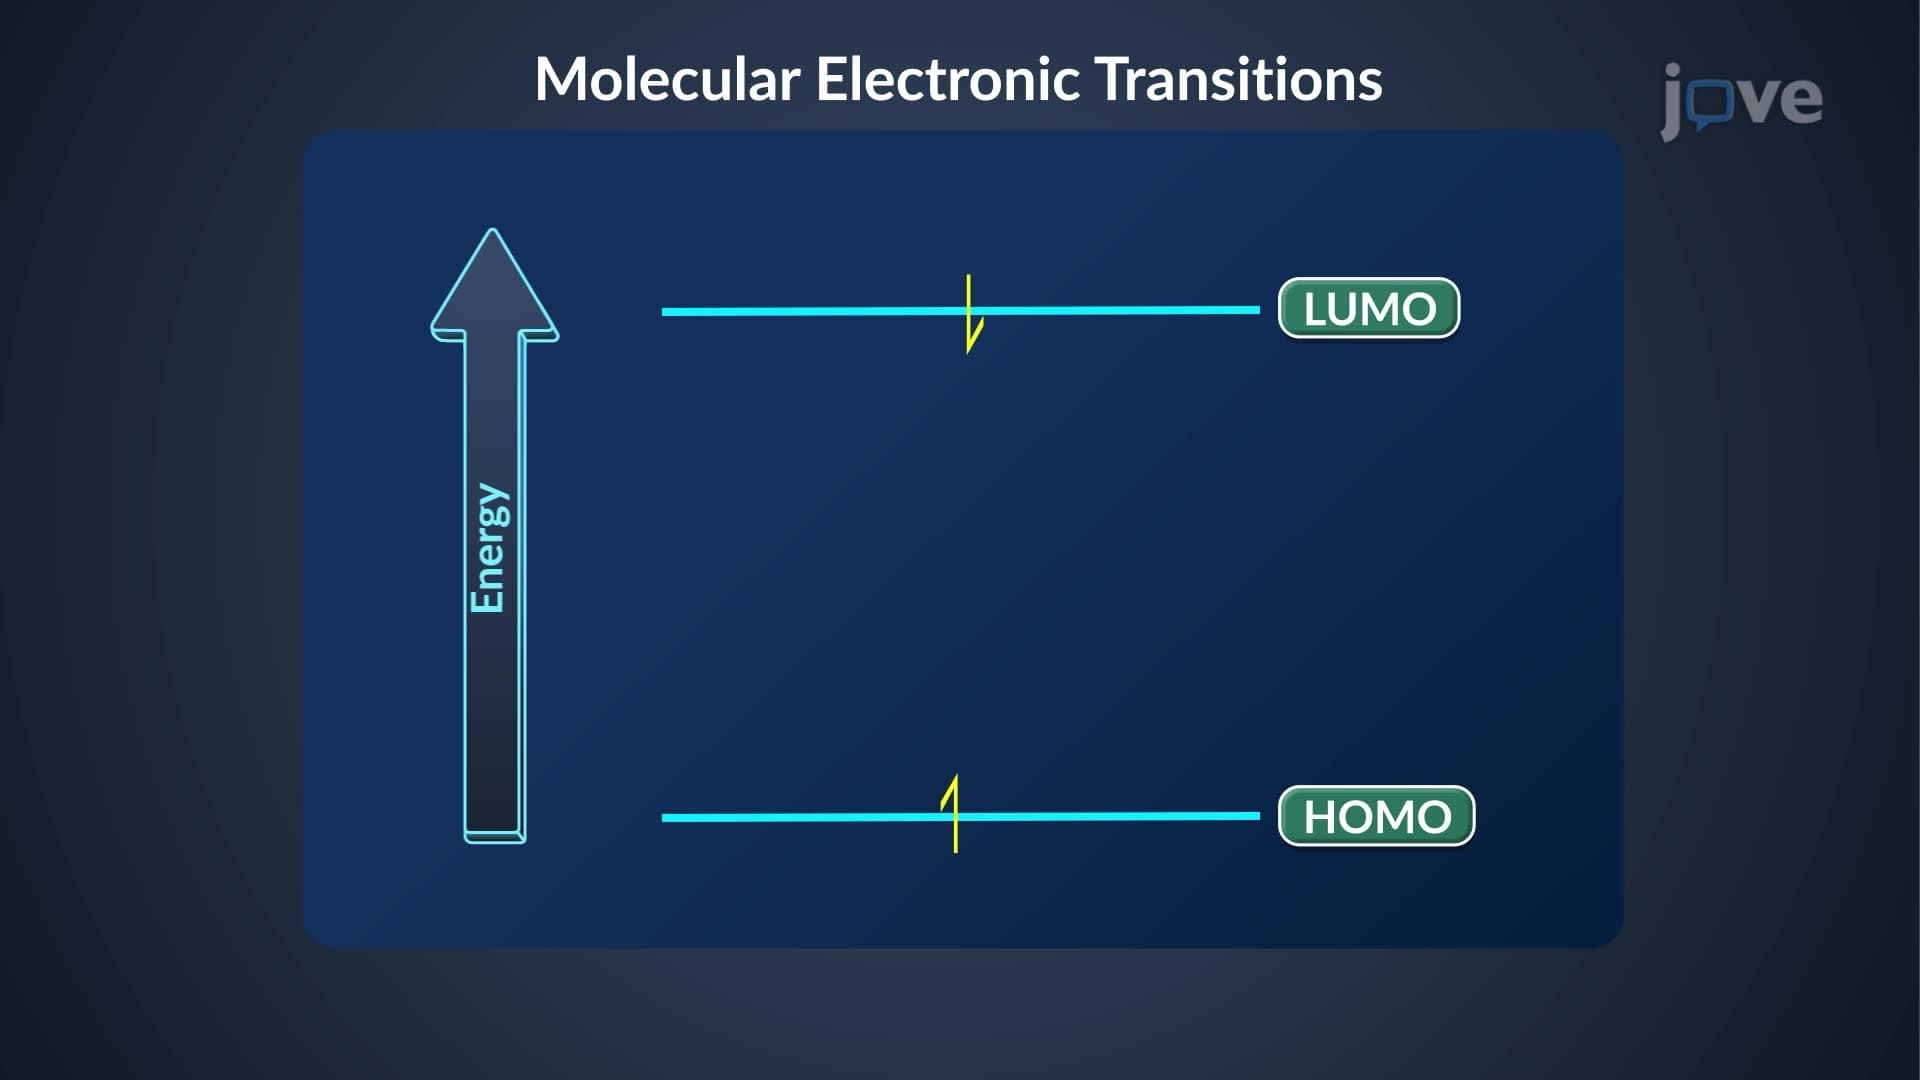
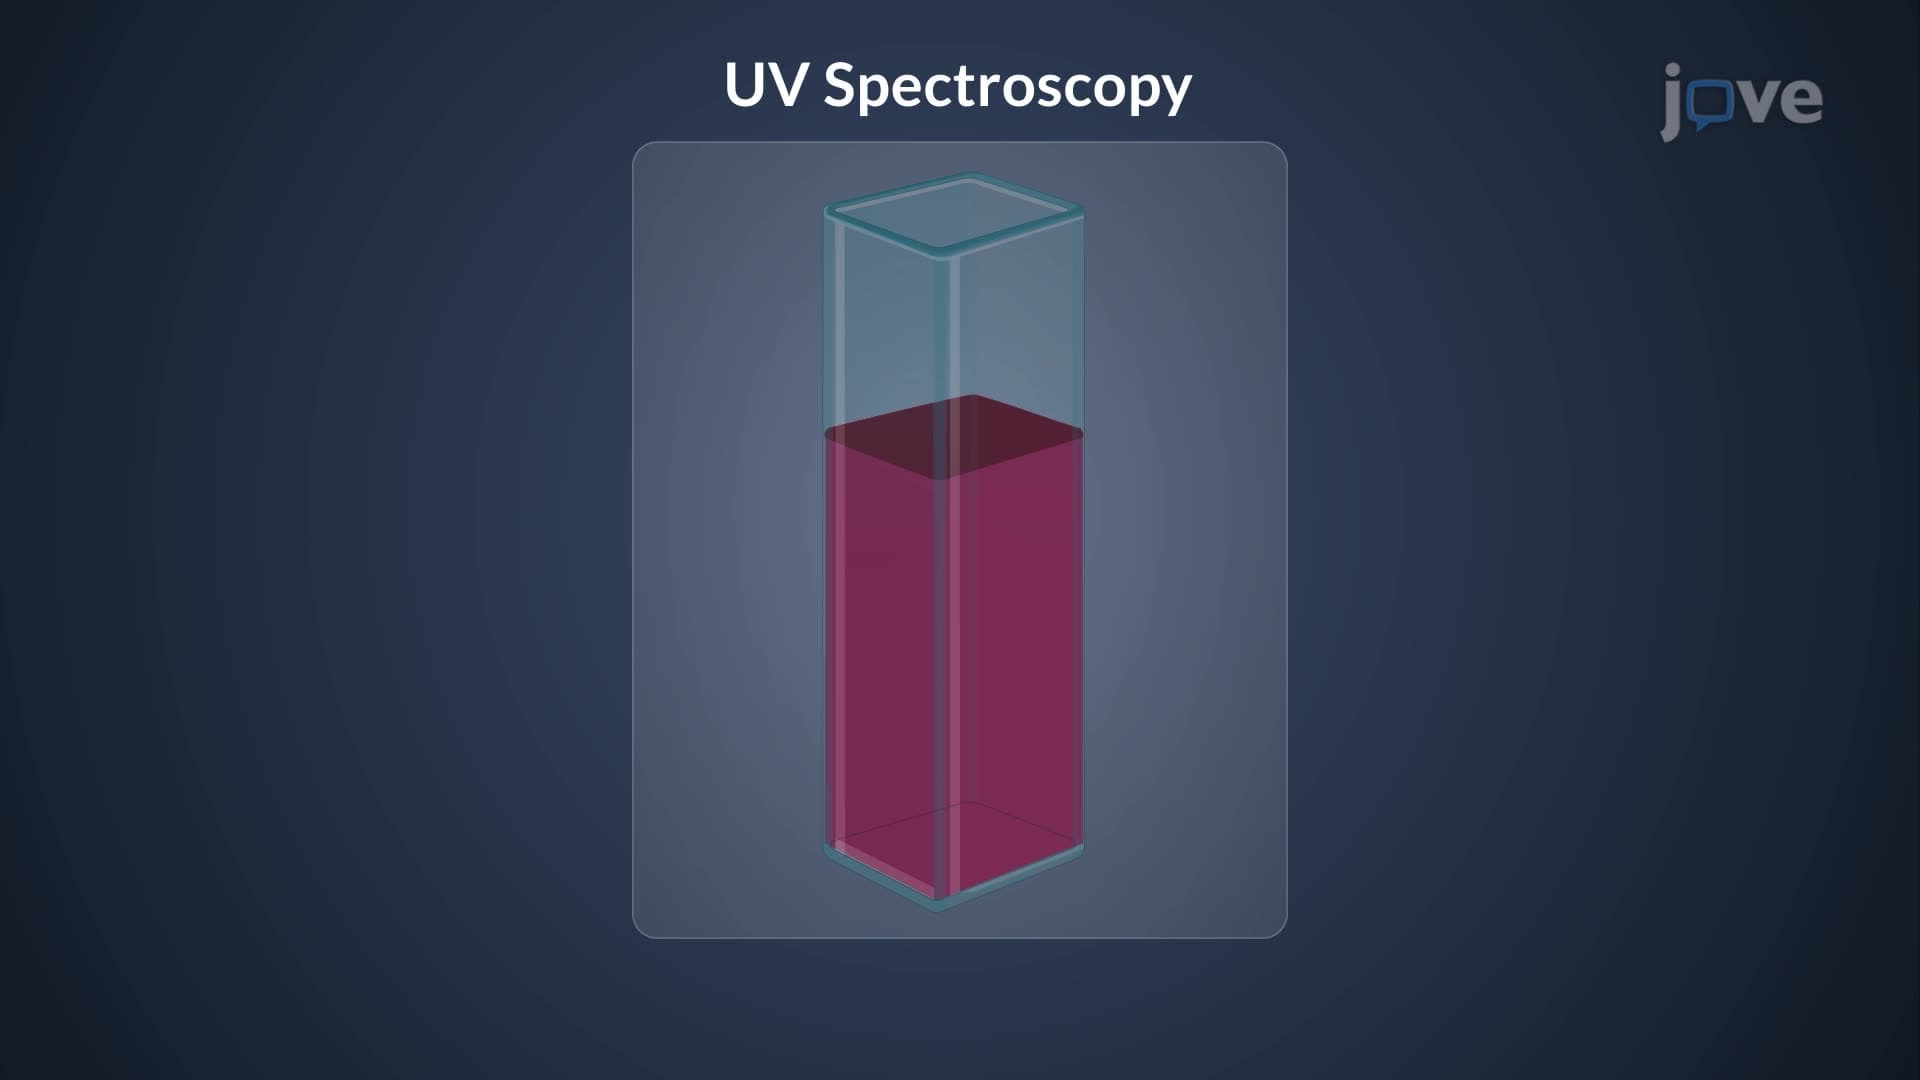
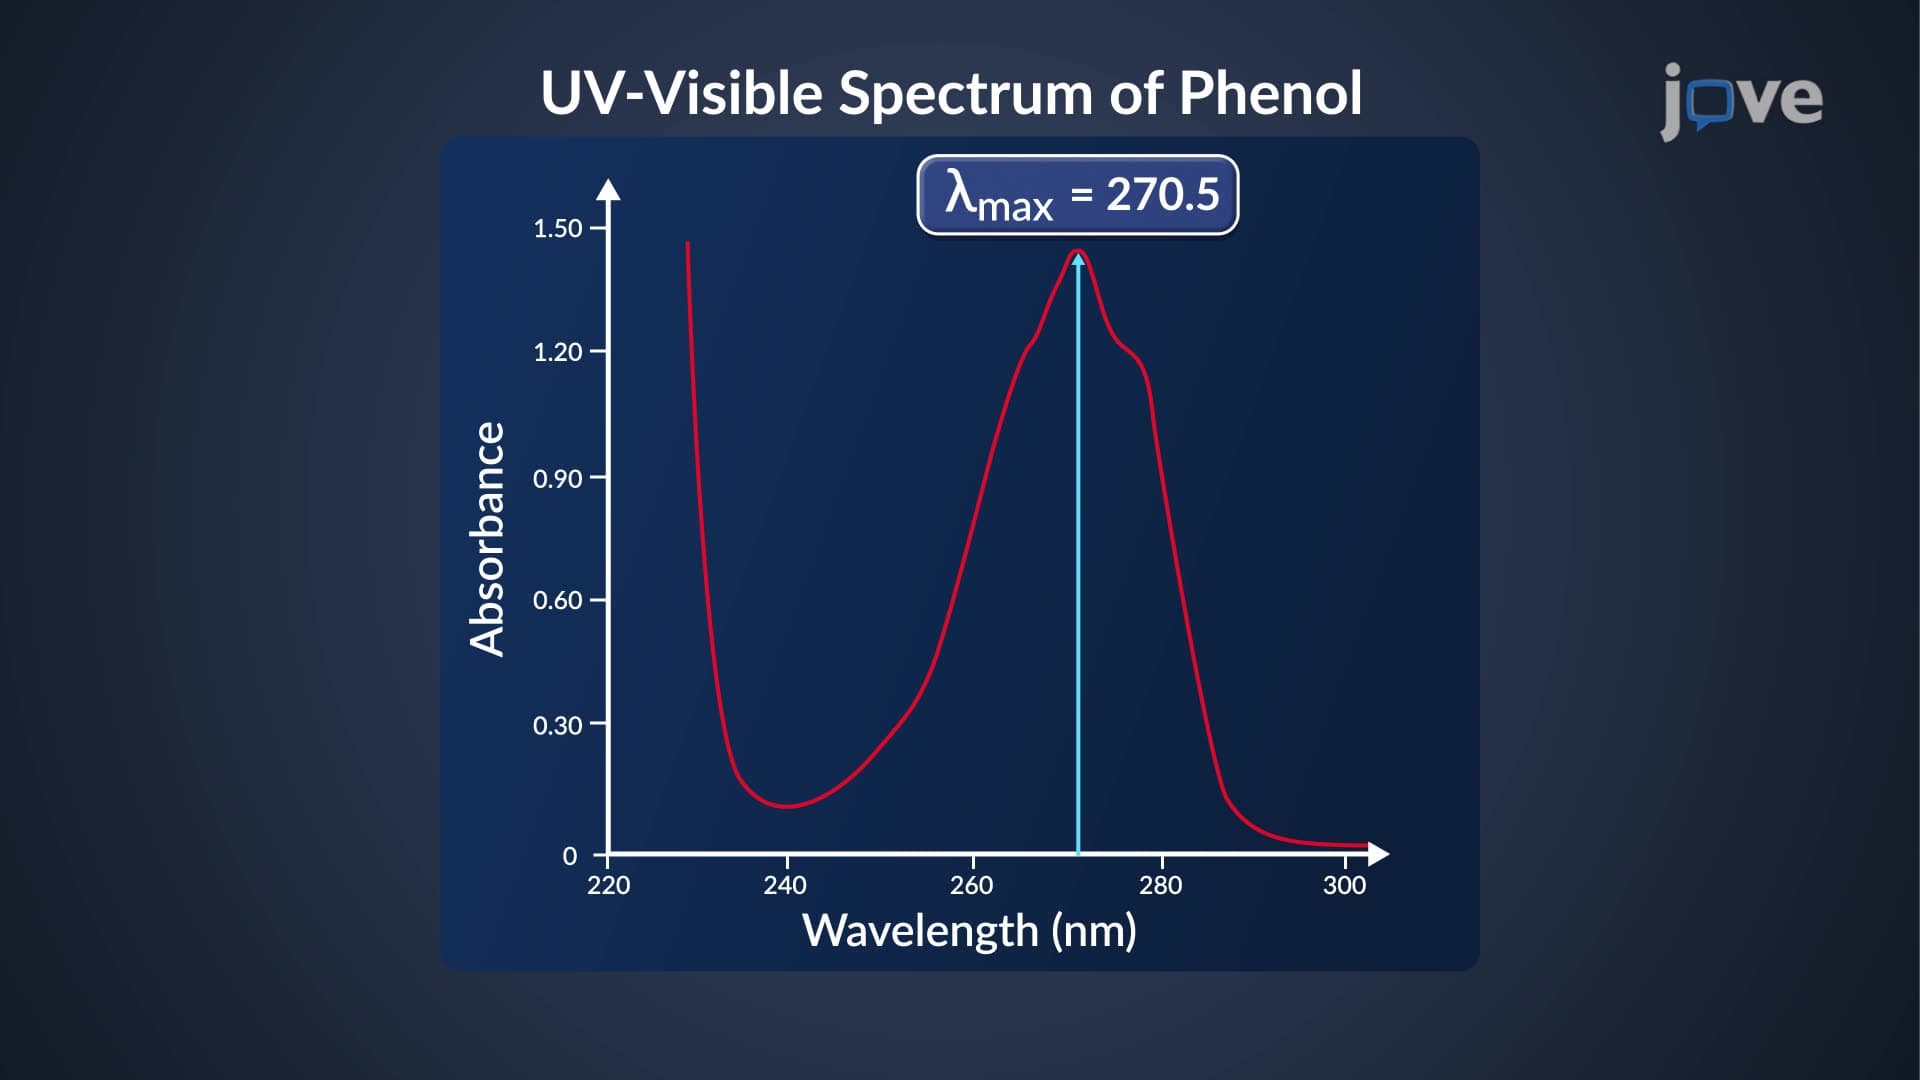
The UV Vis spectrum represents a powerful analytical technique that measures how molecules interact with ultraviolet and visible electromagnetic radiation. When molecules absorb photons in the 200-800 nanometer range, electrons transition from their ground state (HOMO - Highest Occupied Molecular Orbital) to excited states (LUMO - Lowest Unoccupied Molecular Orbital). This process creates characteristic absorption patterns that serve as molecular fingerprints.
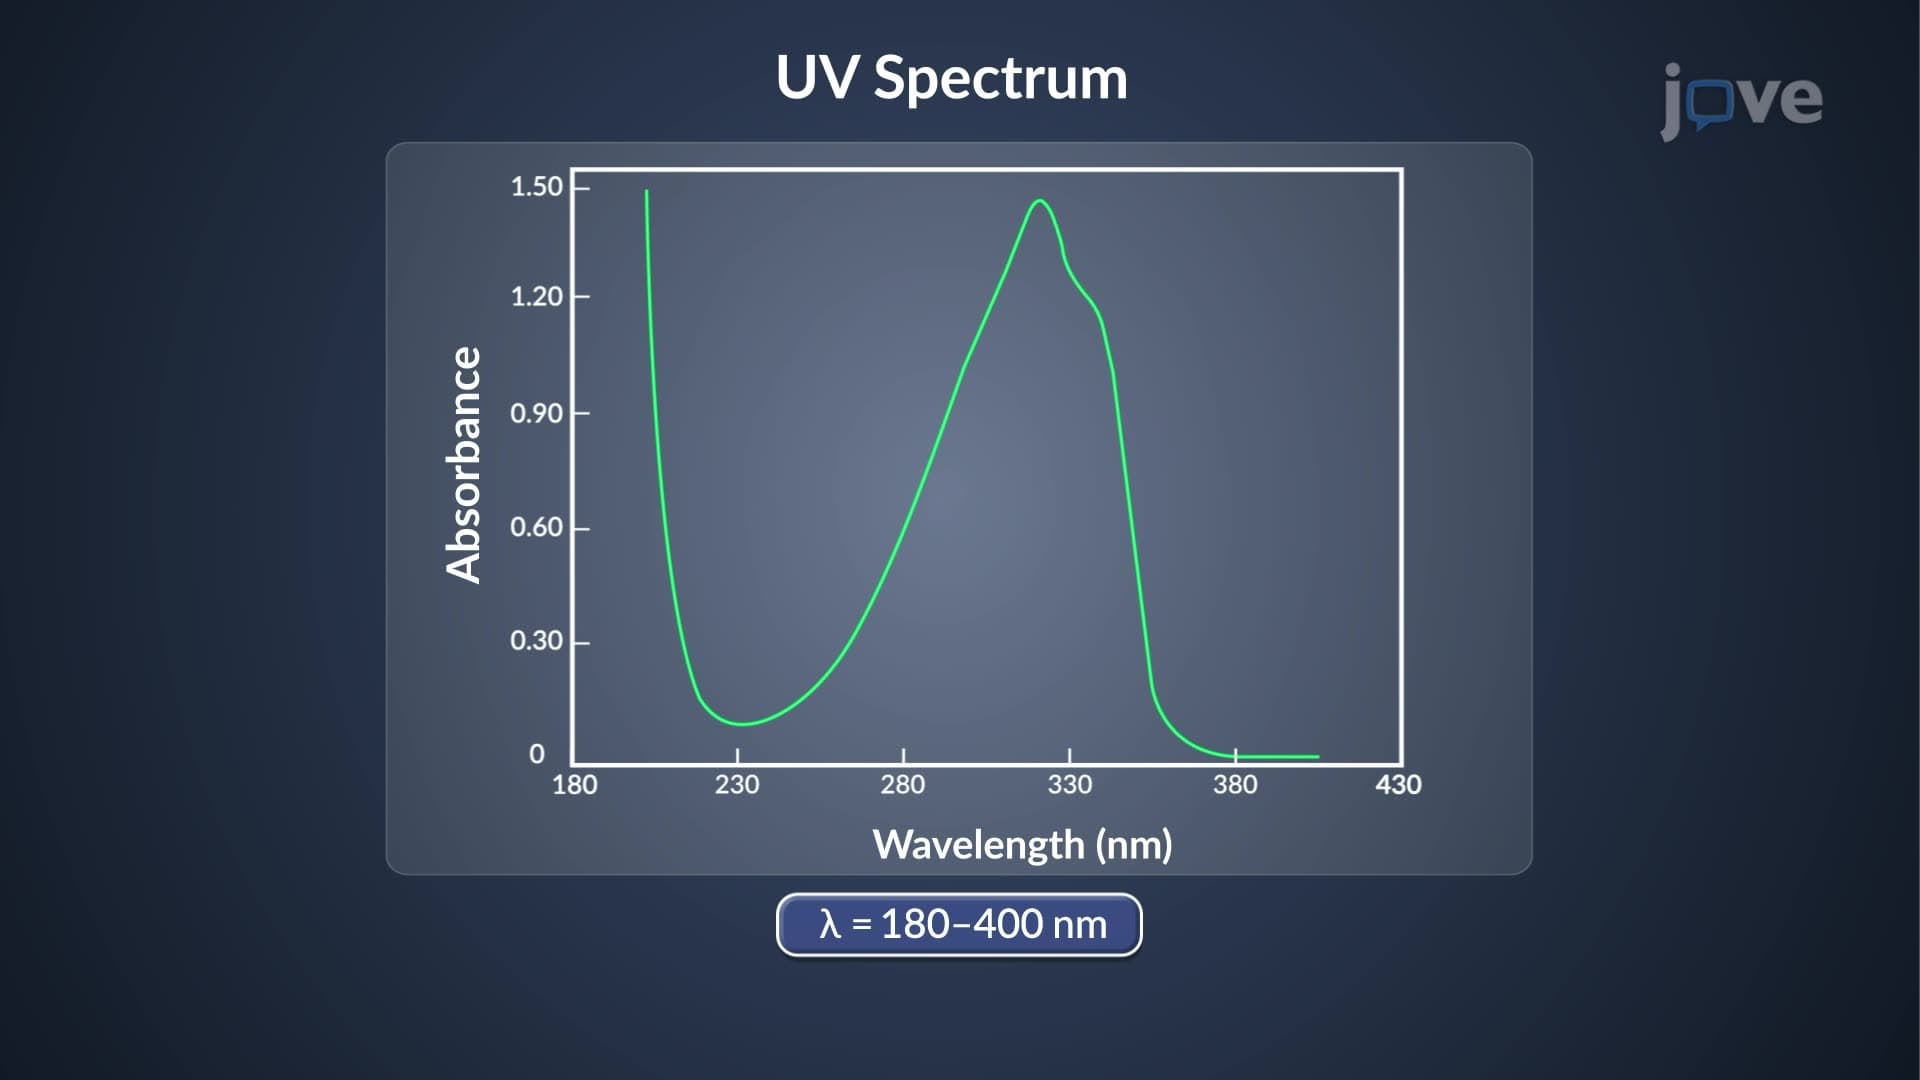
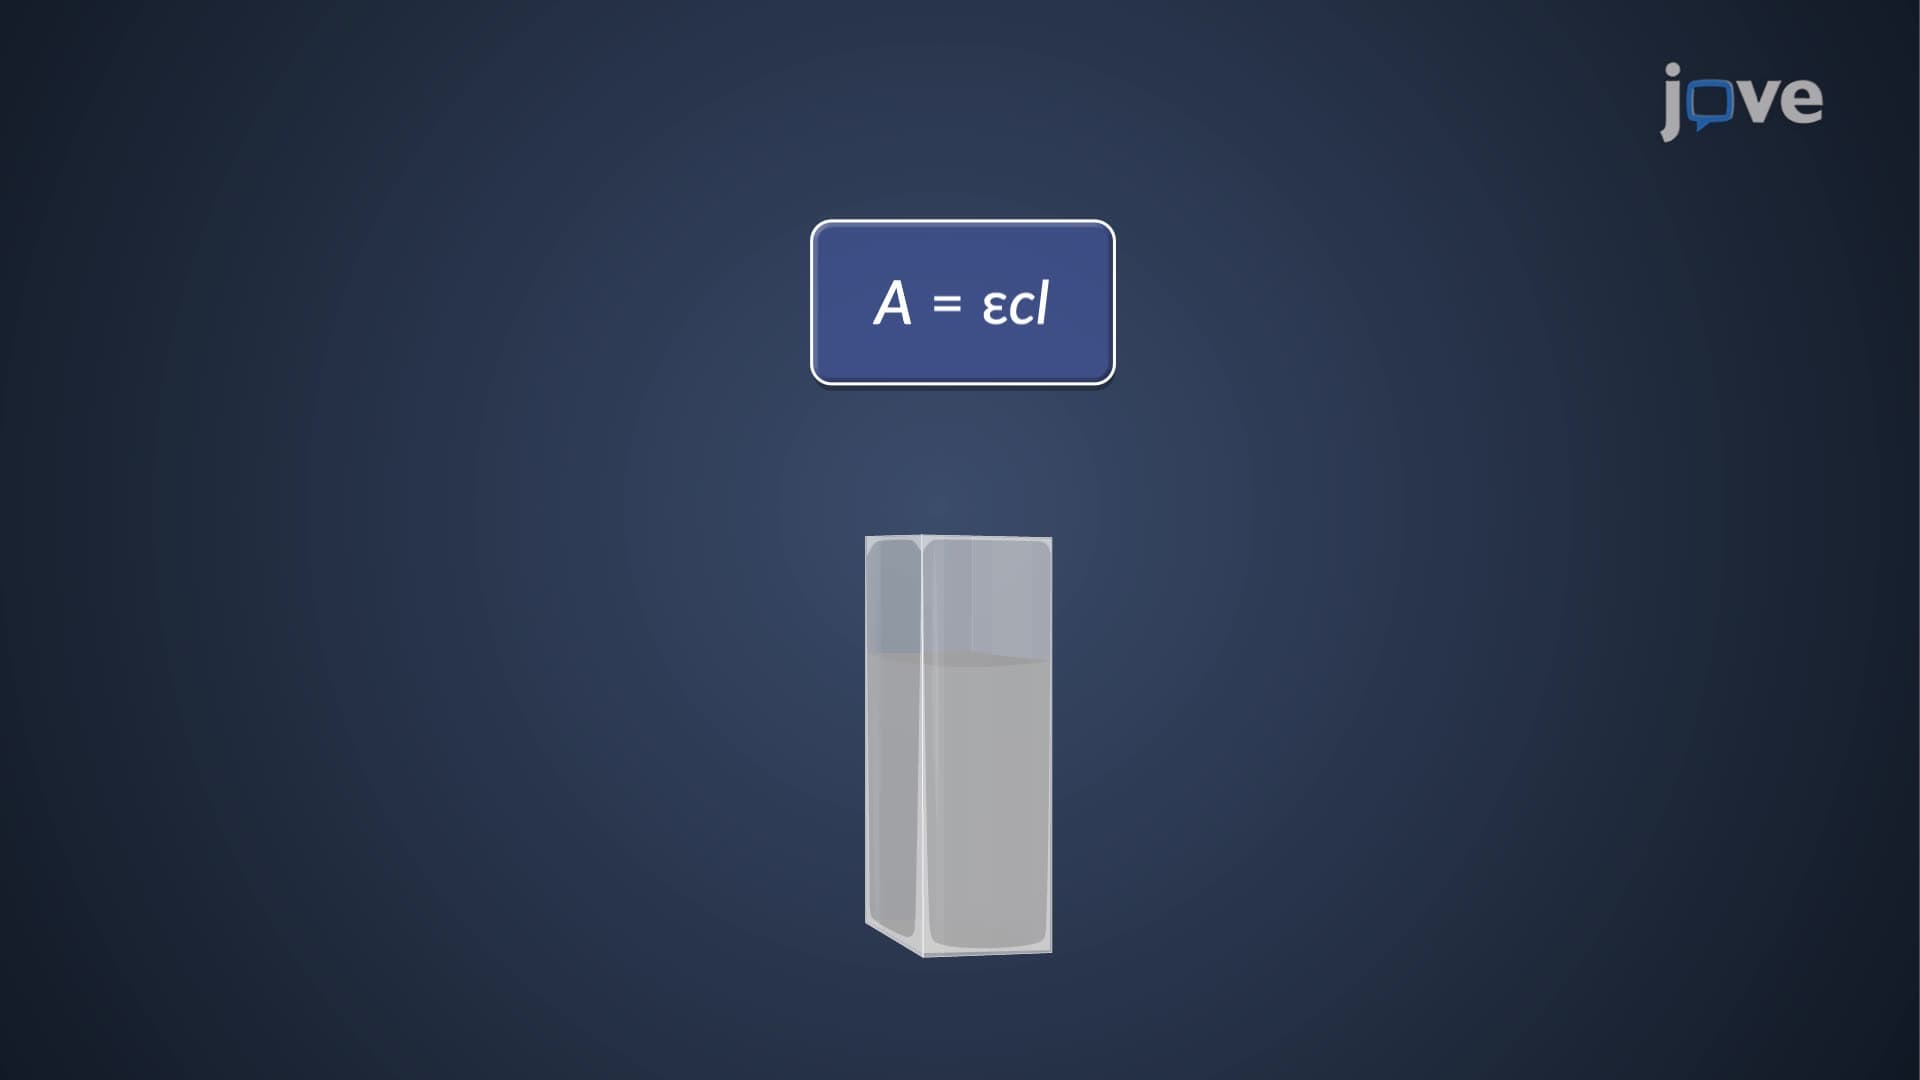
The spectrum plots wavelength (typically in nanometers) on the x-axis against either absorbance or log epsilon (molar absorptivity) on the y-axis. The Beer-Lambert law (A = εlc) establishes that absorbance directly correlates with molar absorptivity (ε), path length (l), and concentration (c). By plotting log epsilon instead of simple absorbance, scientists can compare absorption intensities across different molecules and solvents more effectively.
Lambda Max and Absorption Band Characteristics
The wavelength of maximum absorption, called lambda max (λmax), represents the most probable electronic transition for a given molecule. However, absorption rarely occurs at a single wavelength. Instead, molecules exhibit absorption bands - broad peaks spanning multiple wavelengths due to vibrational and rotational energy states coupling with electronic transitions.
For benzoic acid in cyclohexane, three distinct absorption bands appear at λmax values of 230, 272, and 282 nanometers. The corresponding log epsilon values (4.2, 3.1, and 2.9) indicate decreasing absorption intensity, with the strongest absorption at 230 nm. These multiple bands reflect different electronic transitions within the aromatic ring system, information crucial for structural determination in organic chemistry courses and AP Chemistry exams.
Solvent Selection and Experimental Considerations
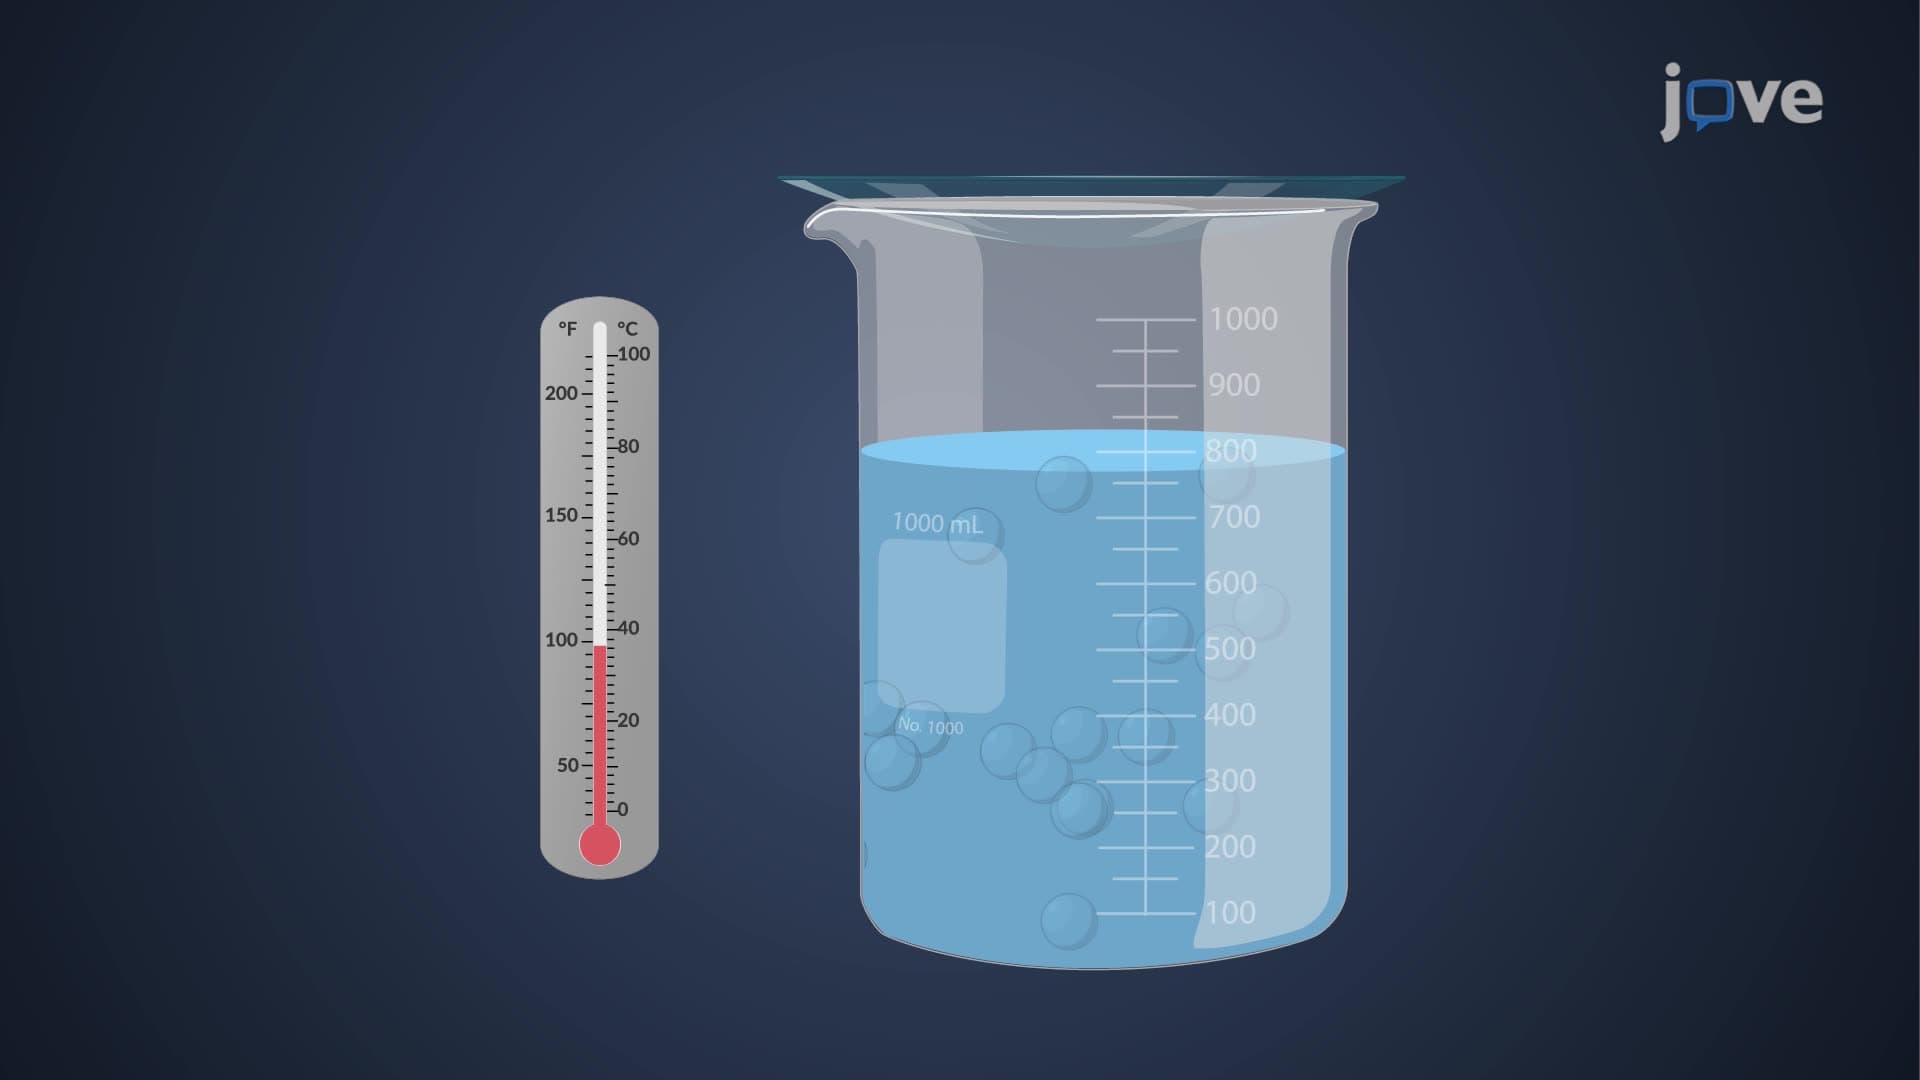
Proper solvent choice critically affects UV Vis spectral quality. Ideal solvents must be transparent in the wavelength region under investigation, avoiding interference with sample absorption. Nonpolar solvents like cyclohexane prevent hydrogen bonding with analytes, which could shift absorption wavelengths through solute-solvent complex formation.
This principle appears frequently on MCAT Physical Sciences sections, where students must predict how solvent polarity affects spectral properties. In pharmaceutical analysis, companies like Pfizer and Johnson & Johnson routinely use UV Vis spectroscopy with carefully selected solvents to quantify active pharmaceutical ingredients and detect impurities in drug formulations.
Practical Applications in US Industries
UV Vis spectrum analysis drives quality control across American industries. Environmental Protection Agency (EPA) laboratories use UV Vis spectroscopy to monitor water quality, detecting pollutants like benzene and toluene in groundwater samples. Food and Drug Administration (FDA) facilities employ these techniques to verify food dye concentrations and ensure cosmetic safety. Understanding spectral interpretation prepares students for careers in analytical chemistry, environmental science, and pharmaceutical research - fields experiencing significant growth in the US job market.
Frequently Asked Questions
A UV Vis spectrum is a graph showing how much ultraviolet and visible light a molecule absorbs at different wavelengths, creating a unique "fingerprint" for identification. Each molecule has characteristic absorption patterns based on its electronic structure, allowing scientists to identify unknown compounds and measure concentrations. This technique is fundamental in analytical chemistry and appears regularly on AP Chemistry and college organic chemistry exams.
You should understand basic atomic structure, electron configurations, and molecular orbital theory before diving into UV spectroscopy. Familiarity with the electromagnetic spectrum and energy-wavelength relationships (E = hc/λ) is essential. Having completed high school chemistry or introductory college chemistry makes learning UV Vis concepts much more manageable and builds confidence for advanced analytical techniques.
MCAT Physical Sciences frequently tests UV Vis concepts through data interpretation questions asking students to identify lambda max values, compare absorption intensities, and predict how structural changes affect spectra. Expect questions about solvent effects on absorption wavelengths and connecting molecular orbital theory to observed absorption bands. Practice interpreting spectral graphs and relating absorption patterns to molecular structure for optimal MCAT performance.
Use the Beer-Lambert law (A = εlc) where absorbance equals molar absorptivity times path length times concentration. Measure the absorbance at lambda max, then calculate concentration using the known molar absorptivity and path length values. Higher absorbance indicates higher concentration, assuming the same path length. This calculation method is standard in analytical chemistry labs and appears on college chemistry midterms nationwide.
UV Vis spectroscopy is crucial in pharmaceutical manufacturing, where companies like Merck use it to verify drug purity and potency. Environmental labs employ UV Vis to detect water pollutants, while food companies analyze artificial colors and preservatives. Clinical laboratories use UV Vis to measure protein concentrations and enzyme activities. These applications make UV Vis skills valuable for careers in healthcare, pharmaceuticals, and environmental science.
Focus on understanding the relationship between molecular structure and absorption wavelengths rather than memorizing specific values. Practice interpreting real spectra by identifying lambda max, comparing absorption intensities, and explaining why certain molecules absorb at particular wavelengths. Create concept maps connecting molecular orbital theory to spectral observations. Work through practice problems involving the Beer-Lambert law to build computational confidence for exam success.
Consider studying fluorescence spectroscopy, which analyzes light emission after UV absorption, or infrared spectroscopy for vibrational analysis. Nuclear magnetic resonance (NMR) spectroscopy builds on similar principles for structural determination. Mass spectrometry complements UV Vis for comprehensive molecular analysis. These techniques form the foundation of modern analytical chemistry and are essential for graduate school preparation in chemistry-related fields.
Related Micro-courses

19 Concepts

17 Concepts

15 Concepts