22 Concepts
19 Concepts
14 Concepts
17 Concepts
22 Concepts
14 Concepts
13 Concepts
24 Concepts
17 Concepts
24 Concepts
27 Concepts
14 Concepts
19 Concepts
17 Concepts
15 Concepts
12 Concepts
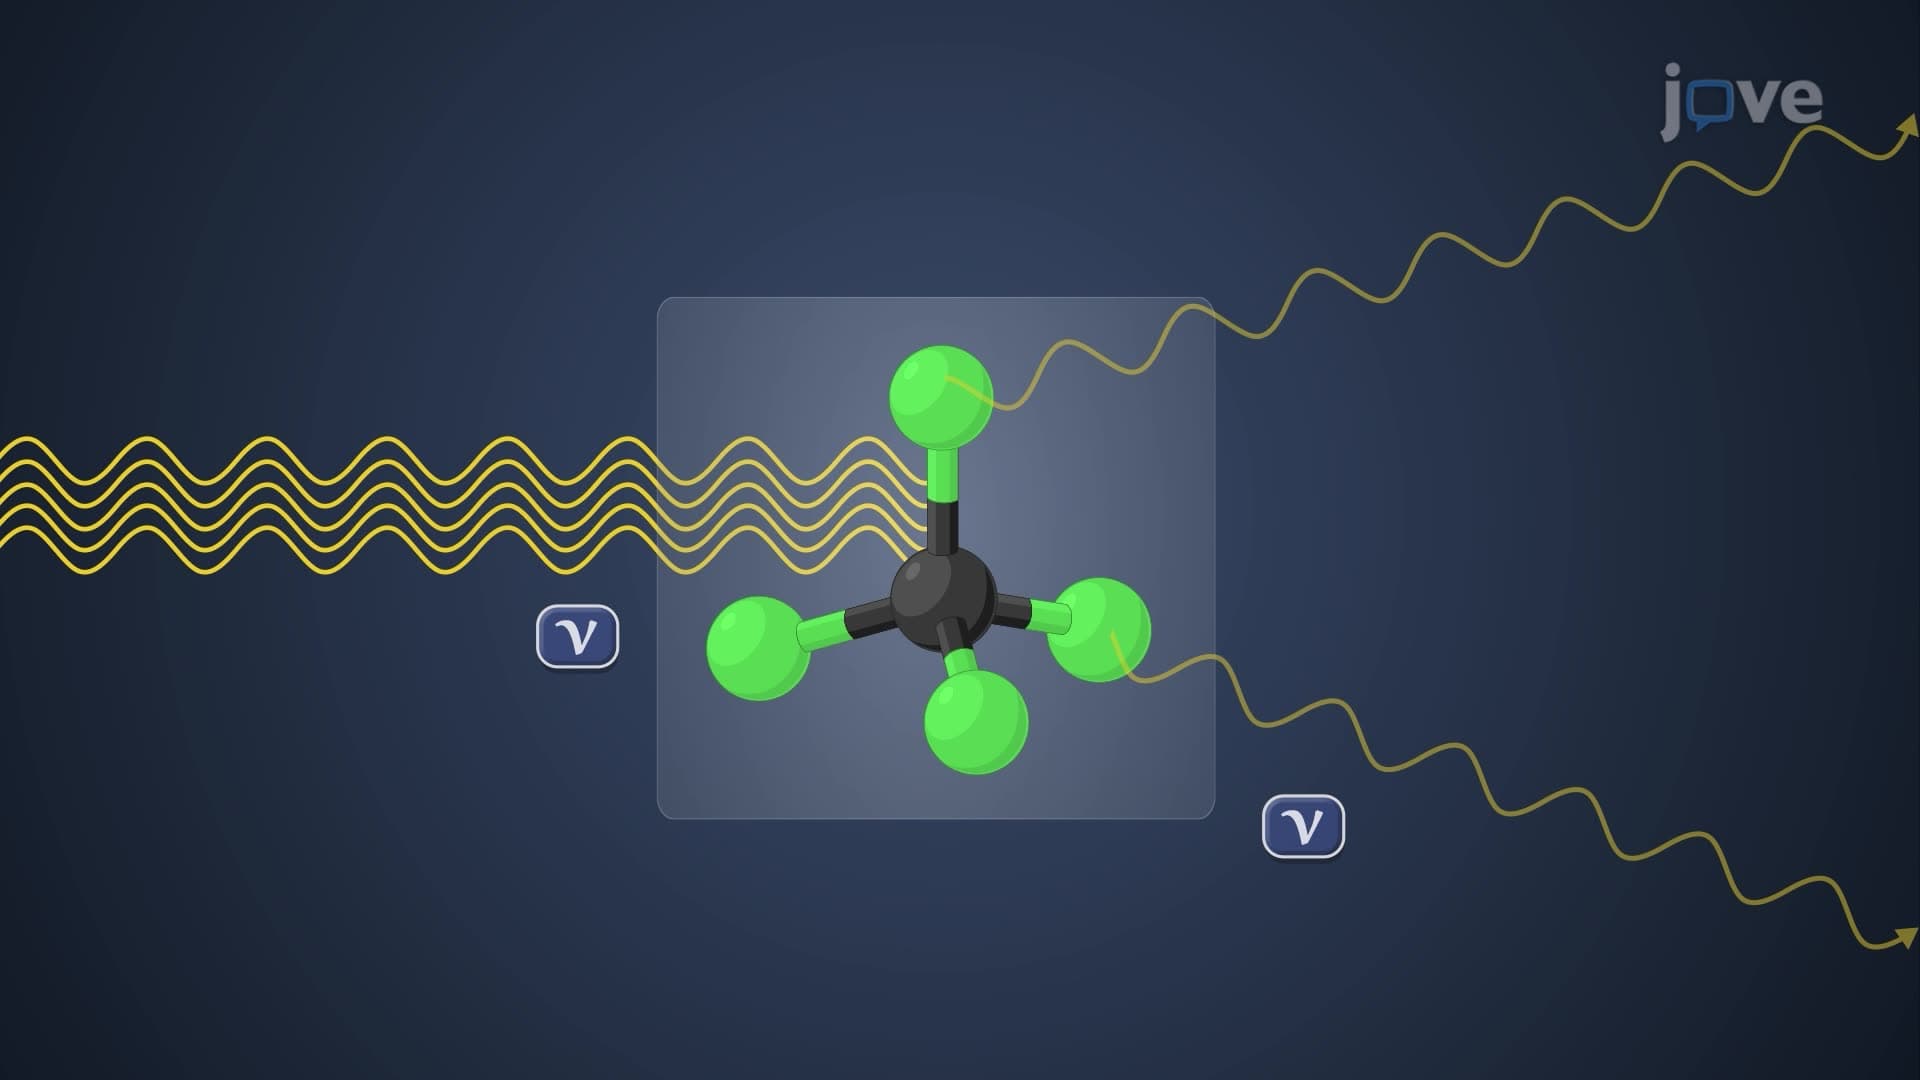
Molecular vibrational spectroscopy encompasses infrared (IR) and Raman techniques that analyze molecular vibrations to identify functional groups and determine molecular structure. These complementary methods use different physical principles-IR measures absorption of electromagnetic radiation while Raman detects inelastic light scattering-making them essential tools in US pharmaceutical companies, environmental monitoring agencies, and forensic laboratories for compound identification and quality control.
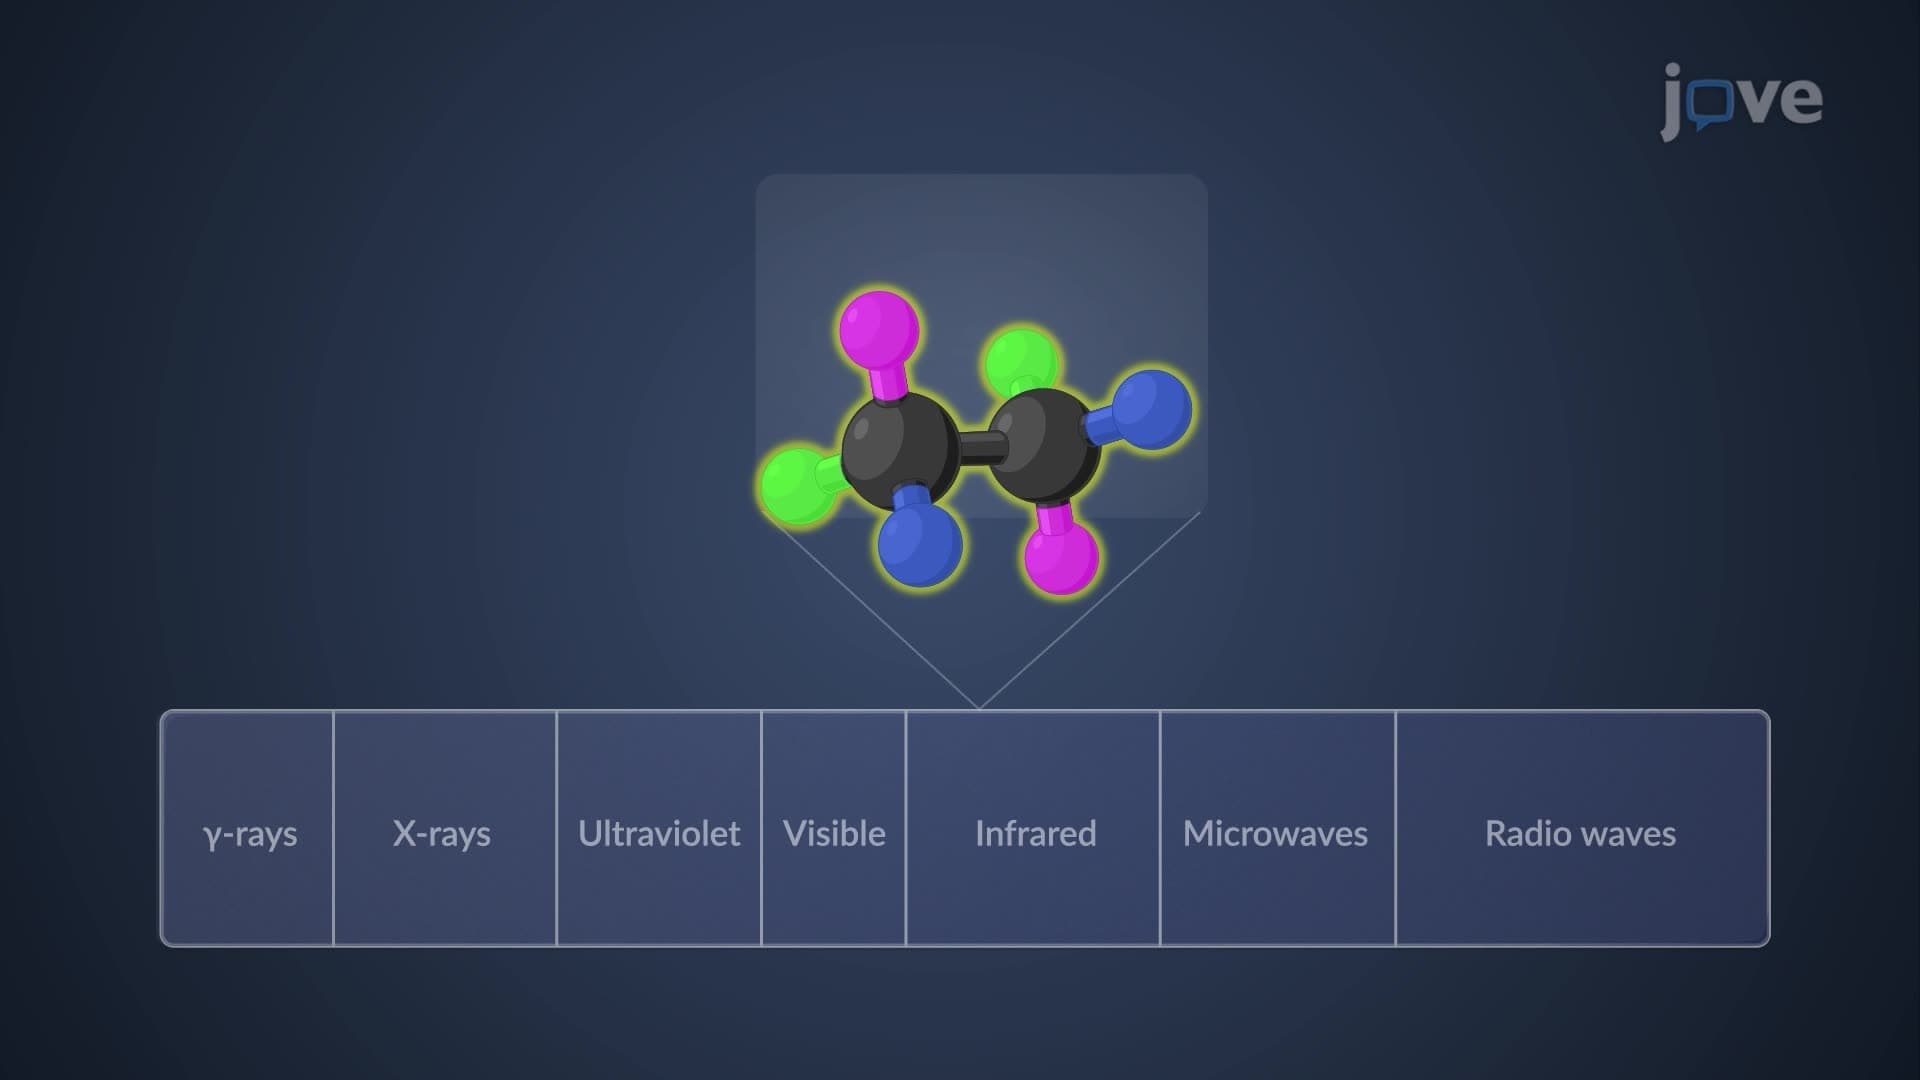
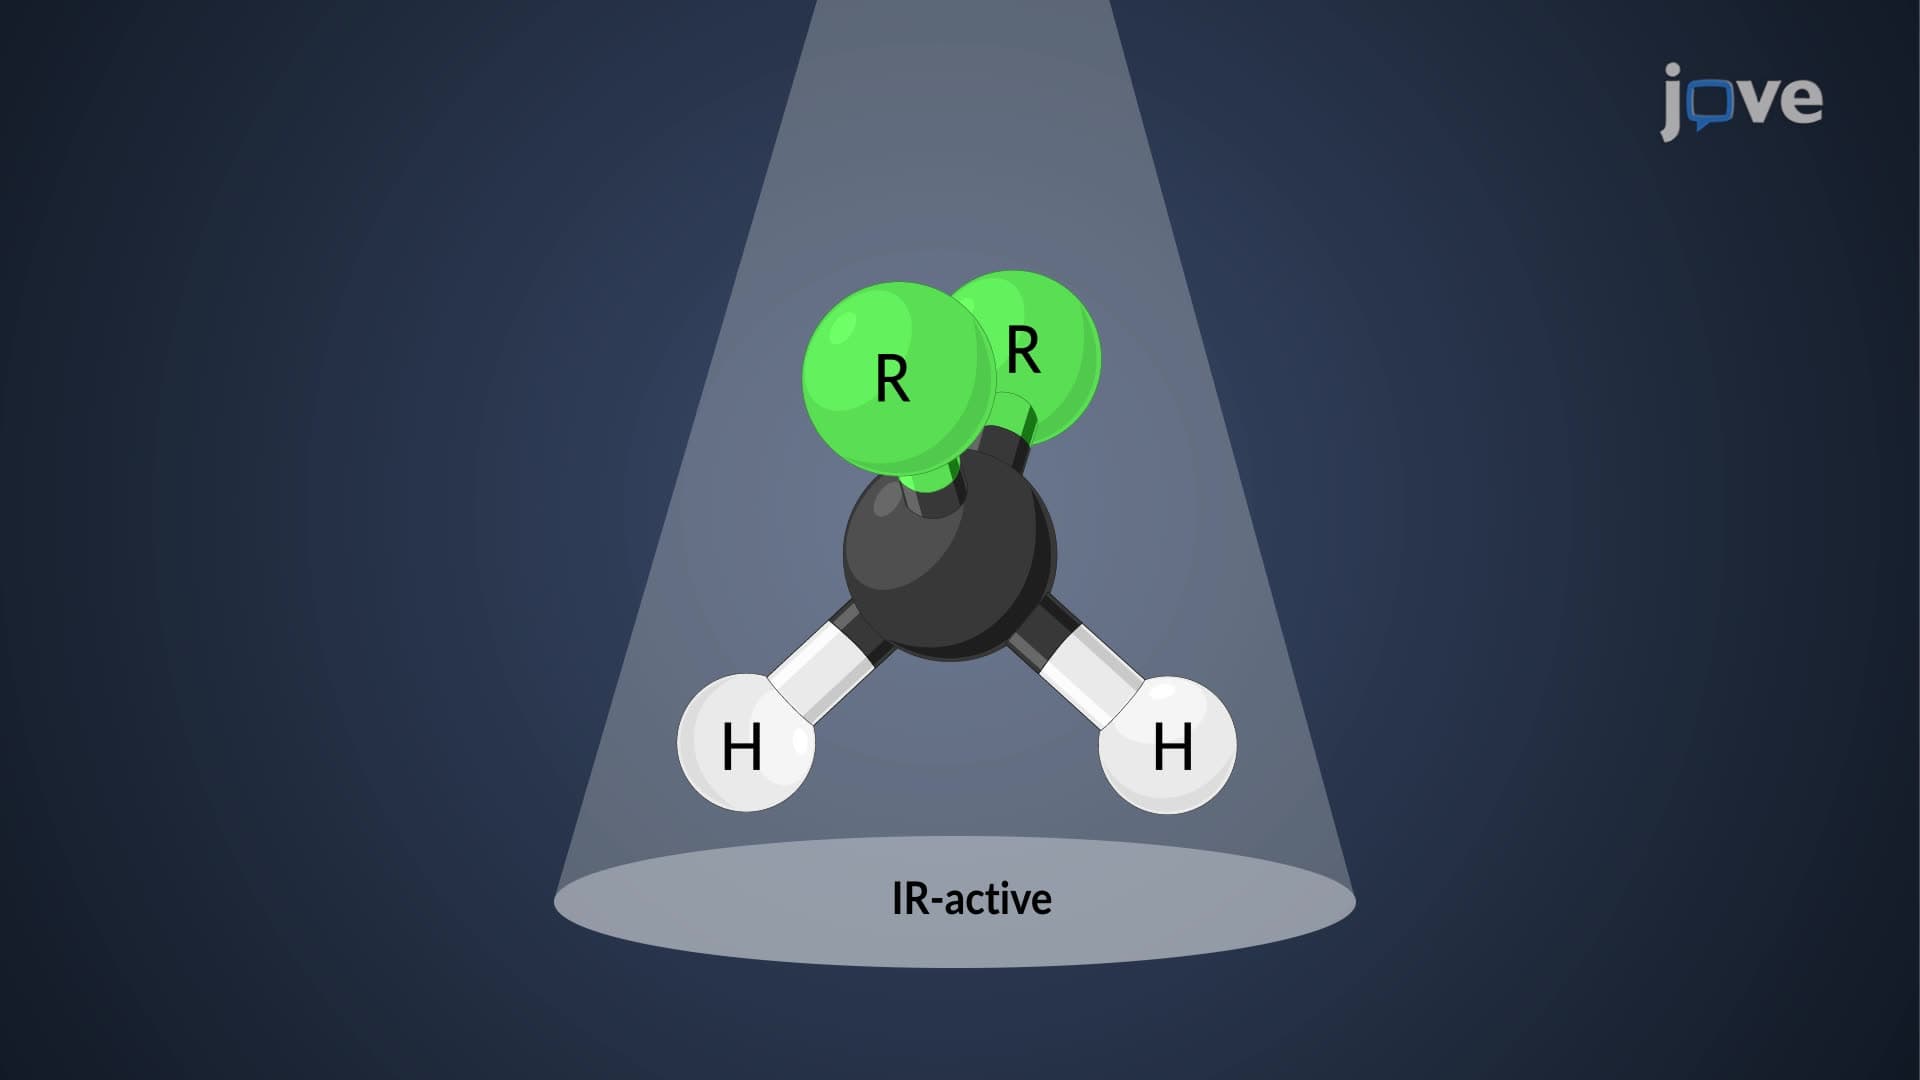
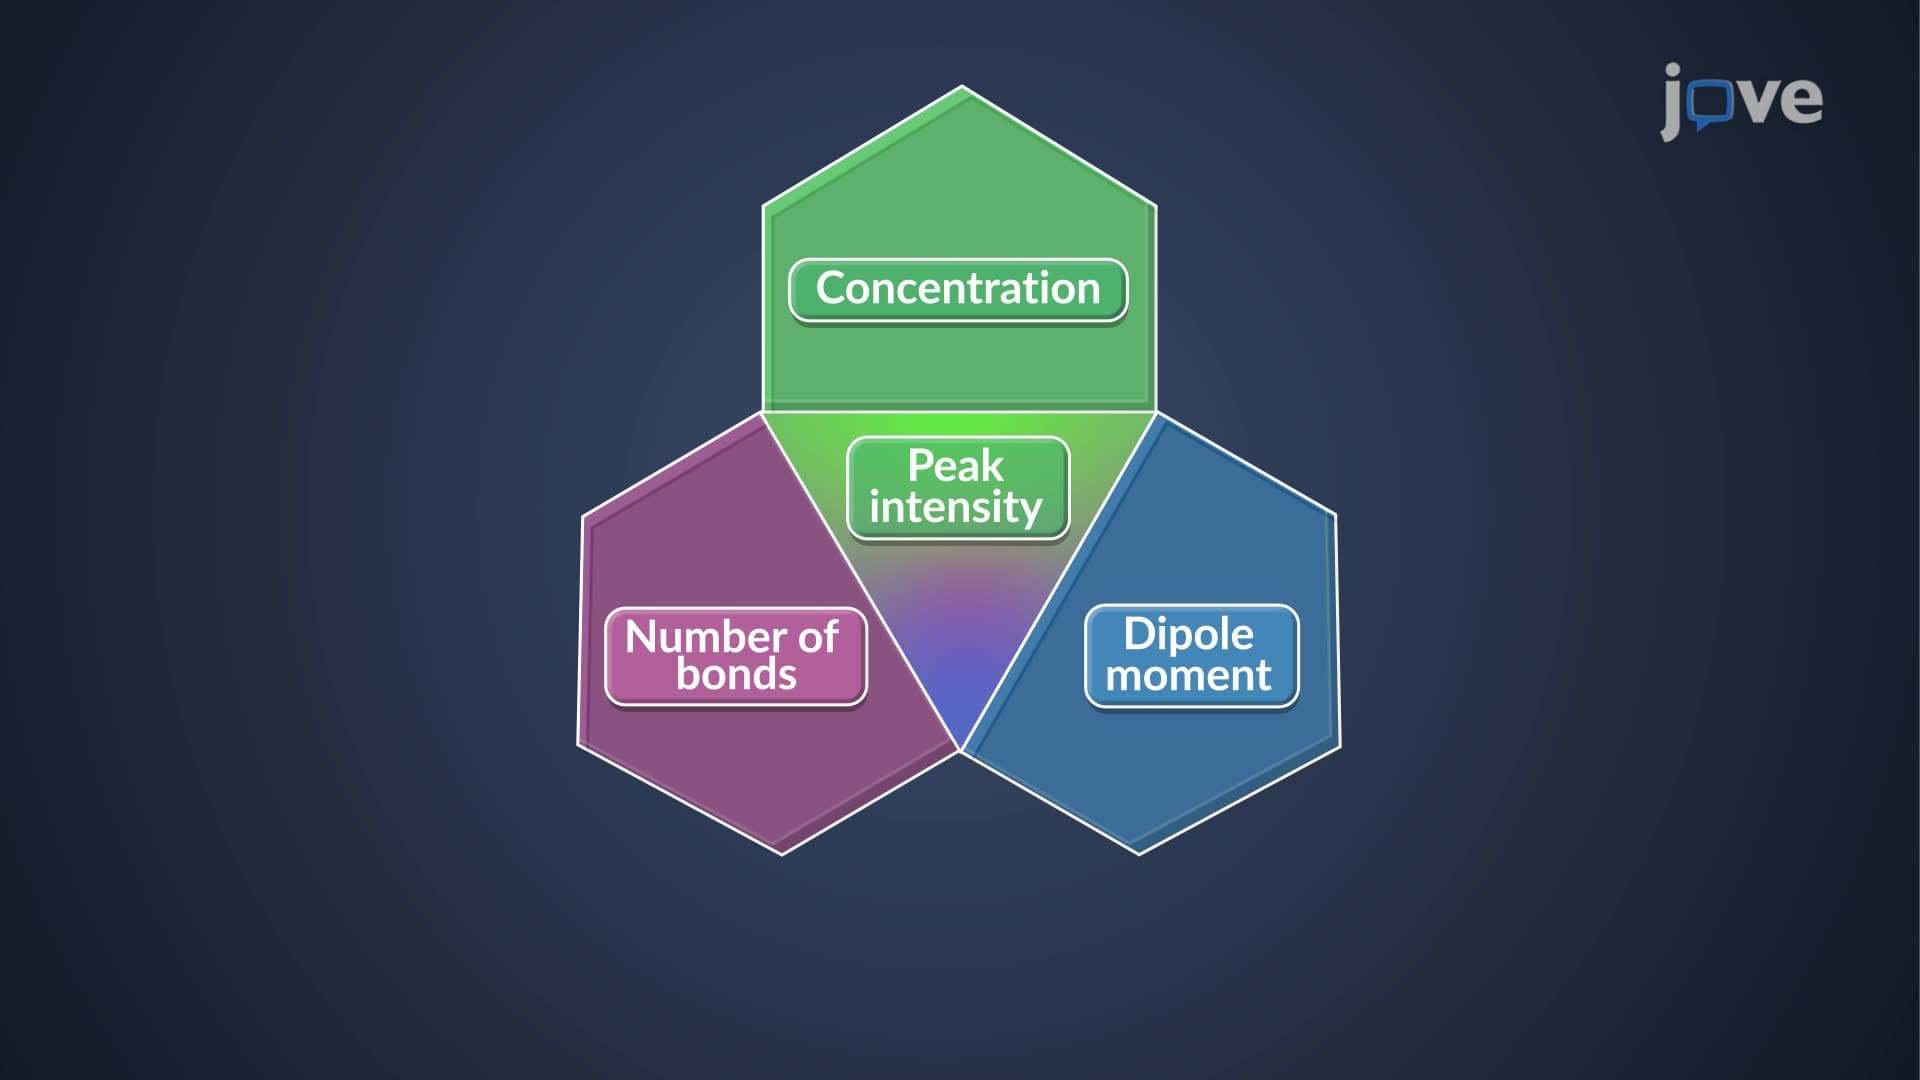
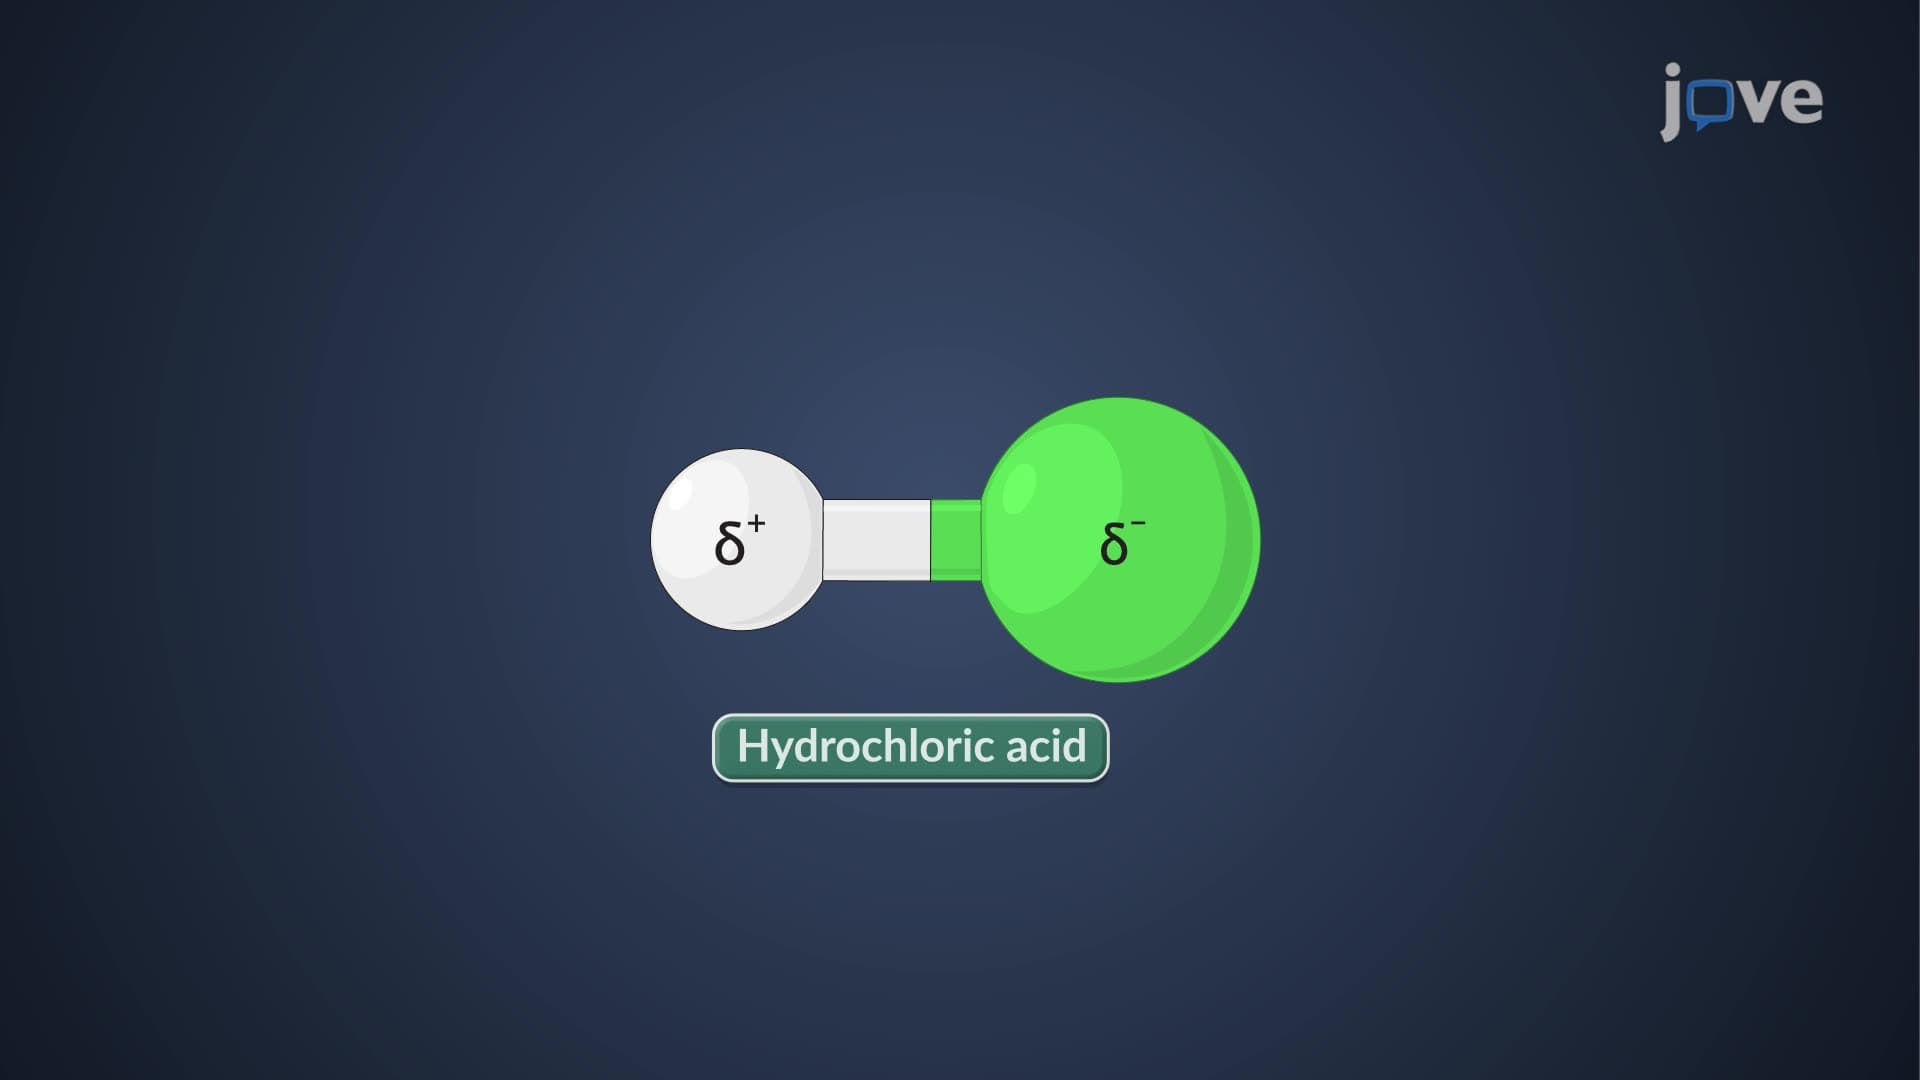
1. Molecular Vibration Fundamentals and IR Activity Molecular vibrations occur when covalent bonds stretch or bend, absorbing infrared radiation between 4000-400 cm⁻¹. Only vibrations causing dipole moment changes are IR-active, explaining why symmetric molecules like O₂ show no IR absorption while asymmetric molecules like CO absorb strongly. The two fundamental modes-stretching (along bond axis) and bending (changing bond angles)-create unique spectral fingerprints. For example, water molecules show both O-H stretching around 3500 cm⁻¹ and H-O-H bending near 1600 cm⁻¹, making water identification straightforward in environmental samples analyzed by EPA laboratories.
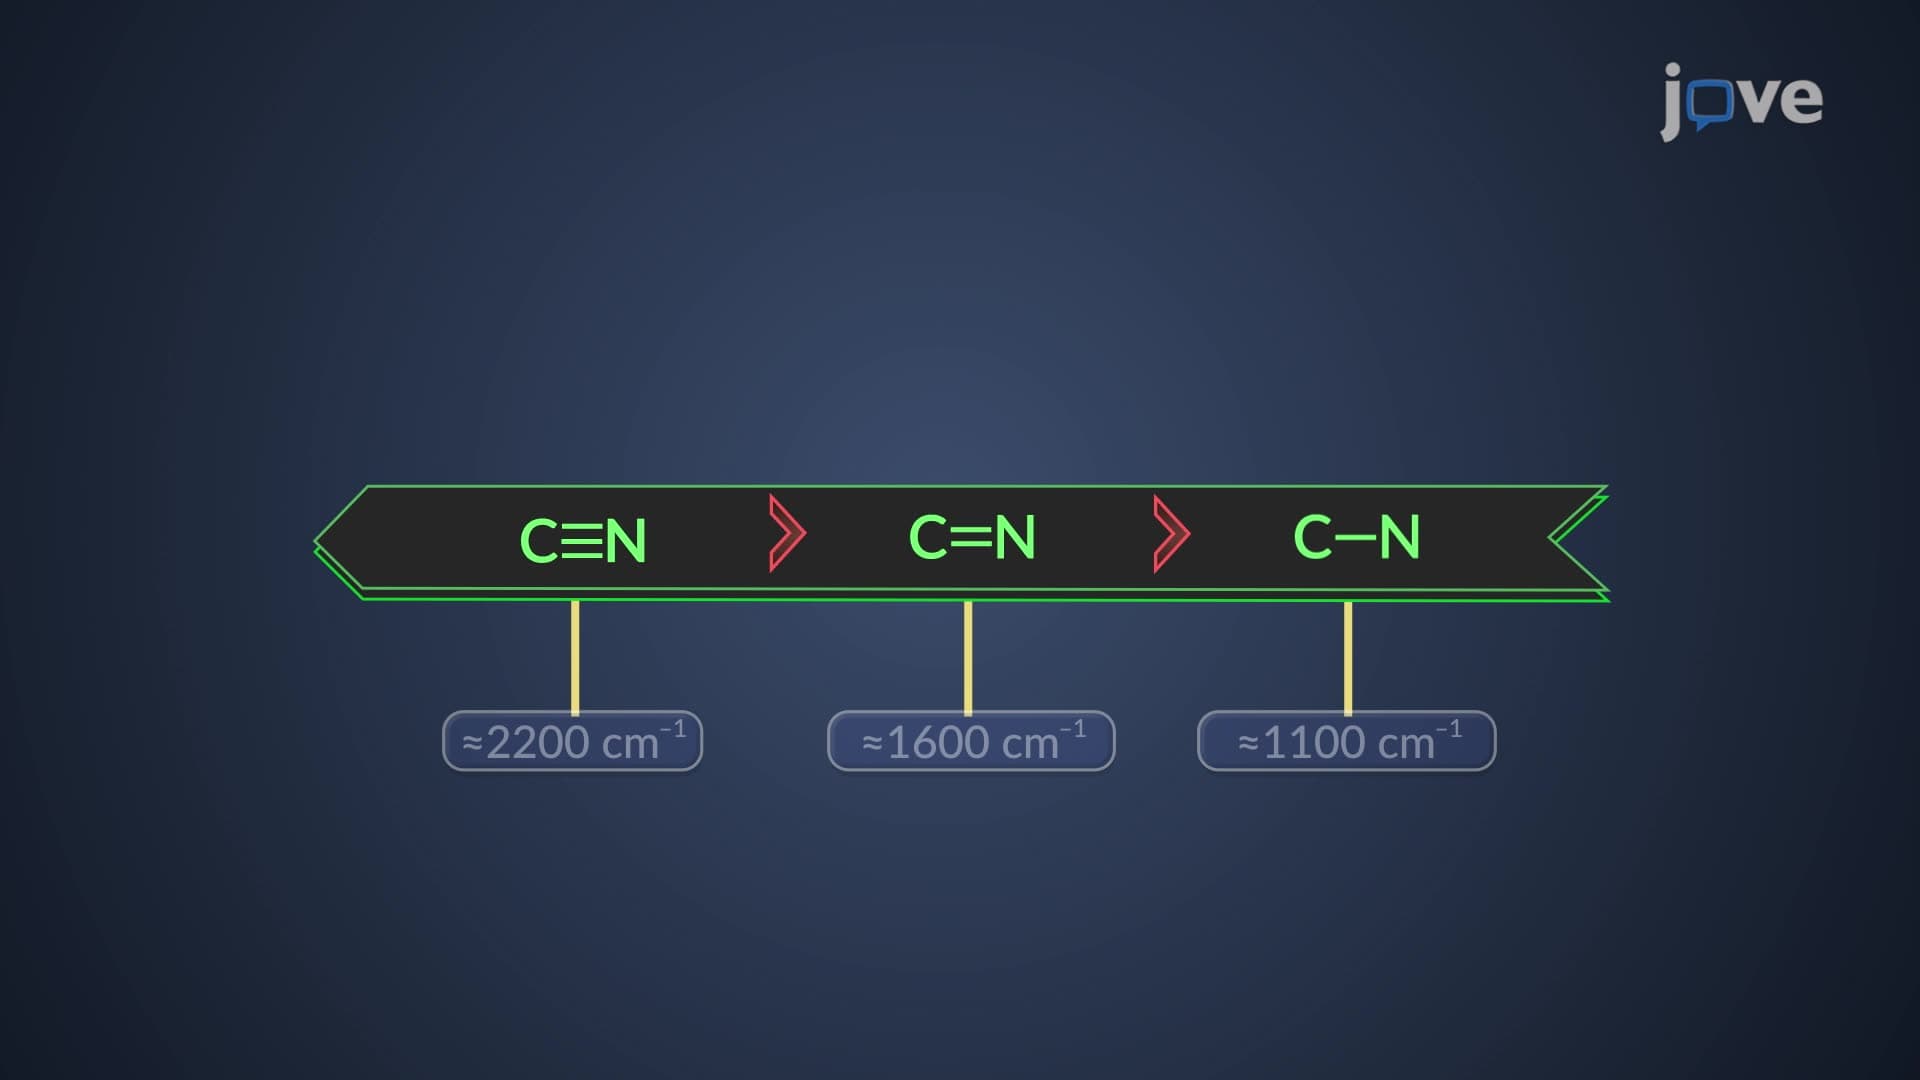
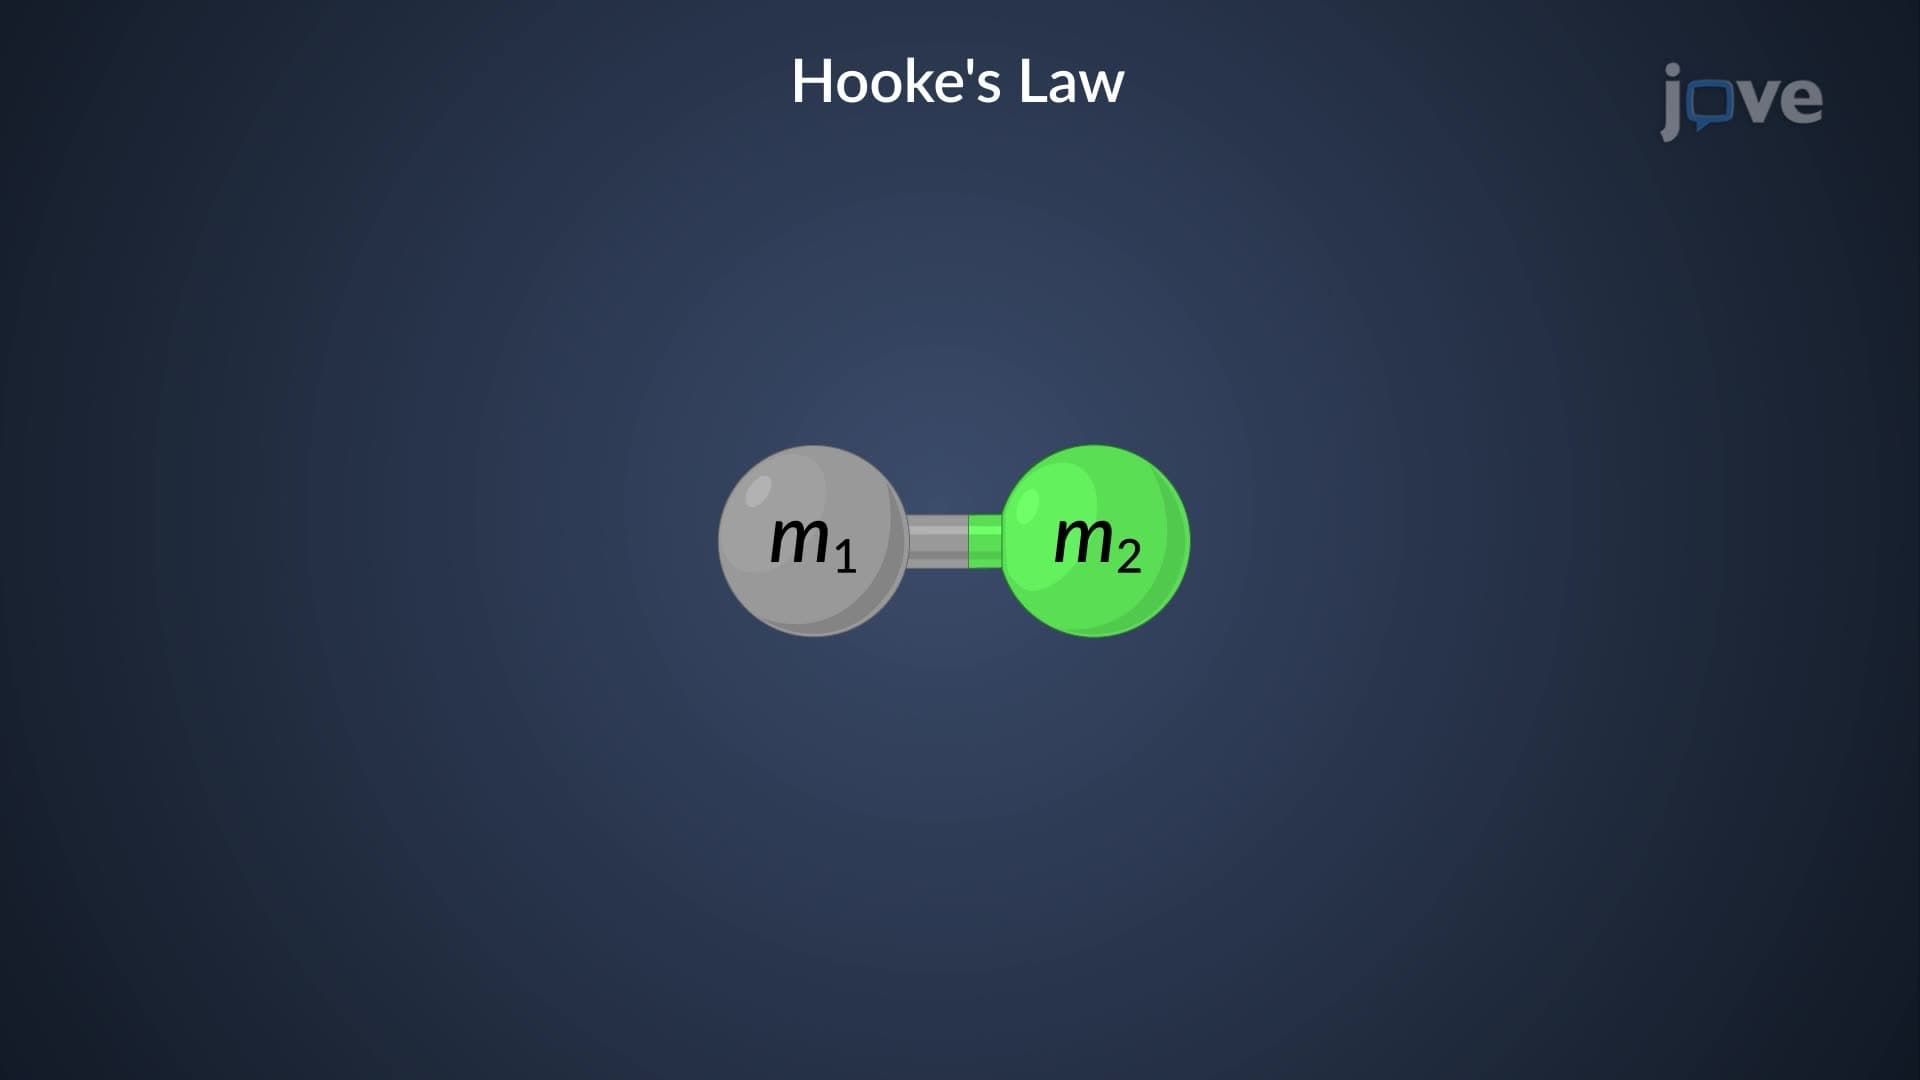
2. Hooke's Law and Vibrational Frequency Prediction Hooke's law models molecular vibrations as masses connected by springs, where vibrational frequency depends on bond strength (force constant) and atomic masses. The relationship ν = (1/2π)√(k/μ) shows that stronger bonds vibrate at higher frequencies while heavier atoms reduce frequency. This explains why C-H bonds (lighter hydrogen) vibrate around 3000 cm⁻¹ while C-C bonds (heavier carbons) appear near 1000 cm⁻¹. Triple bonds like C≡N in acetonitrile (2260 cm⁻¹) vibrate higher than C=O double bonds (1700 cm⁻¹), which exceed C-O single bonds (1000 cm⁻¹), demonstrating bond strength effects in pharmaceutical compound analysis.
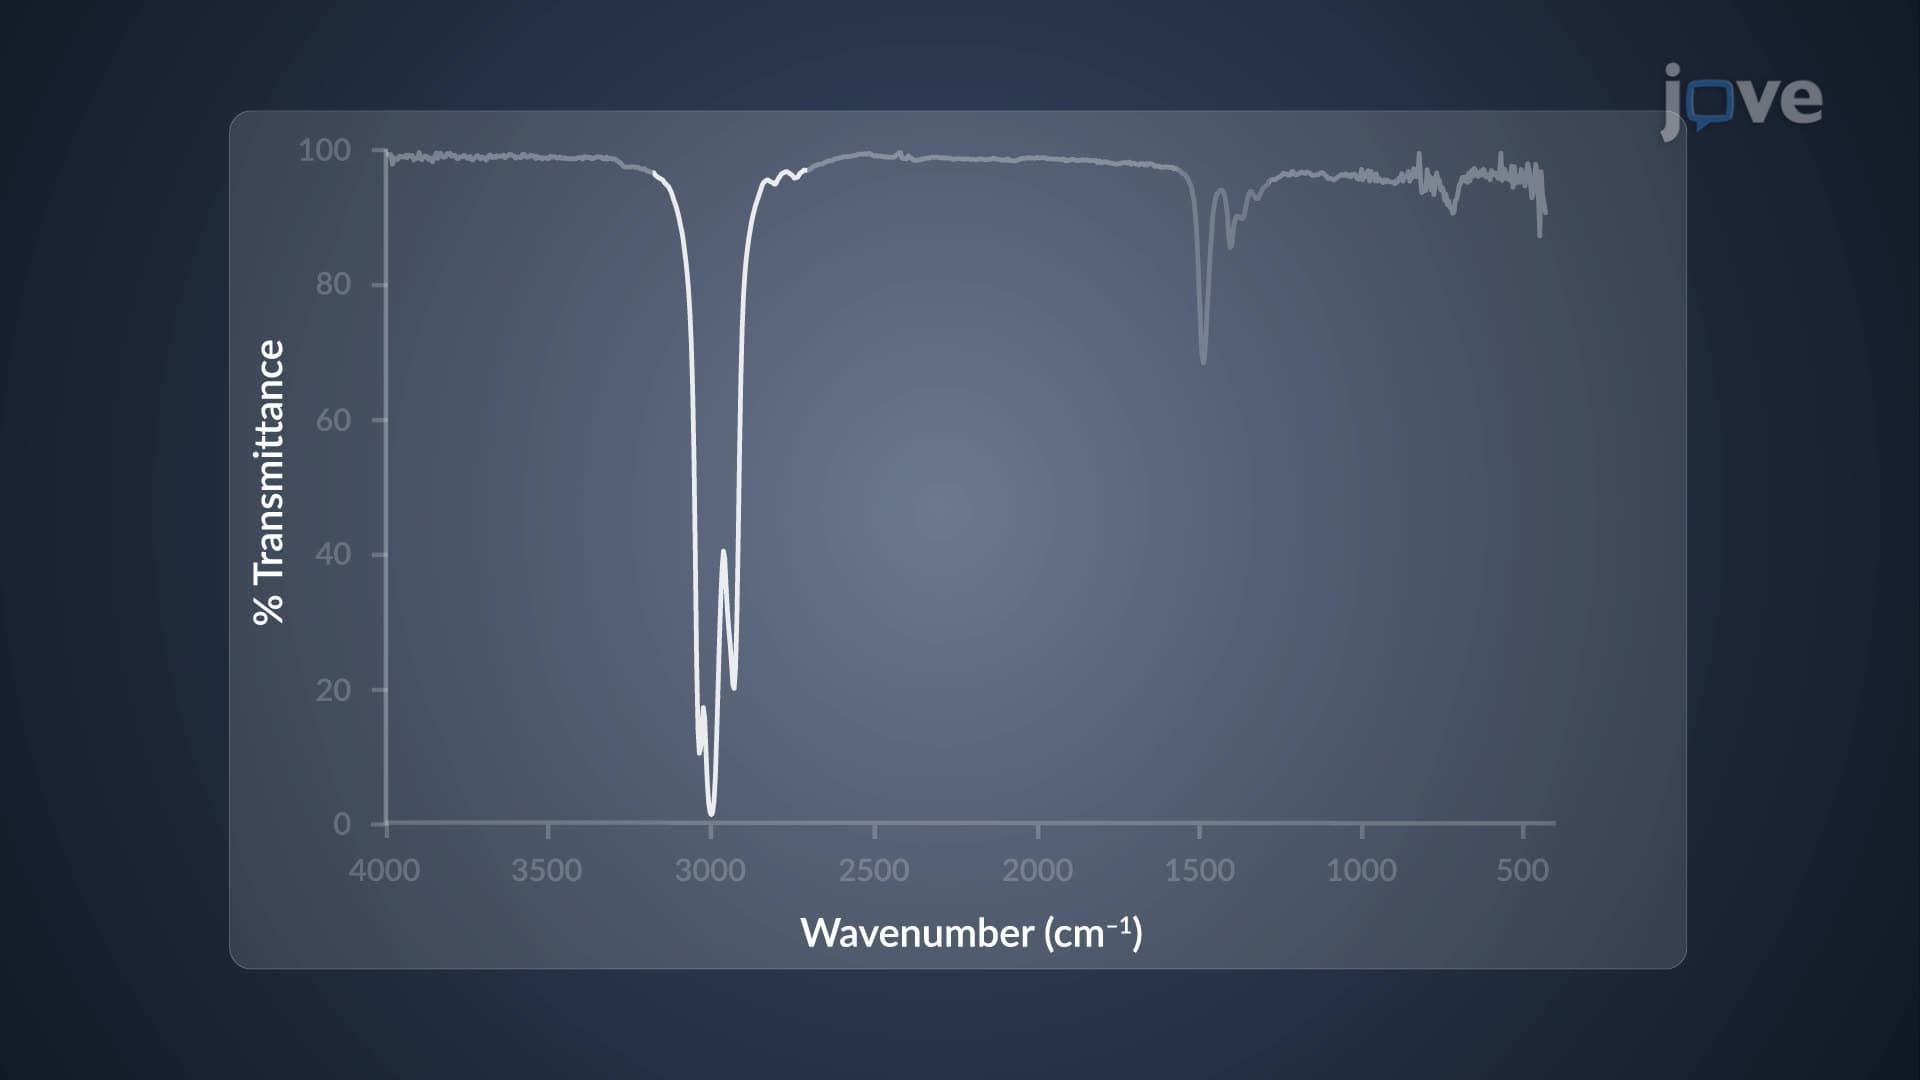
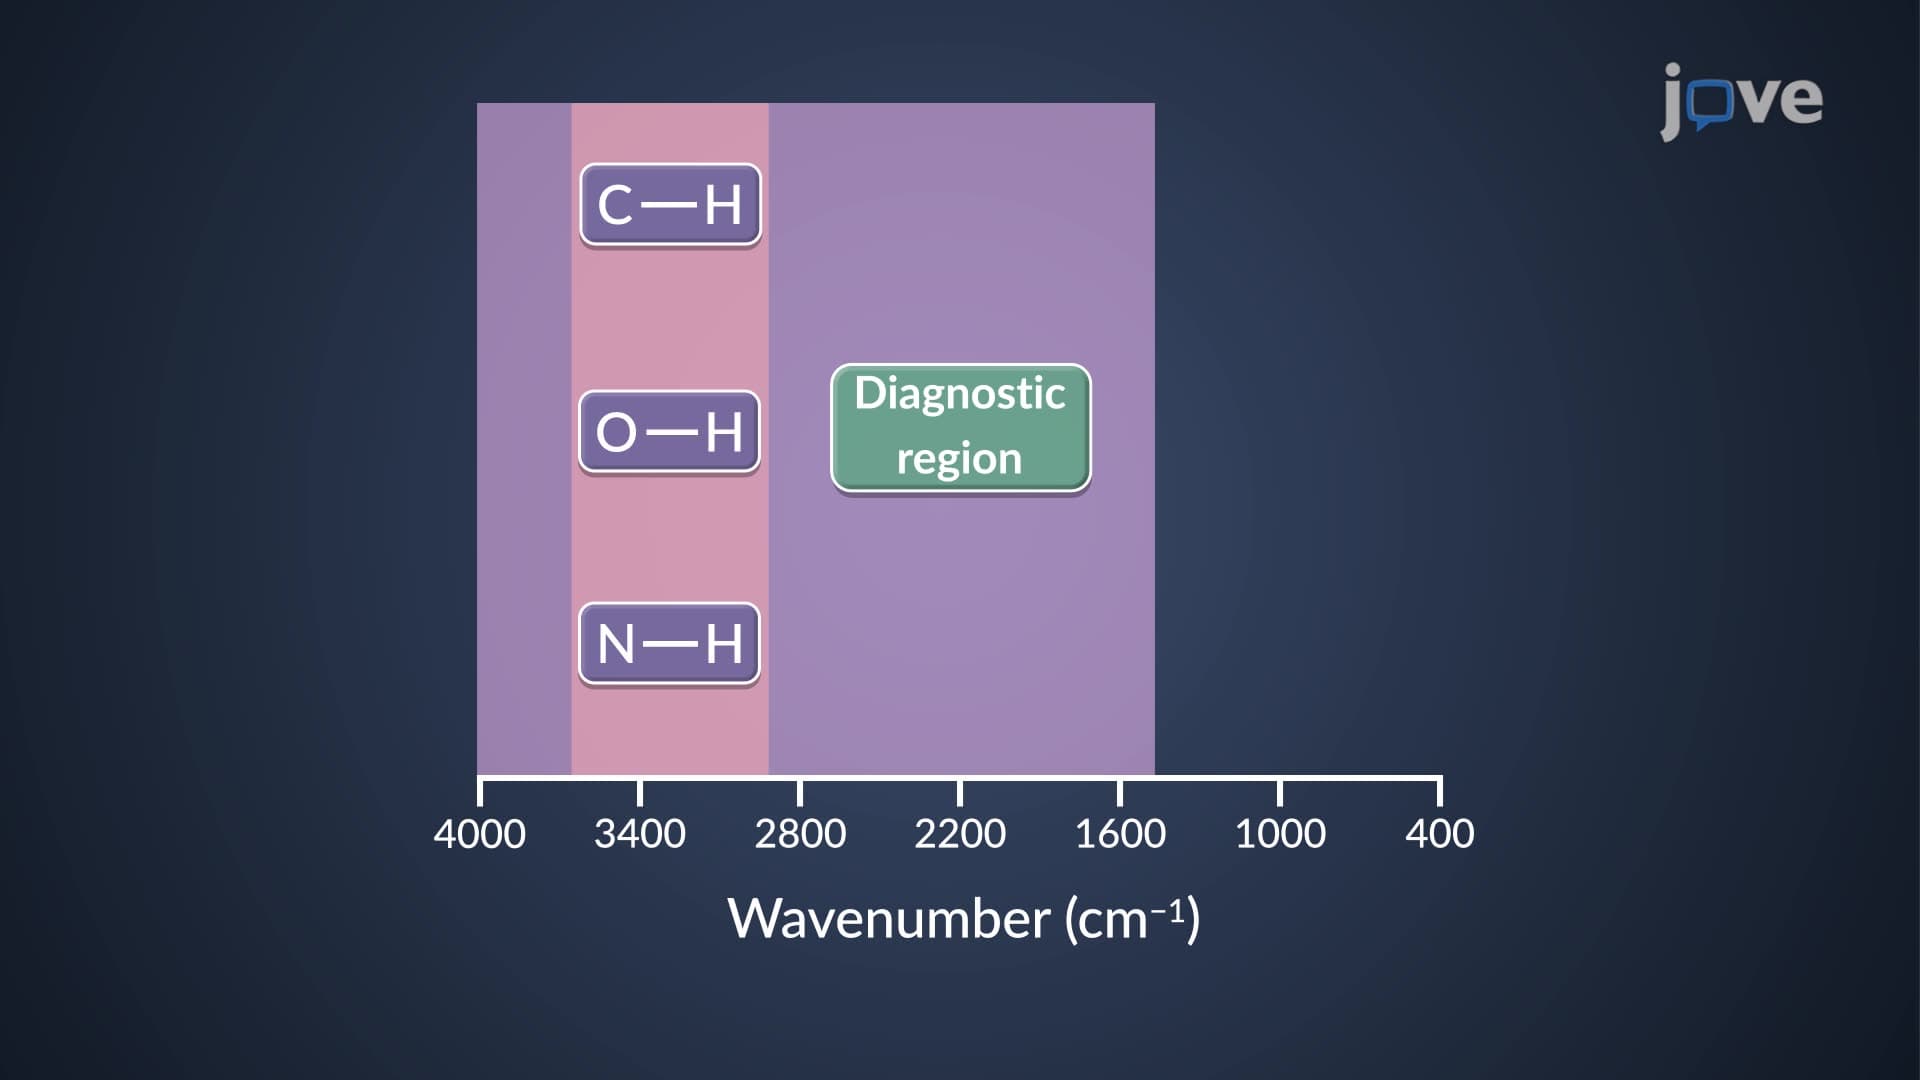
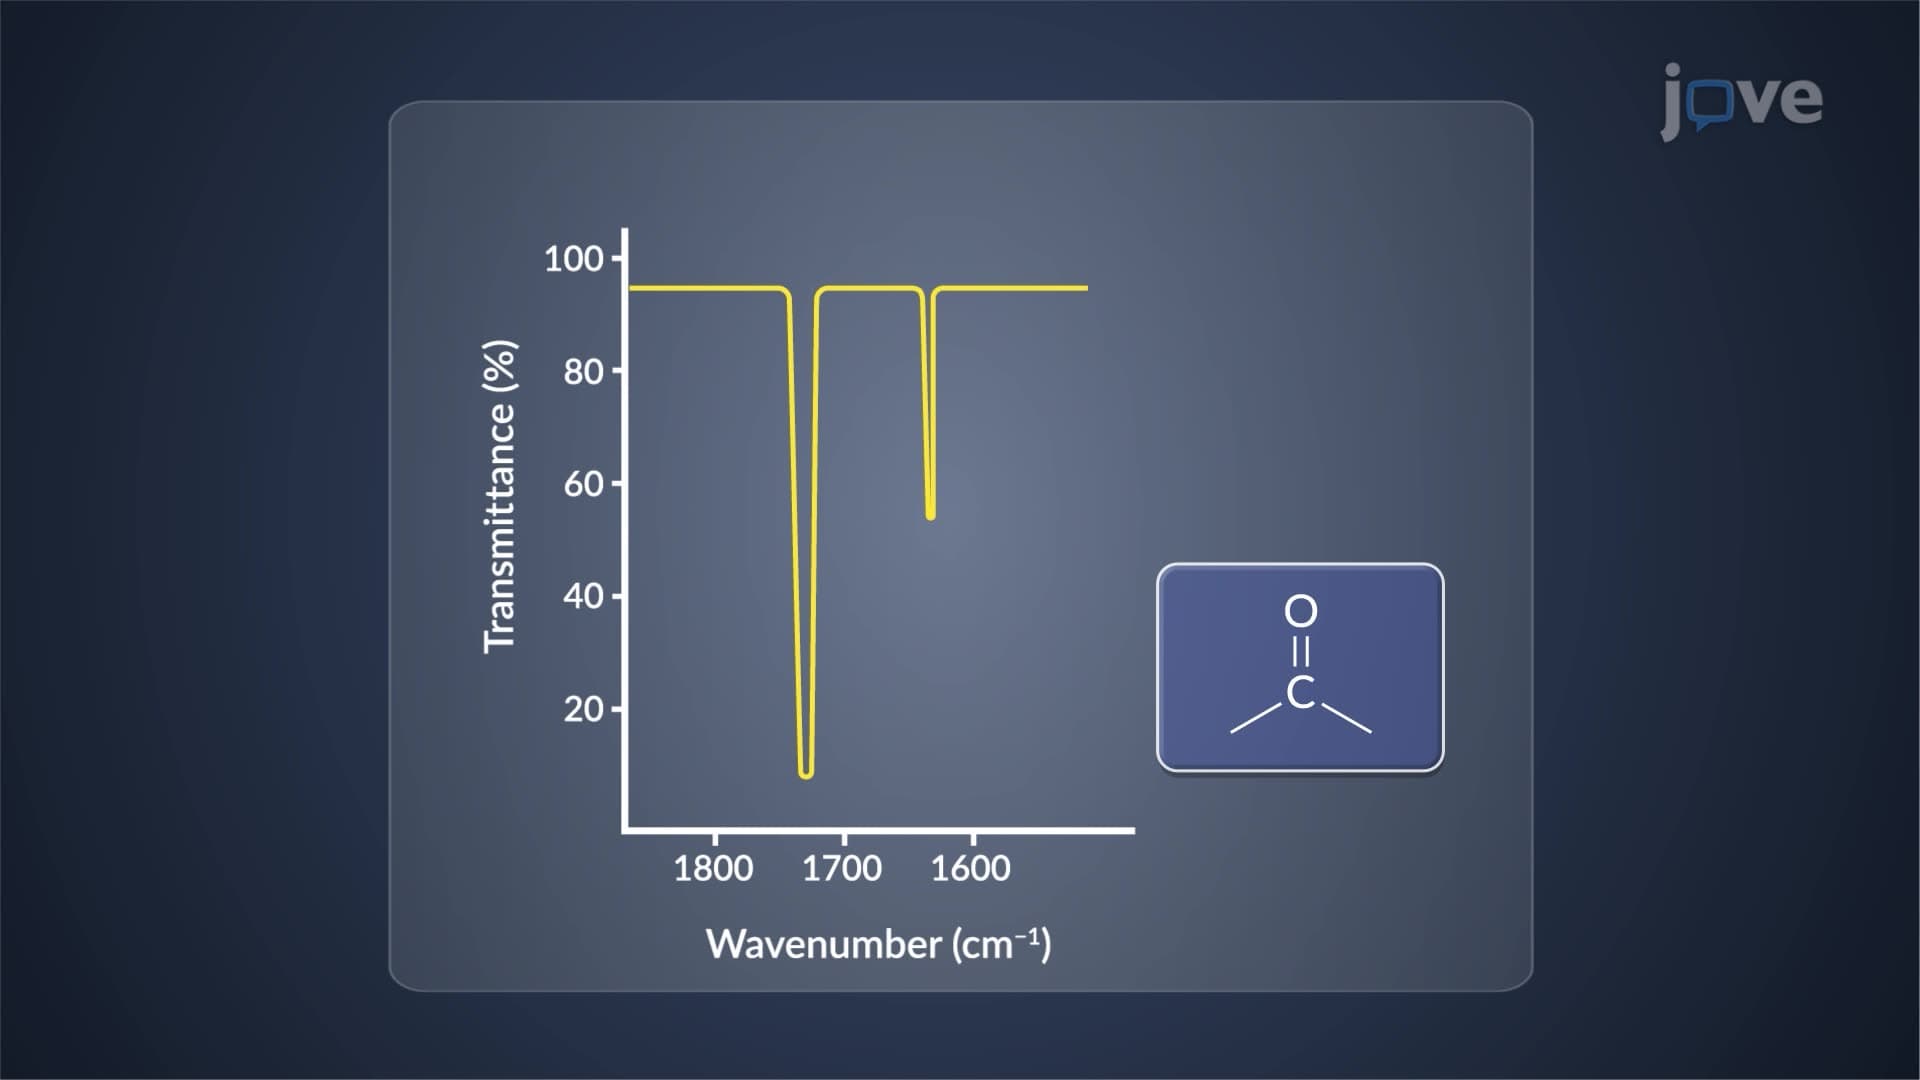
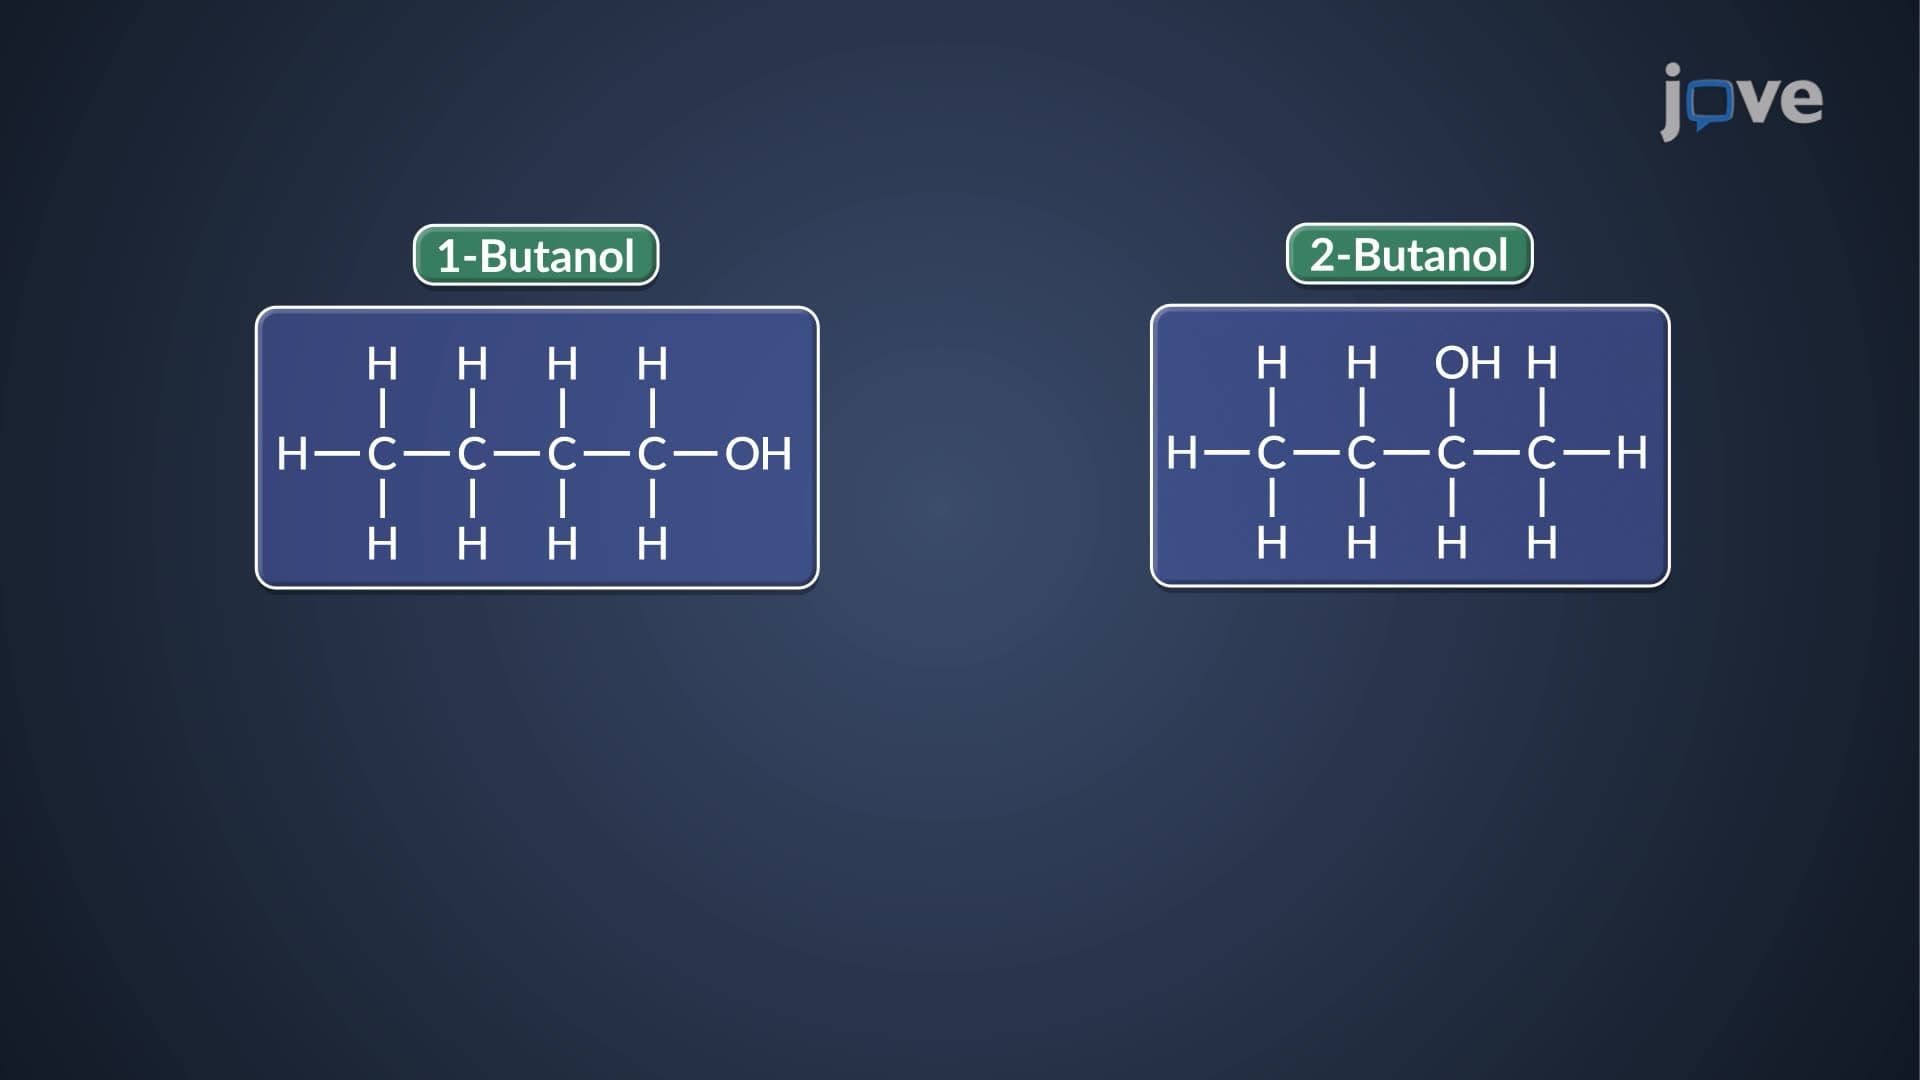
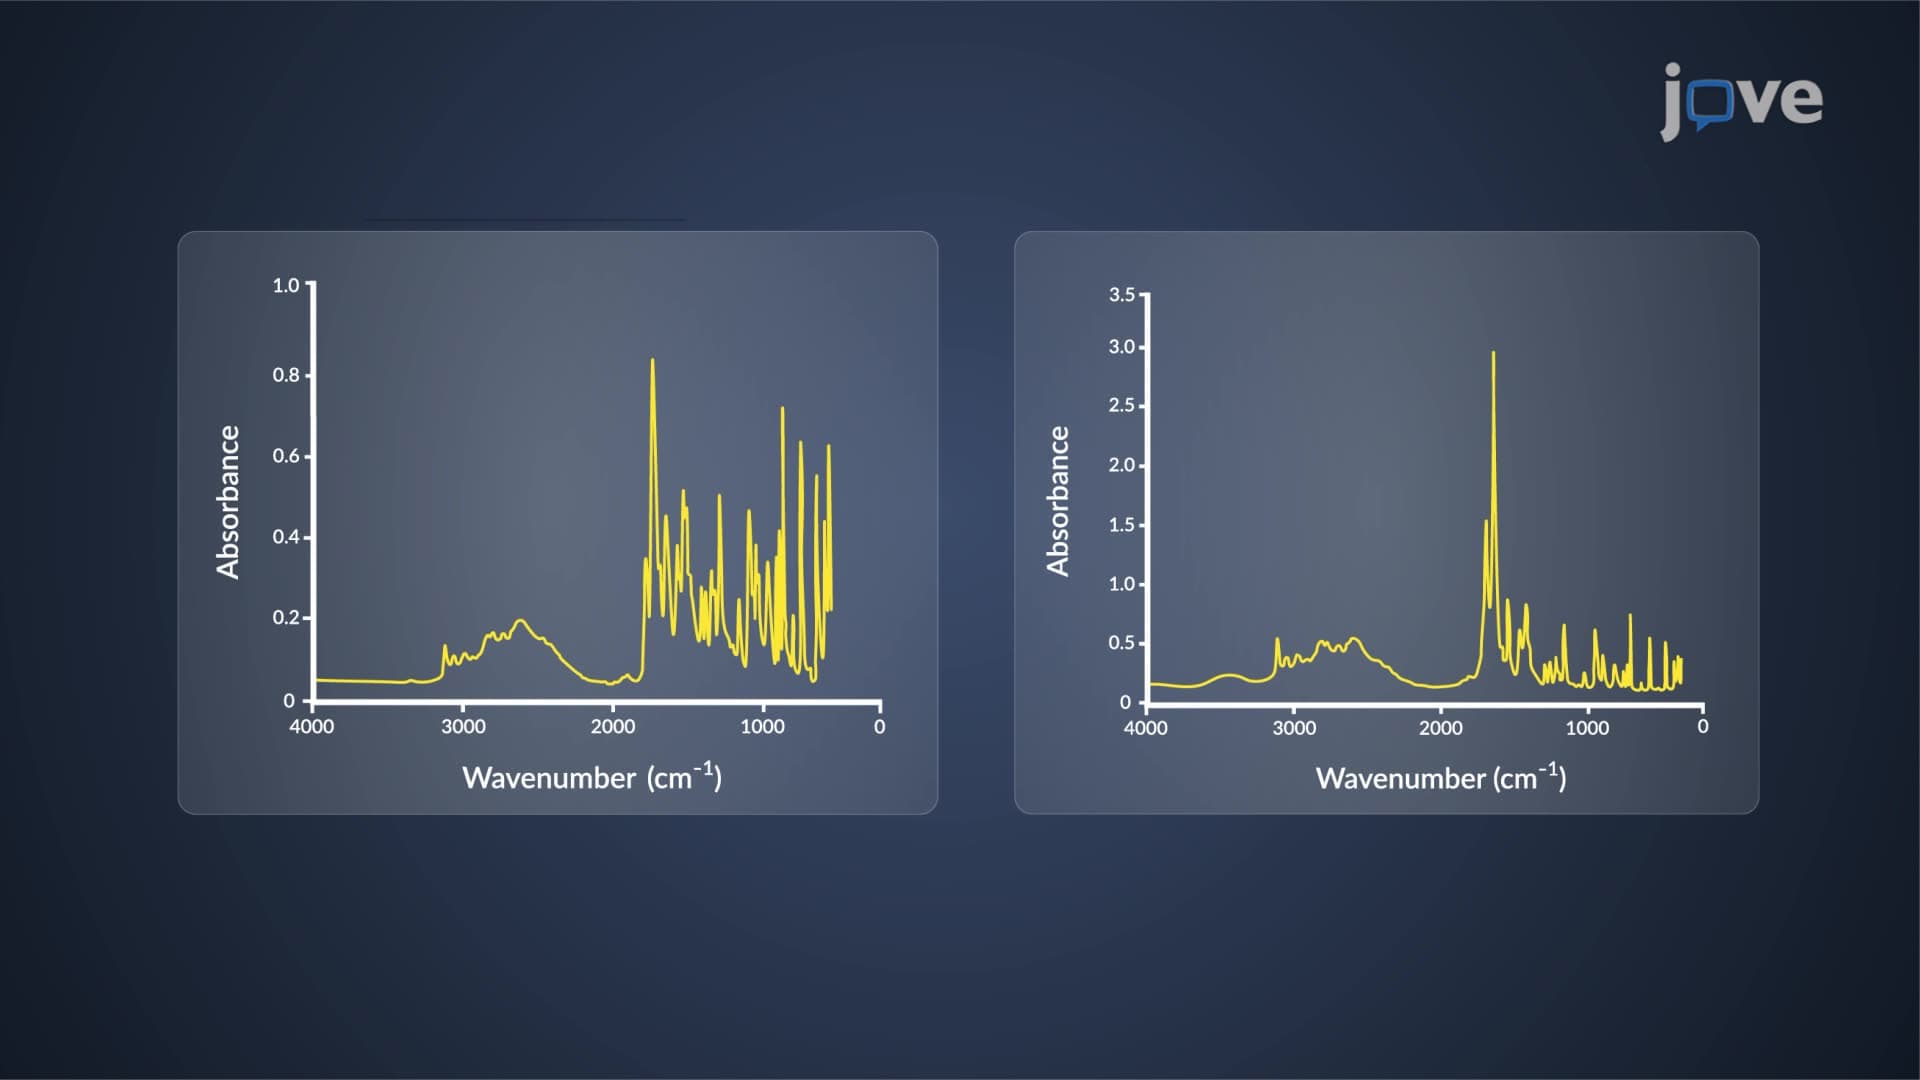
3. IR Spectral Regions and Functional Group Identification The IR spectrum divides into diagnostic (4000-1500 cm⁻¹) and fingerprint (1500-400 cm⁻¹) regions. The diagnostic region contains characteristic functional group absorptions: O-H stretching (3200-3600 cm⁻¹), C-H stretching (2800-3100 cm⁻¹), C≡C and C≡N (2100-2260 cm⁻¹), and C=O (1650-1750 cm⁻¹). The fingerprint region shows unique patterns for each compound, like distinguishing between constitutional isomers 1-butanol and 2-butanol. US pharmaceutical companies use these regions to verify drug purity-aspirin shows characteristic C=O stretch at 1680 cm⁻¹ and O-H stretch at 3200 cm⁻¹, confirming its carboxylic acid functionality.
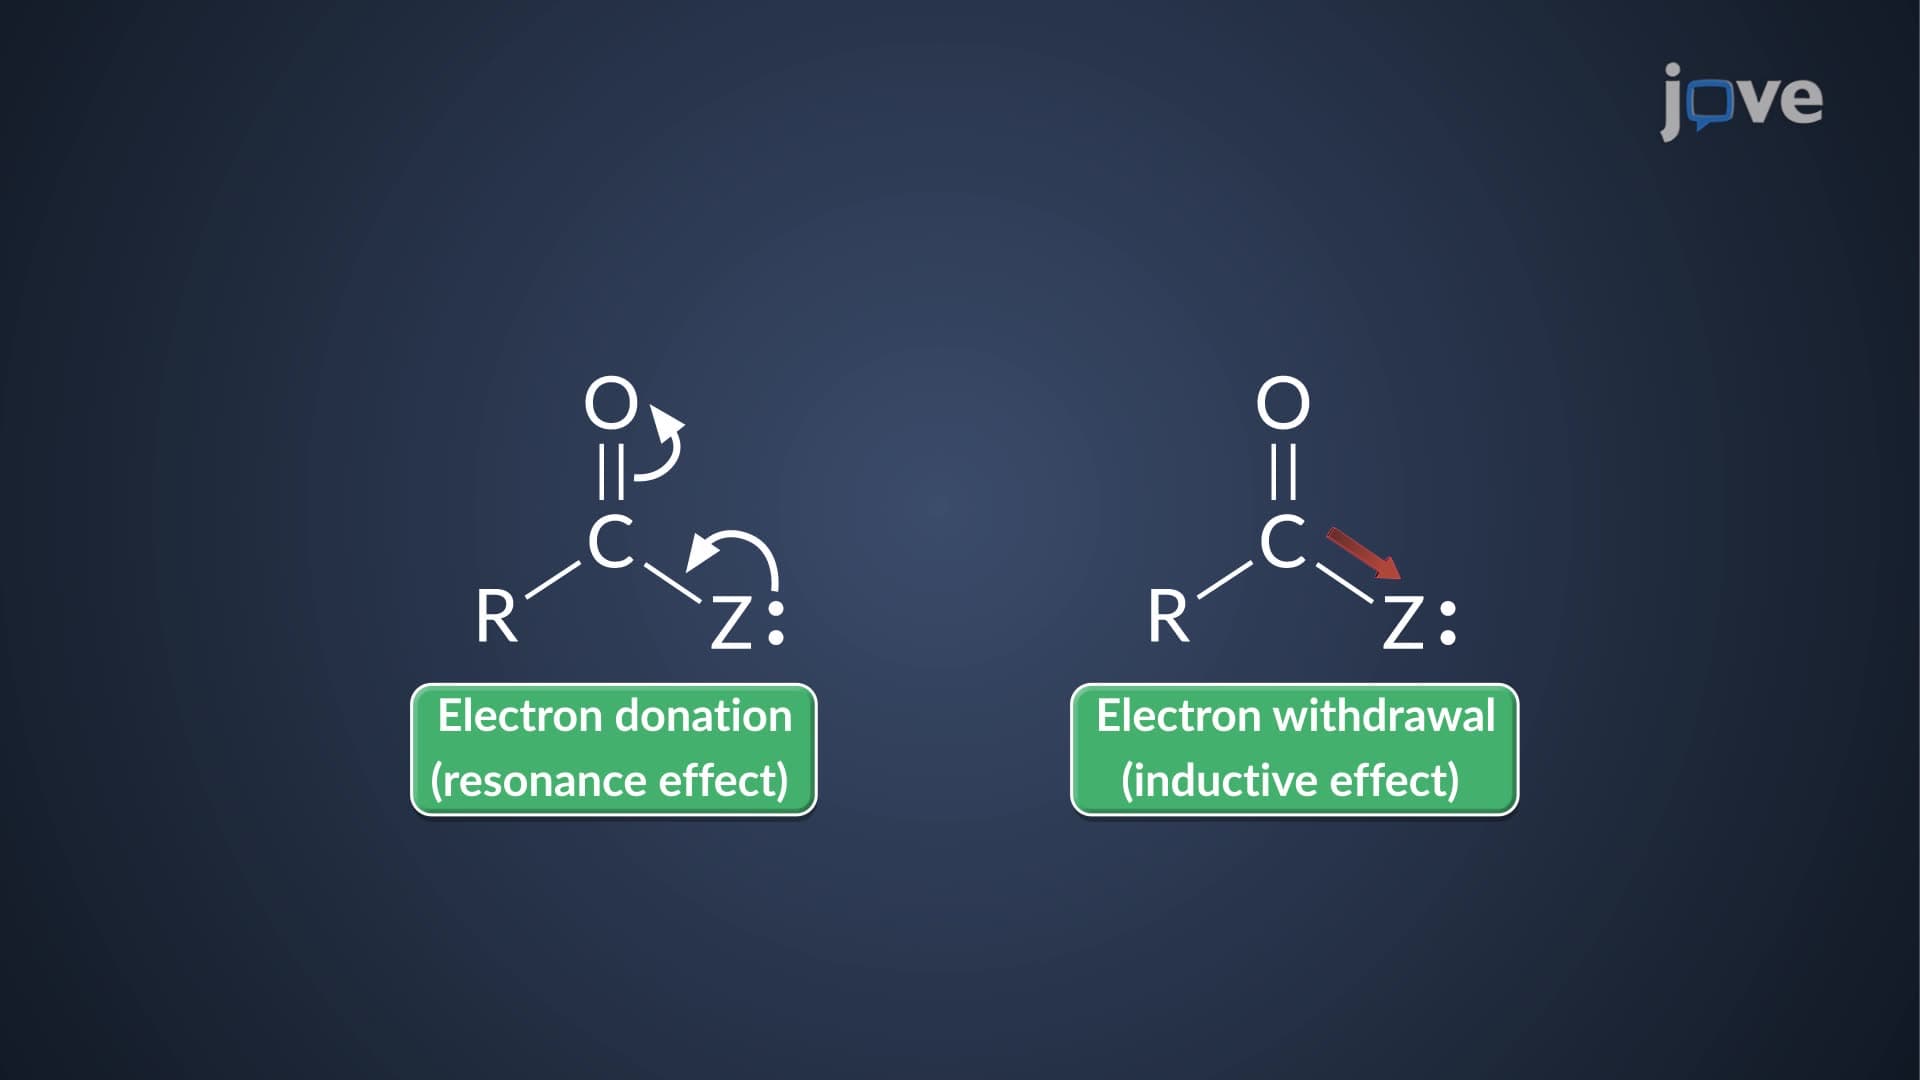
4. Effects of Hybridization and Electronic Structure on IR Frequencies Carbon hybridization dramatically affects C-H stretching frequencies due to s-orbital character differences. Alkanes (sp³) show C-H stretches below 3000 cm⁻¹, alkenes (sp²) around 3100 cm⁻¹, and alkynes (sp) near 3300 cm⁻¹. Higher s-character creates shorter, stronger bonds with higher frequencies. Electronic delocalization through conjugation or resonance lowers frequencies-conjugated ketones absorb at lower frequencies than isolated ketones due to partial single-bond character from electron delocalization. Forensic laboratories use these principles when analyzing unknown organic compounds, where gasoline components show alkane C-H patterns while aromatic compounds display characteristic sp² signatures.
5. Hydrogen Bonding Effects and Peak Broadening Hydrogen bonding significantly affects IR spectra by weakening bonds and broadening peaks. Free O-H groups in dilute alcohols show sharp peaks at 3600 cm⁻¹, while hydrogen-bonded O-H groups in concentrated solutions create broad absorptions at 3200-3550 cm⁻¹. This effect helps identify alcohol concentration and intermolecular interactions-wine analysis shows broad O-H peaks indicating extensive hydrogen bonding in aqueous ethanol solutions. Similarly, carboxylic acids show very broad O-H stretches (2500-3300 cm⁻¹) due to dimer formation through hydrogen bonding, distinguishing them from alcohols in food chemistry applications.
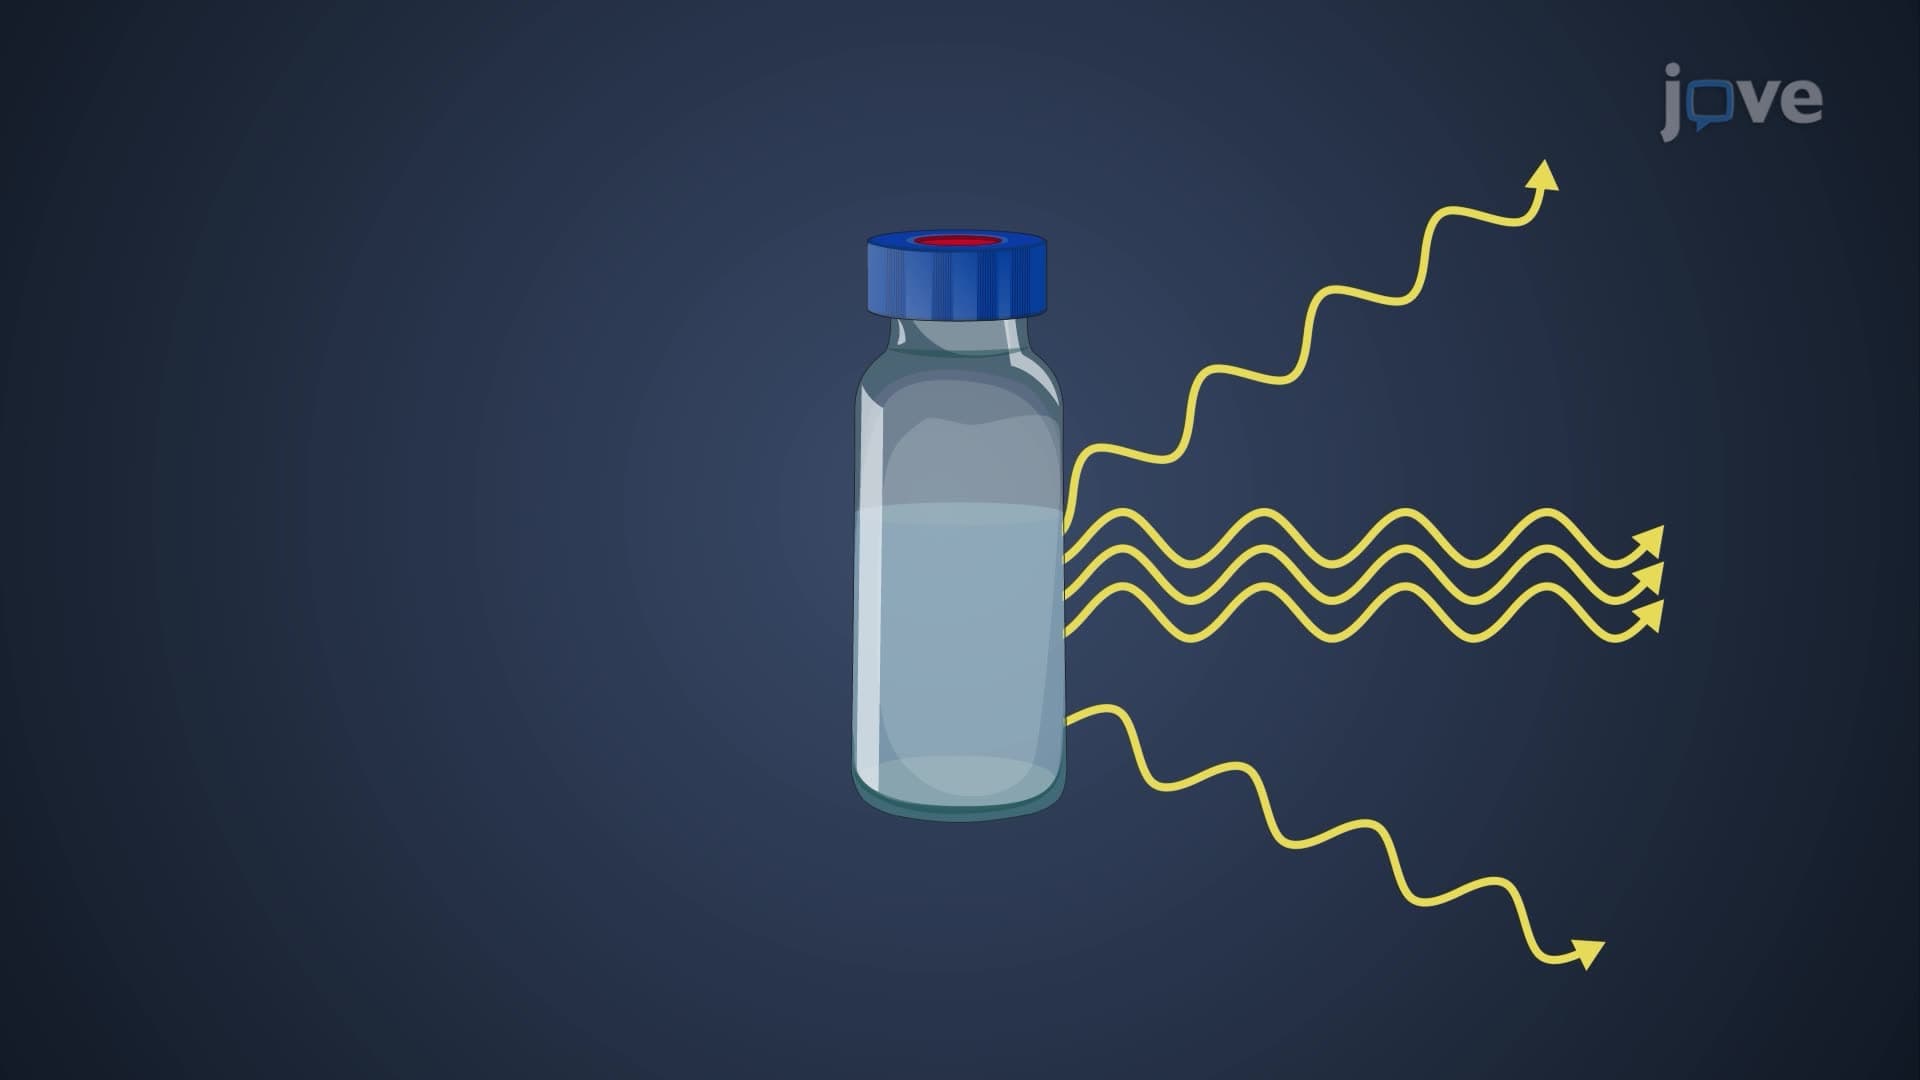
6. Raman Spectroscopy Principles and Complementary Analysis Raman spectroscopy detects inelastic light scattering when molecular polarizability changes during vibration, complementing IR spectroscopy through different selection rules. Symmetric vibrations often Raman-active but IR-inactive, while asymmetric vibrations typically show strong IR absorption. Stokes scattering (lower energy) dominates over anti-Stokes (higher energy) due to ground-state population differences. US pharmaceutical companies use Raman for non-destructive tablet analysis through packaging, identifying active ingredients without sample preparation. The technique excels for analyzing symmetric molecules like benzene rings in drug compounds, where C=C stretching appears strongly in Raman but weakly in IR spectra.