Chemical applications of statistical analyses are essential for interpreting experimental data, validating analytical methods, and ensuring quality control in laboratory settings. This comprehensive course covers statistical methods chemistry students need to master, from basic error analysis to advanced techniques like ANOVA and regression analysis. JoVE Coach provides practical guidance for applying statistical analysis to chemical data through real-world examples and proven methodologies.
Understand different types of errors in chemical measurements and learn detection and minimization strategies
Identify and apply appropriate statistical tests including t-tests, F-tests, and Q-tests for chemical data
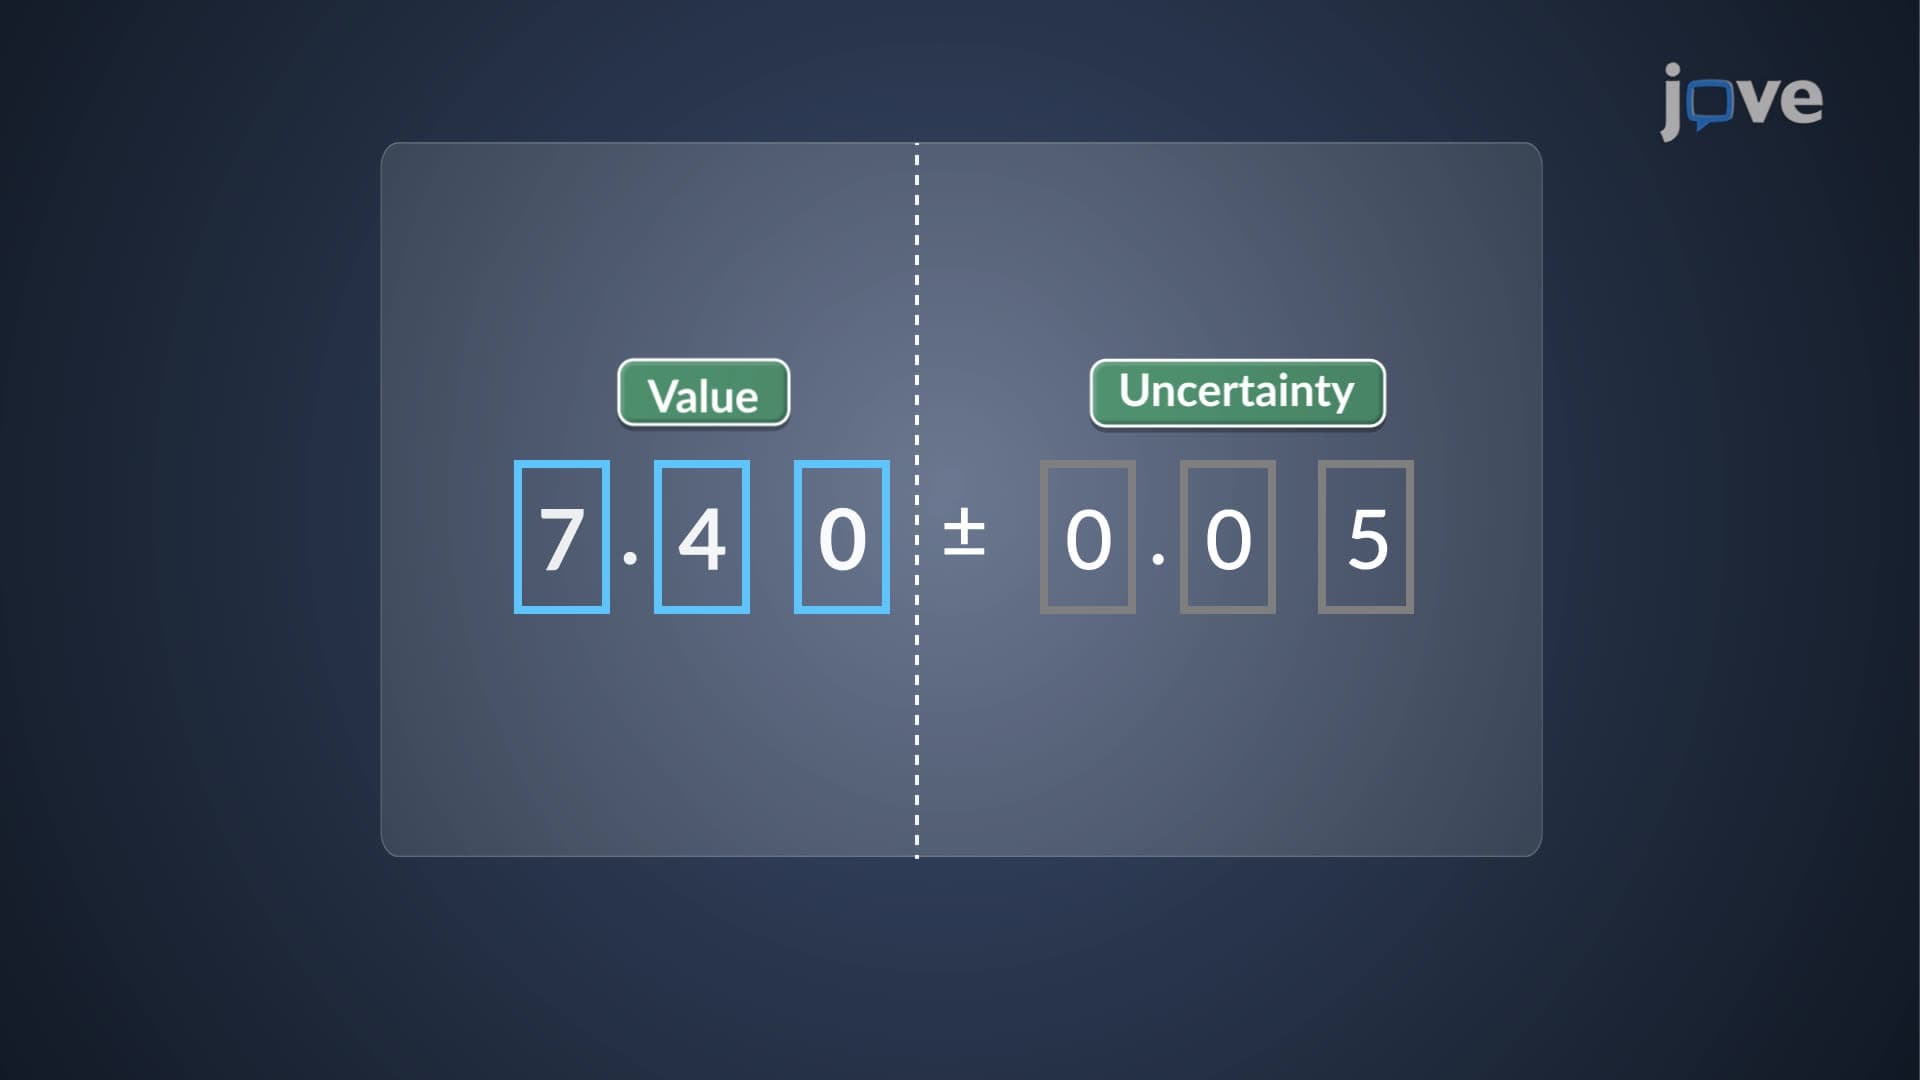
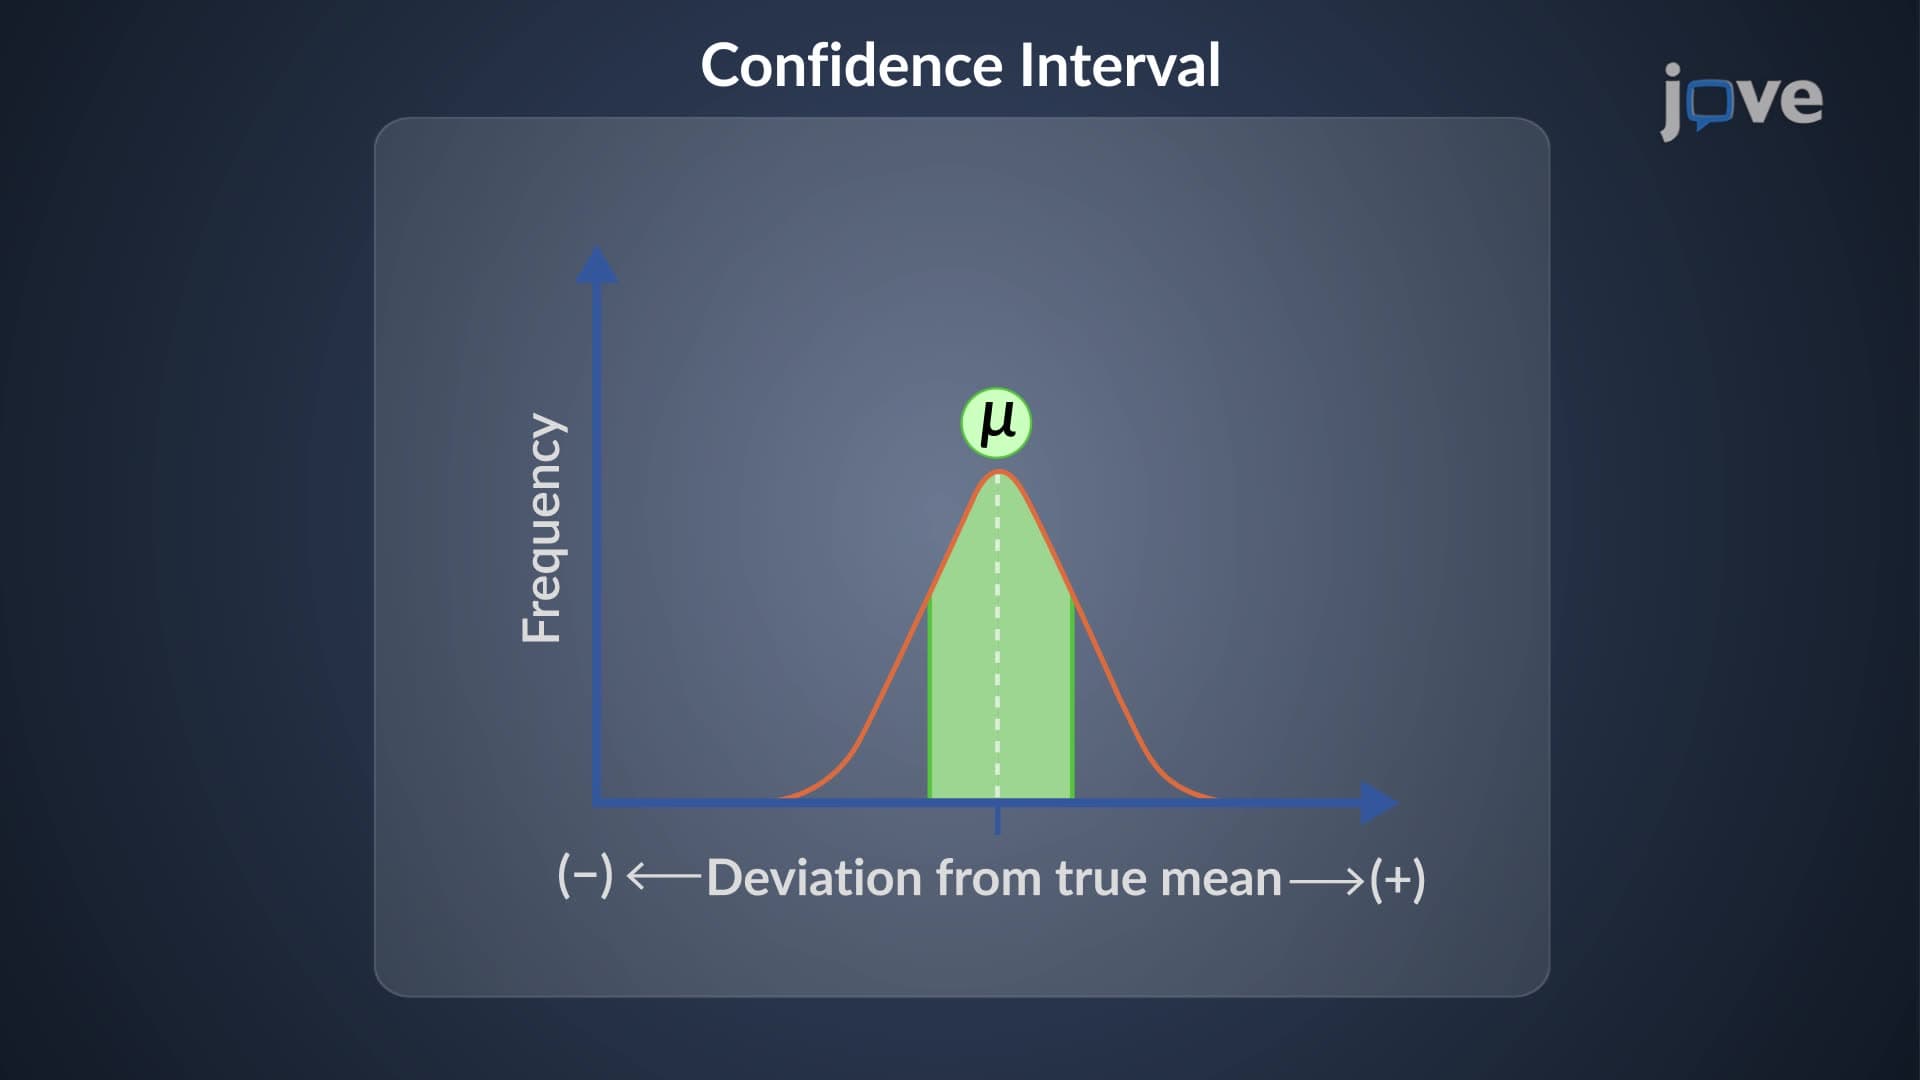
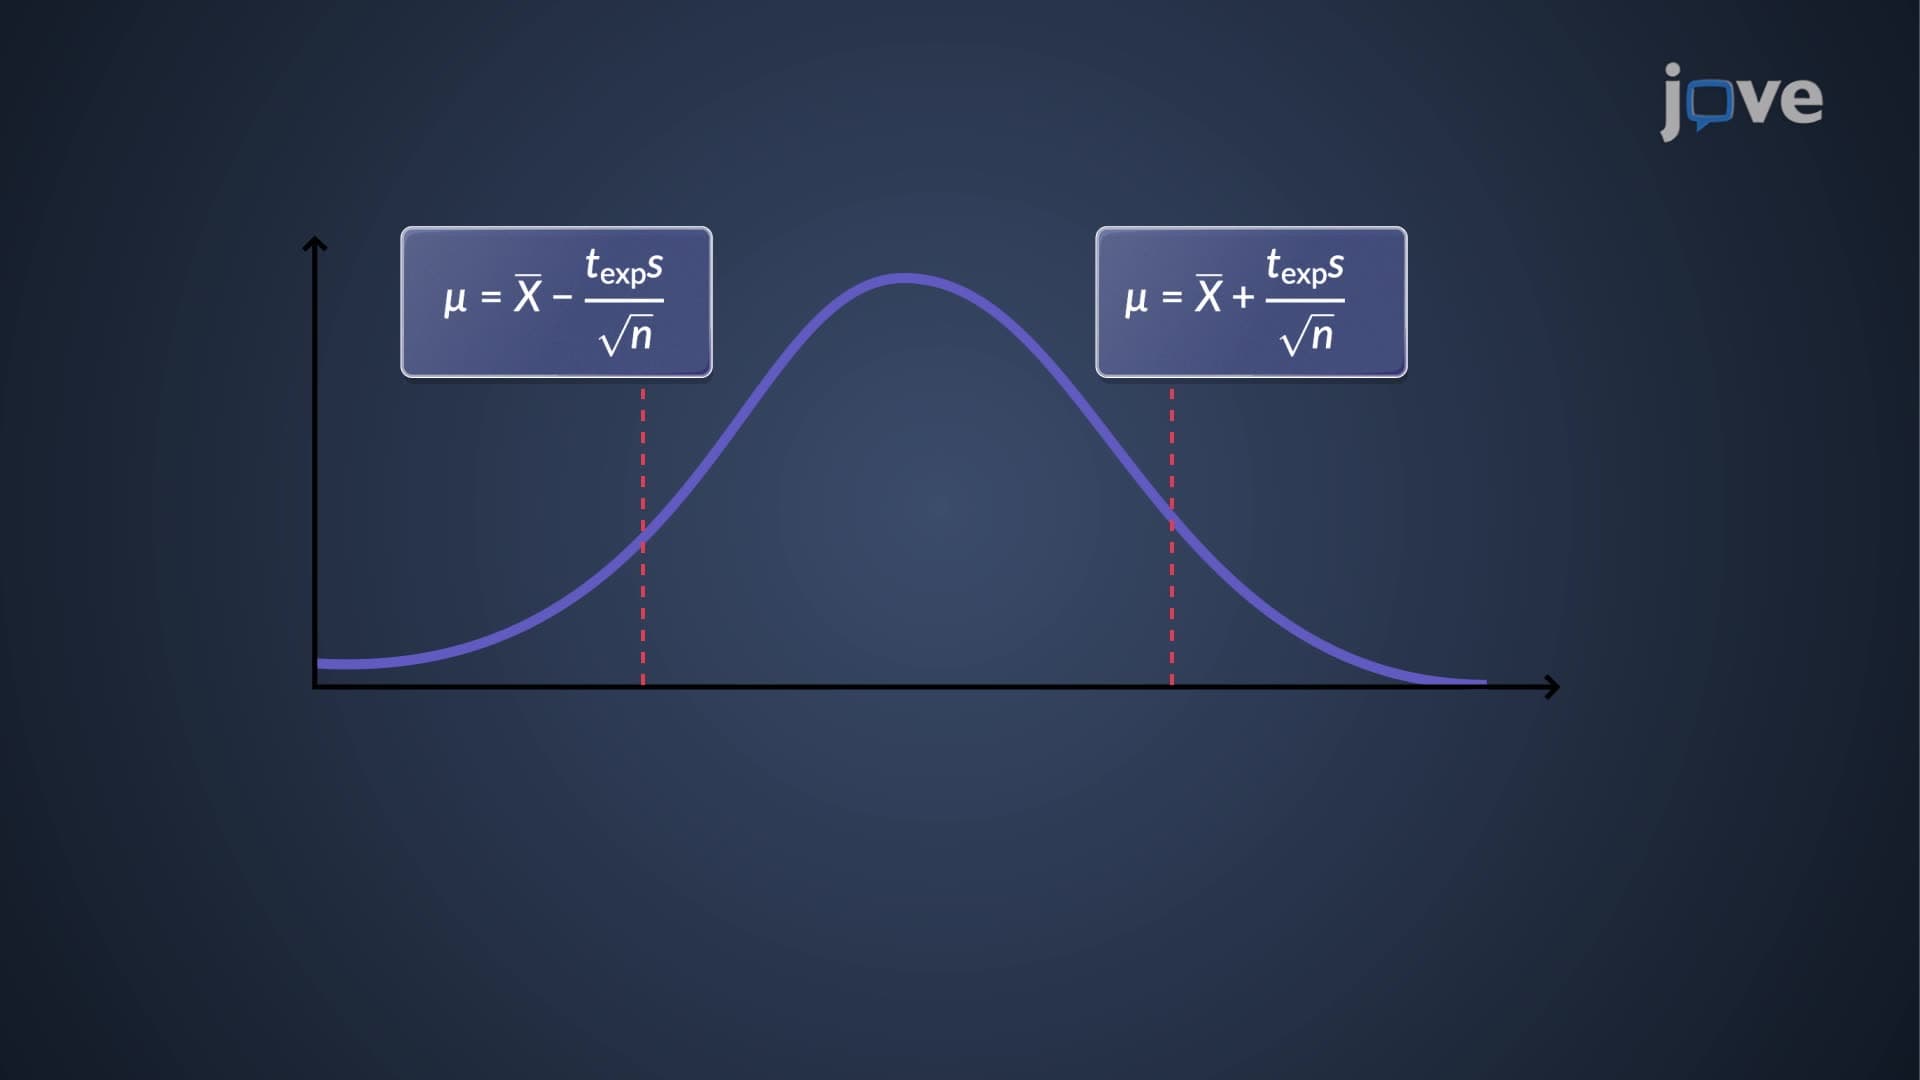
Analyze uncertainty propagation in calculations and interpret confidence intervals for analytical results
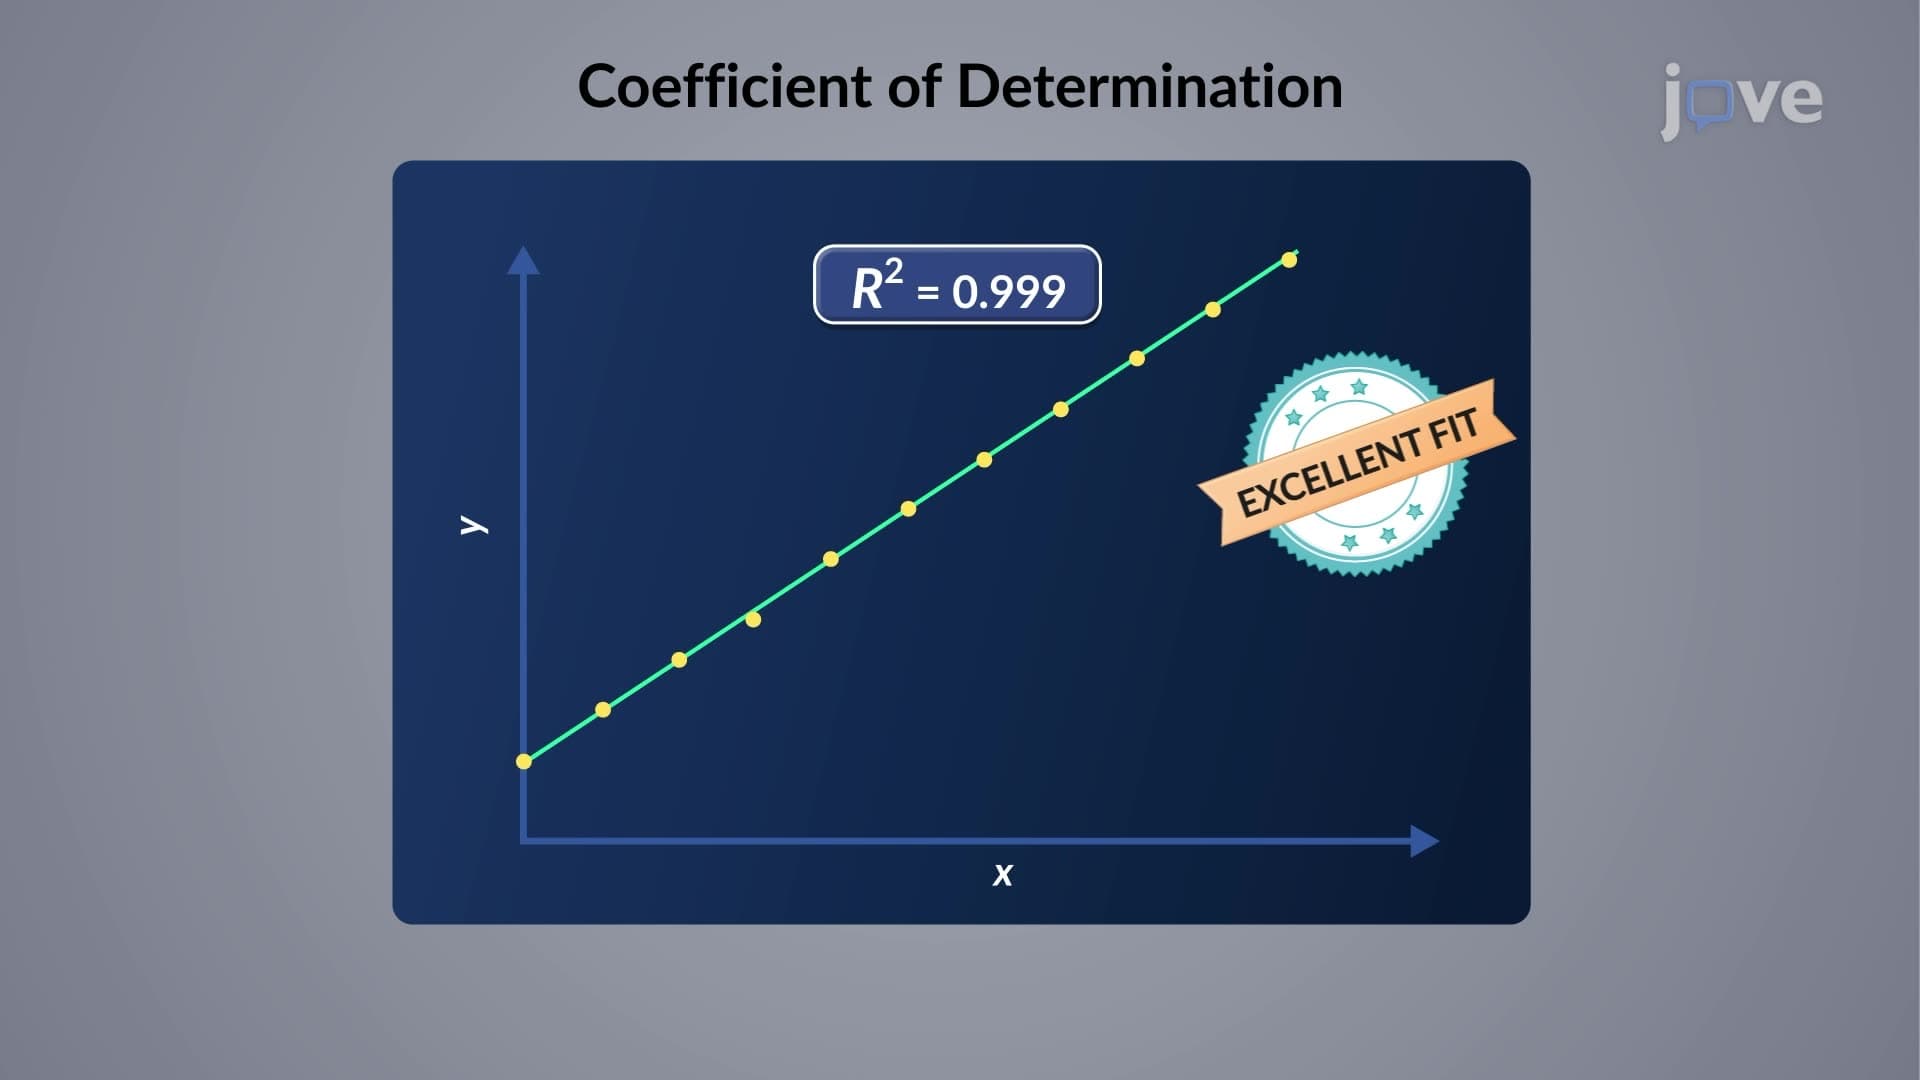
Explore calibration curve construction using linear least squares regression and correlation coefficients
Apply ANOVA methods to compare multiple chemical samples and experimental conditions
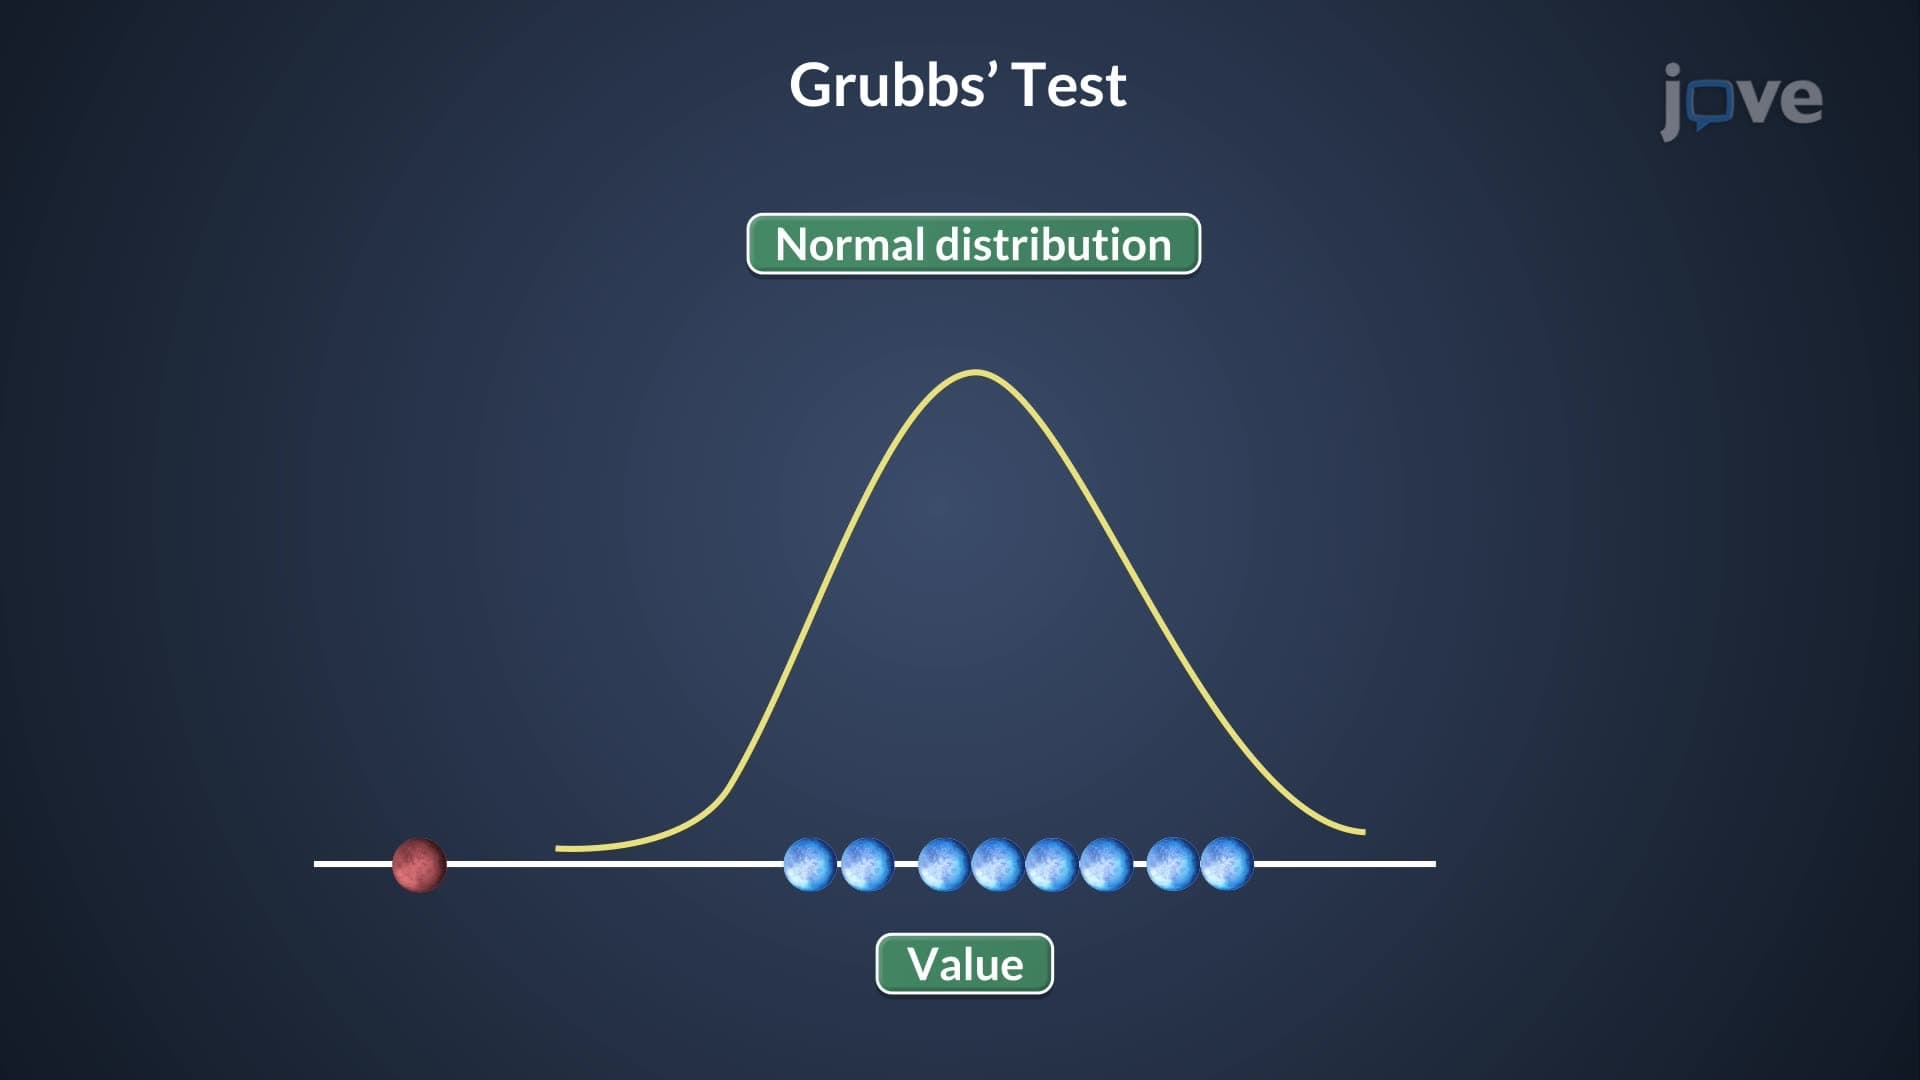
Learn to detect and handle outliers using Grubbs test and other statistical approaches
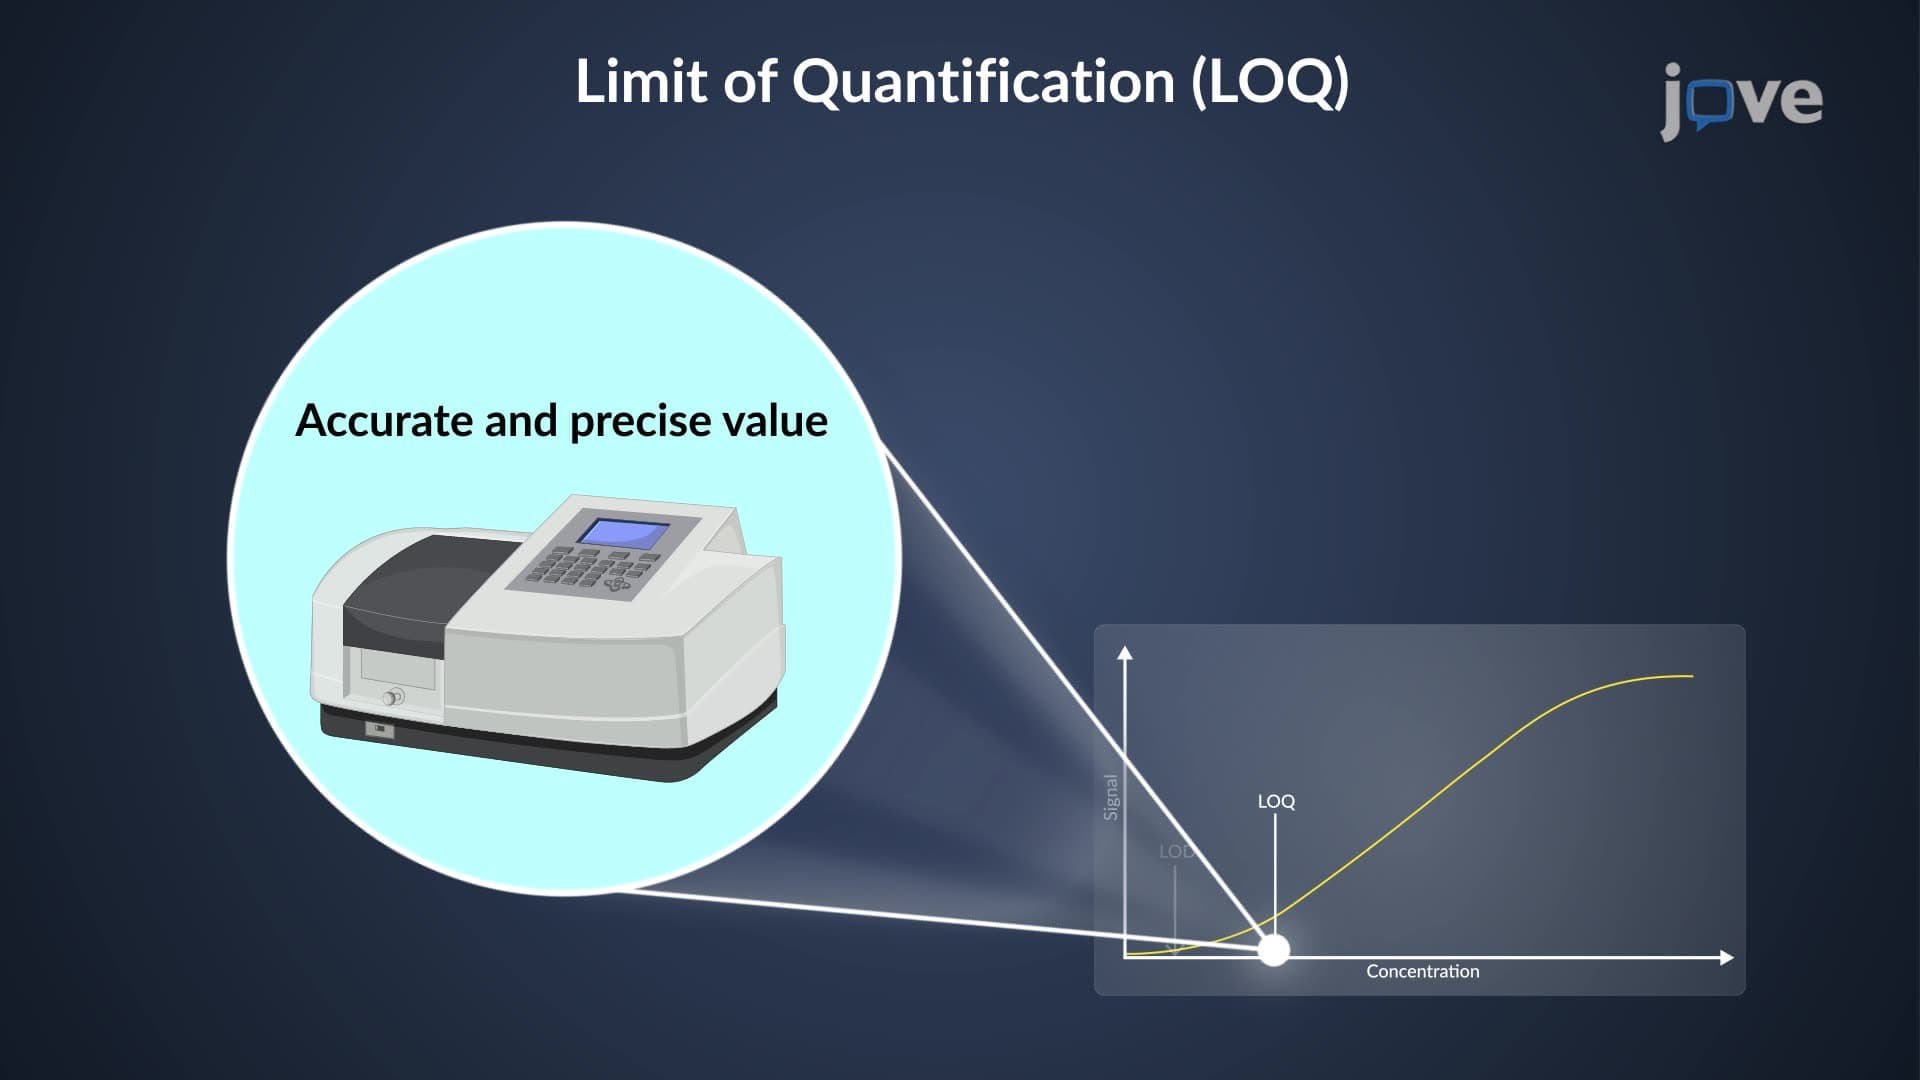
Understand limits of detection and quantification in analytical chemistry applications
Master z-score calculations for method validation and proficiency testing in laboratory settings
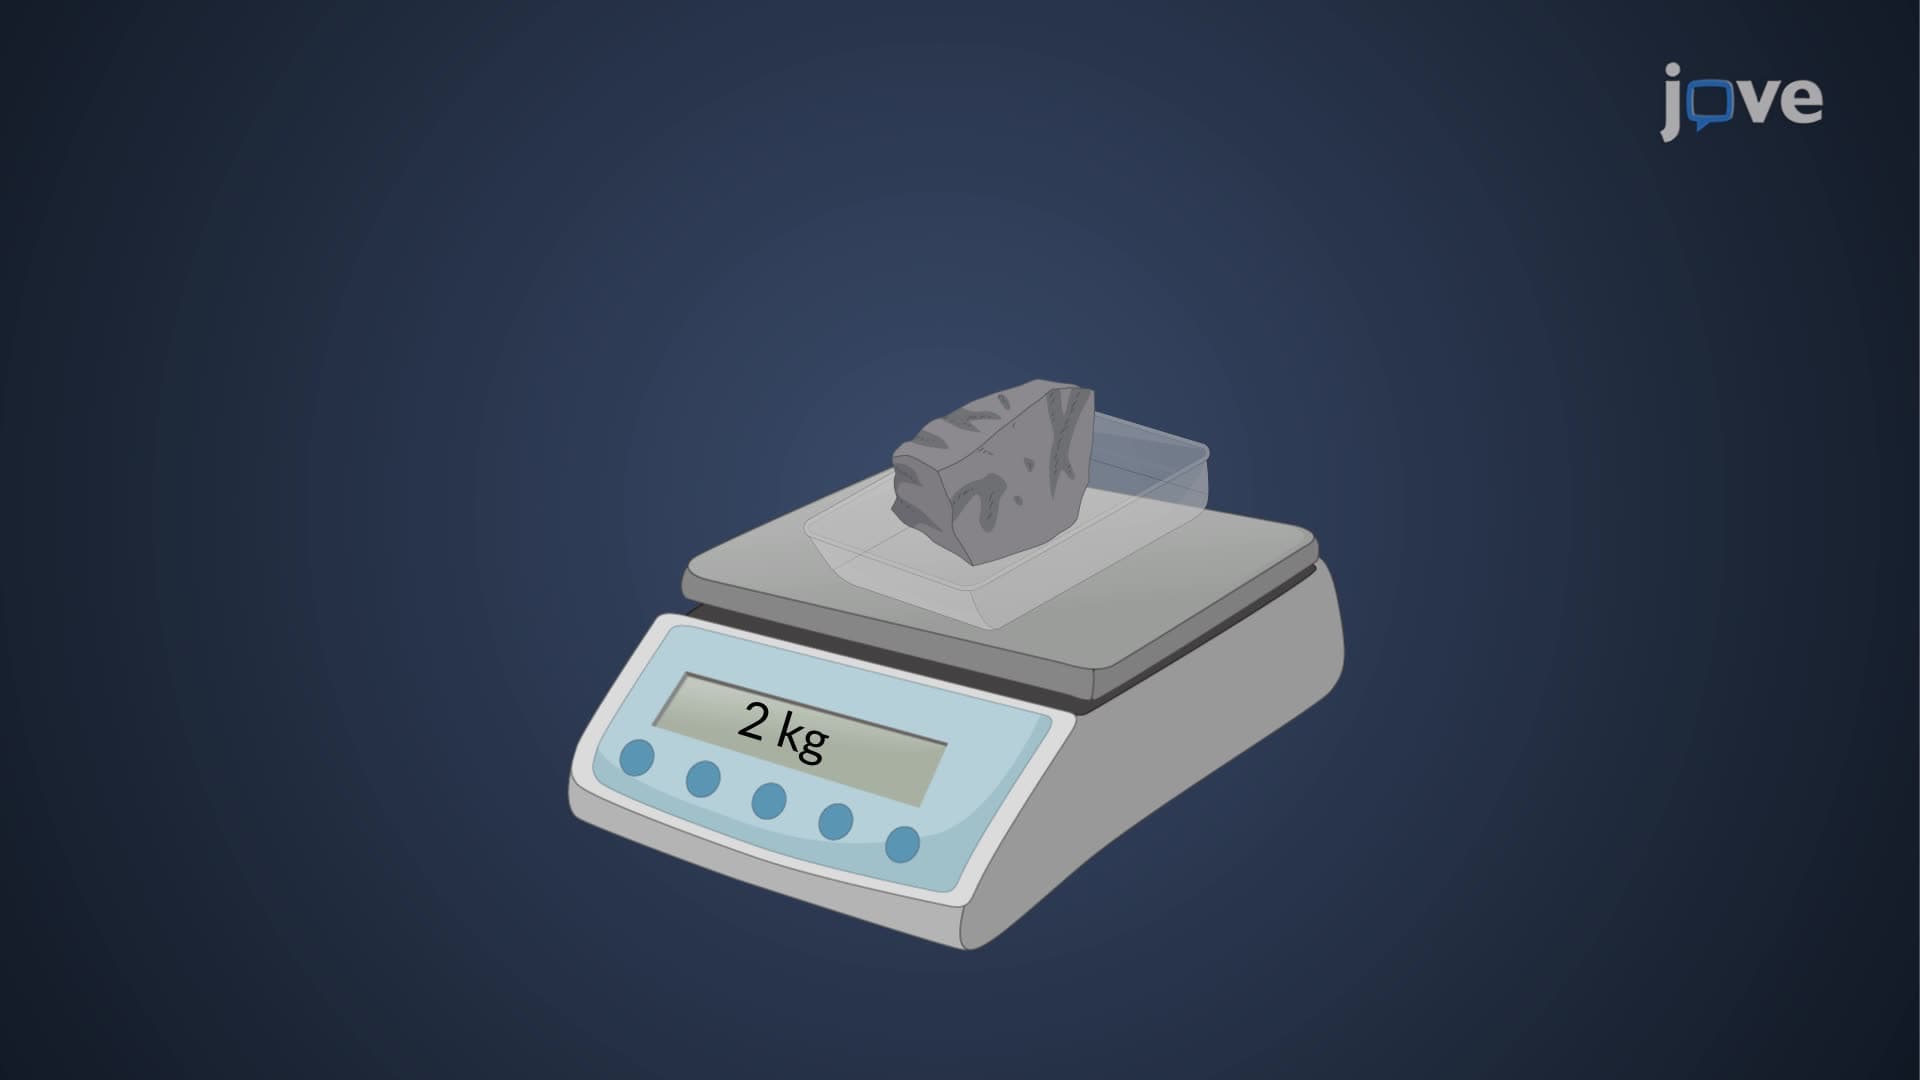
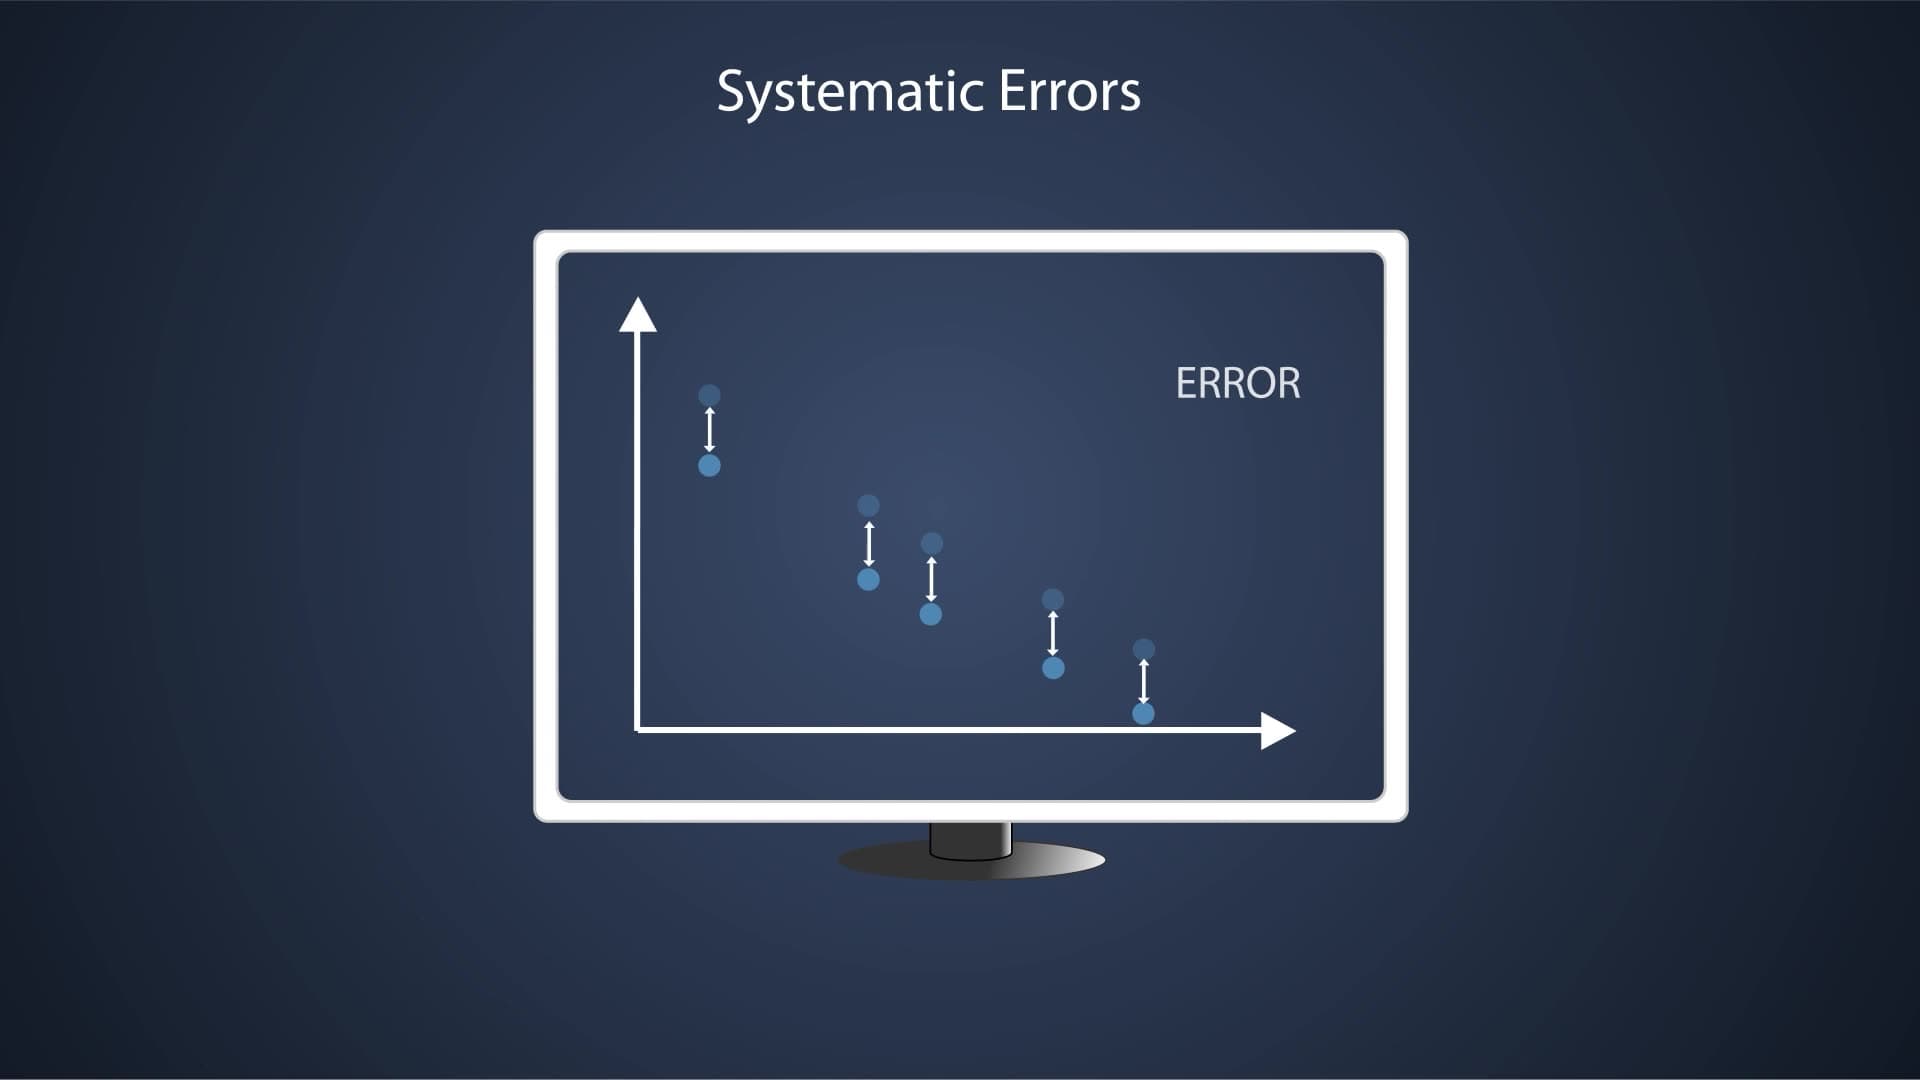
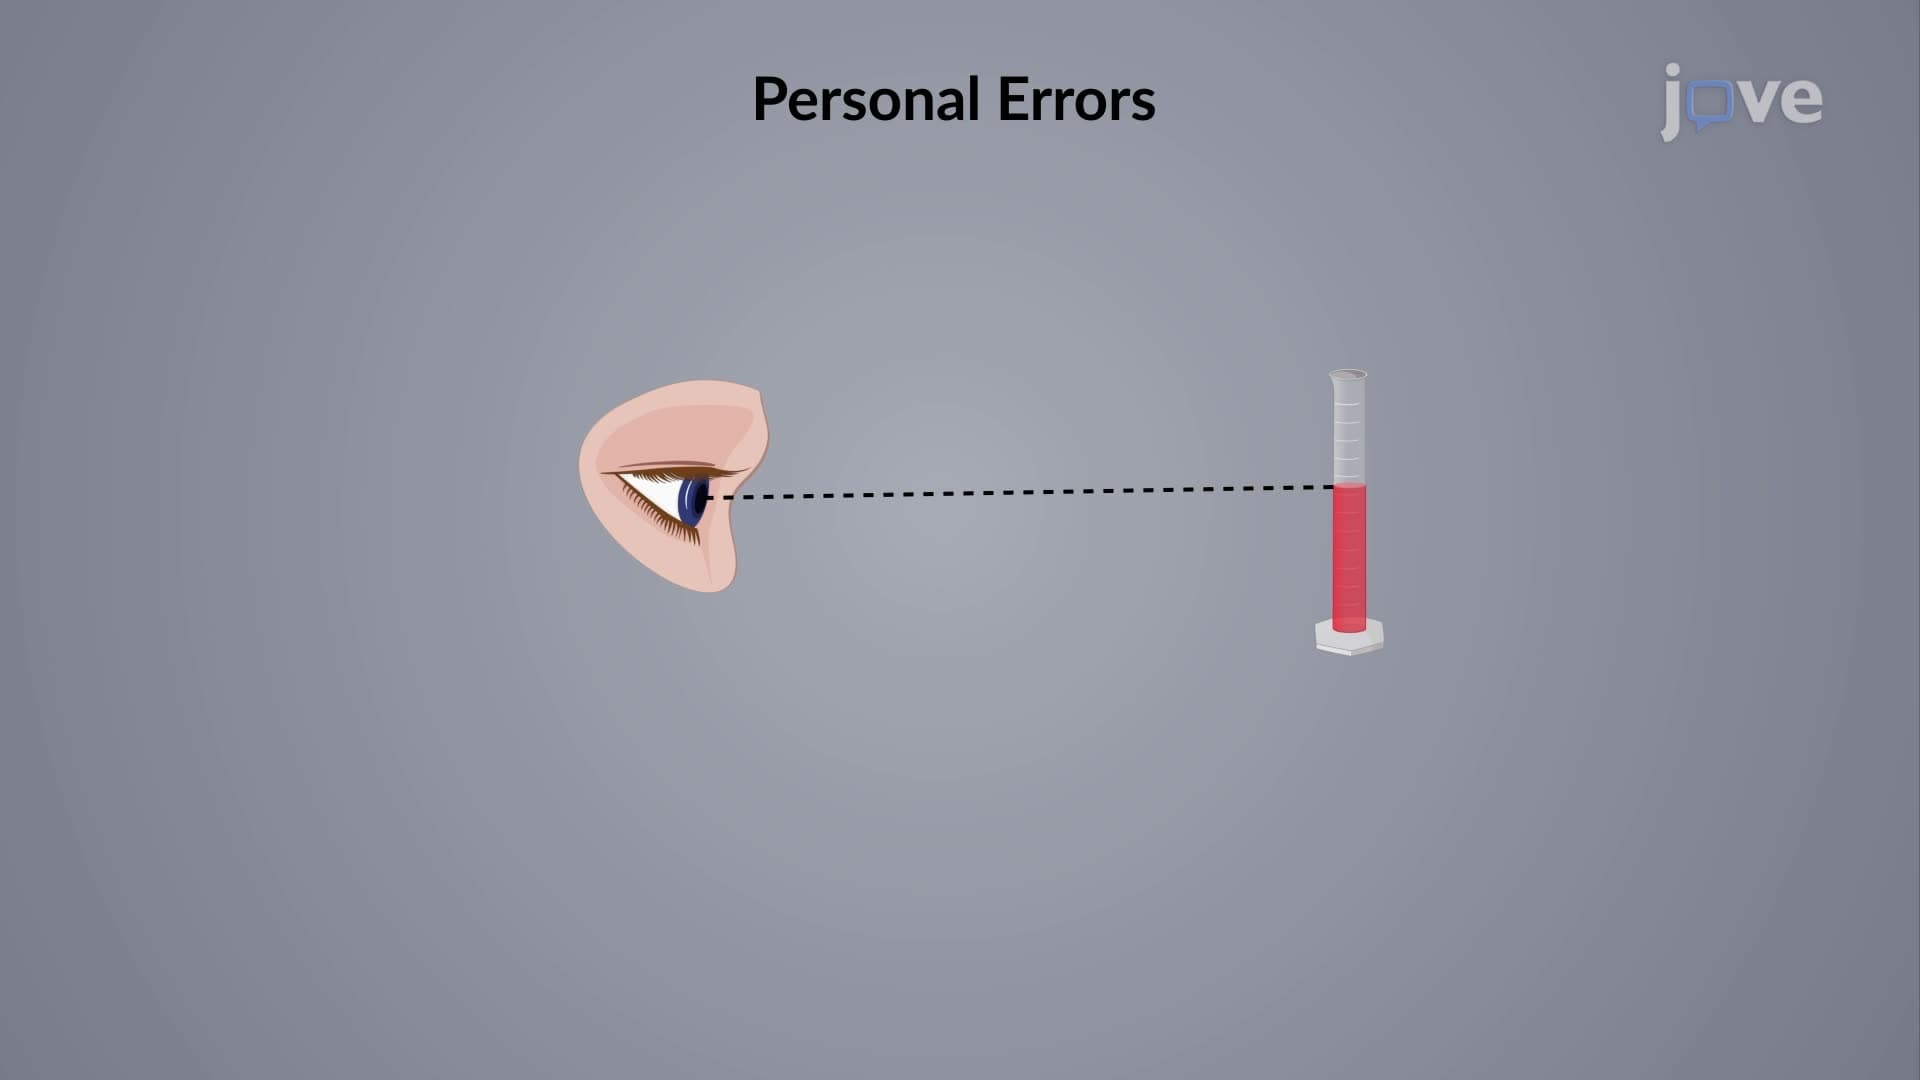
1. Error Analysis and Classification: Systematic errors arise from faulty equipment, flawed methodology, or personal bias, while random errors stem from uncontrollable variables creating scattered data around a central value. Understanding these distinctions helps chemists identify error sources and implement appropriate correction strategies. For example, a consistently miscalibrated pH meter produces systematic error, while fluctuating room temperature causes random error in reaction kinetics studies.
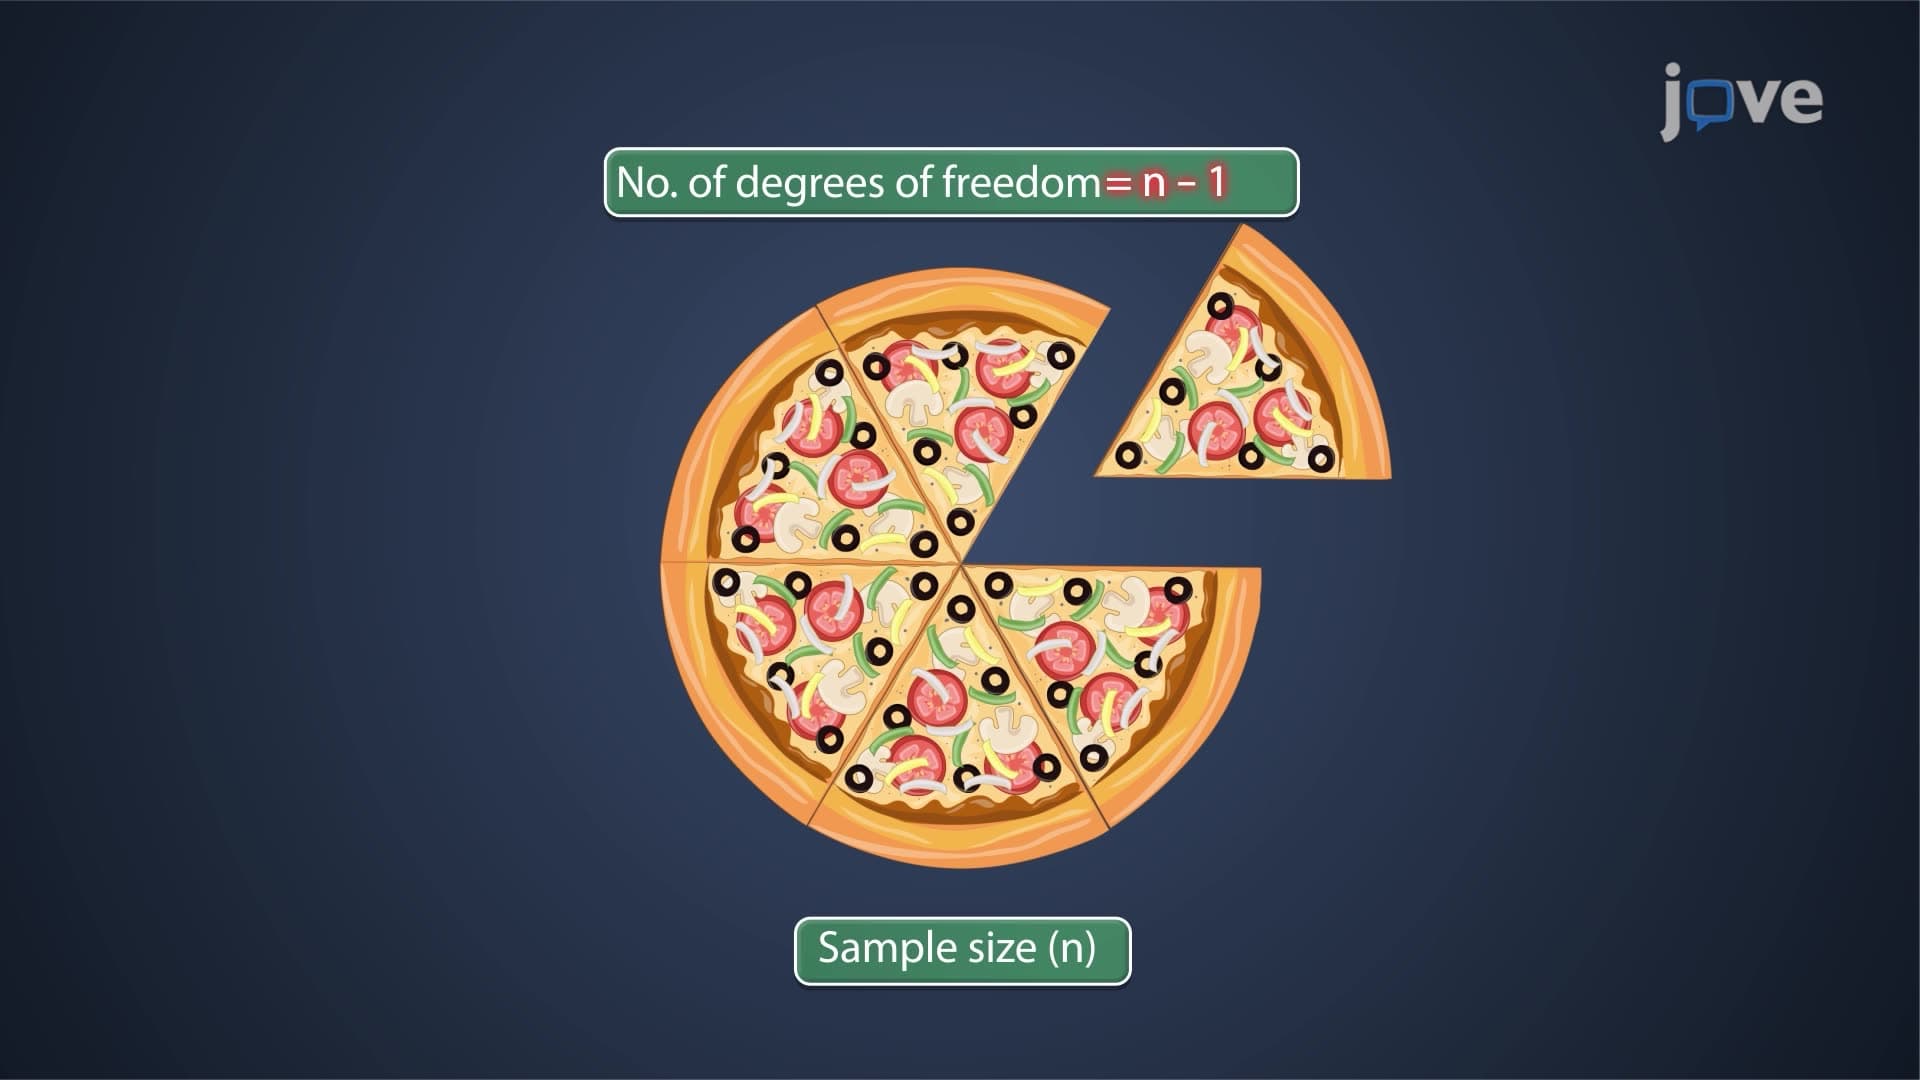
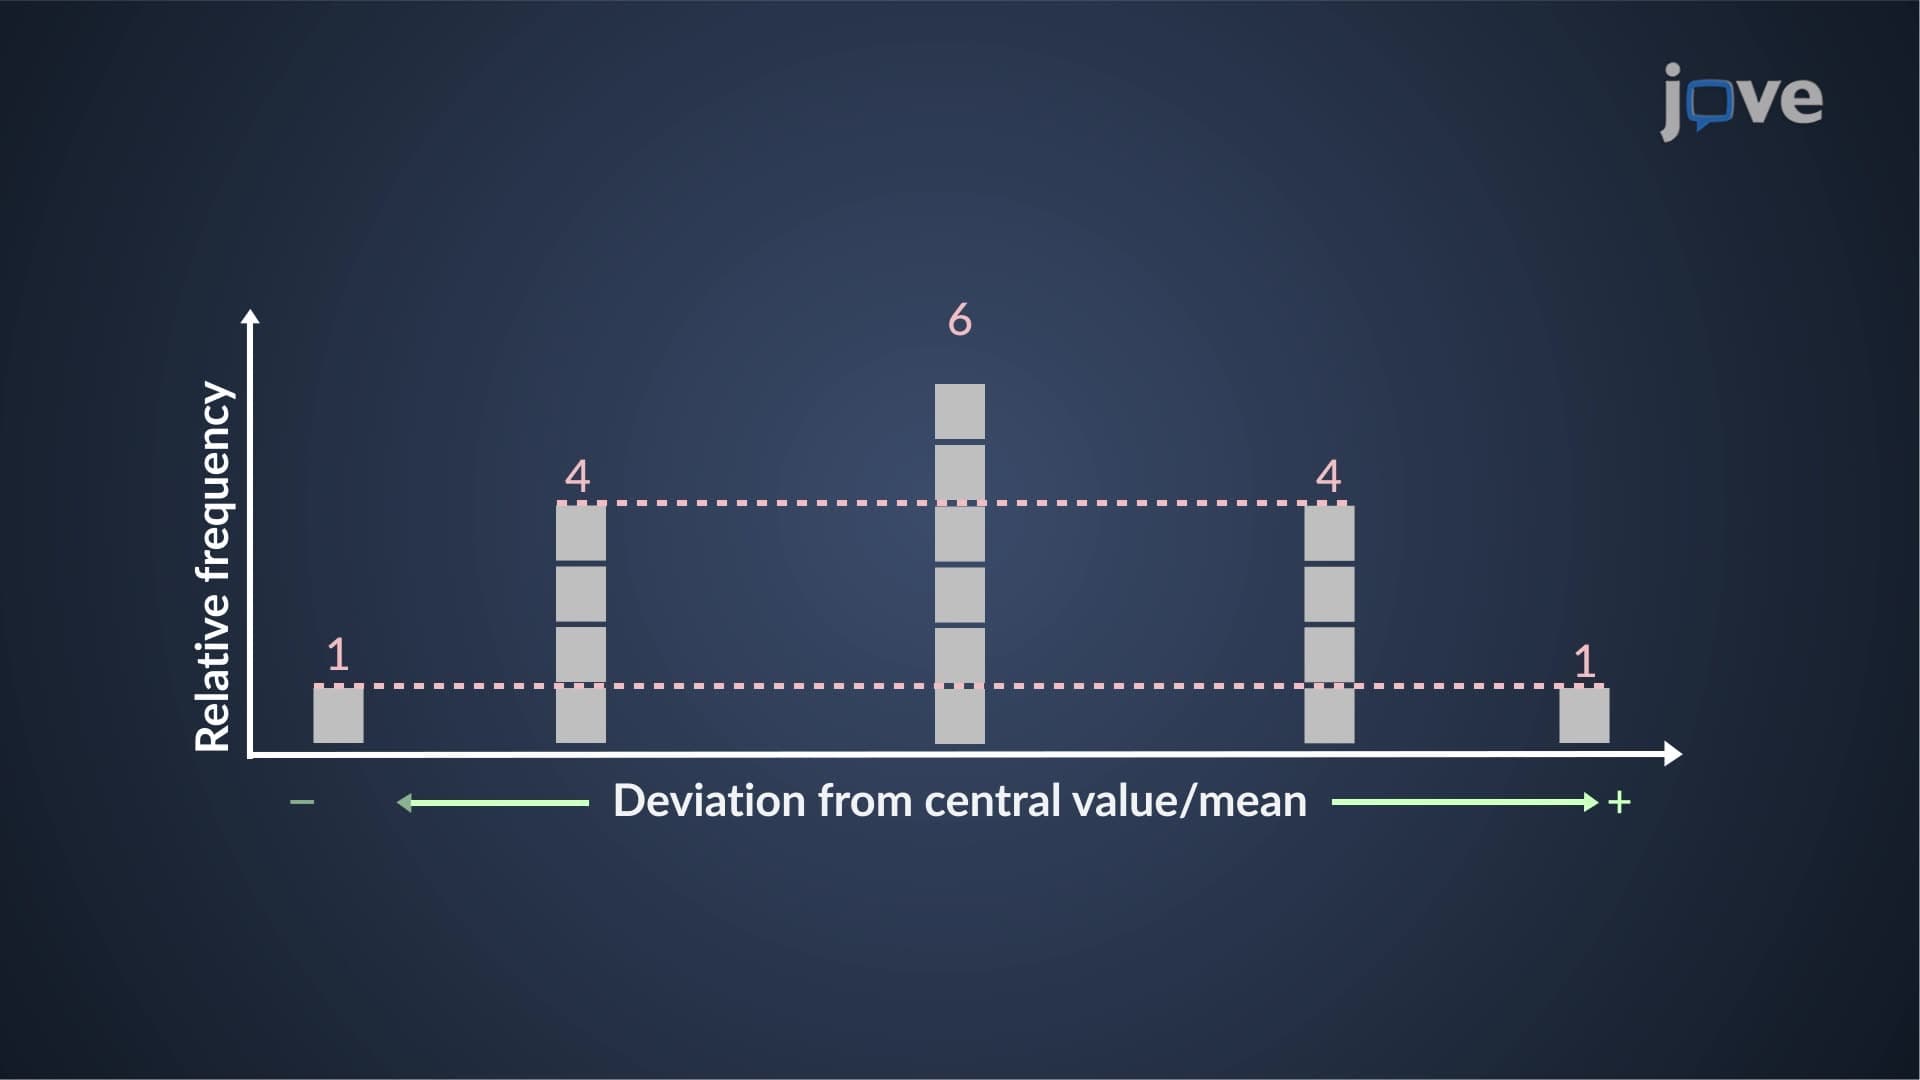
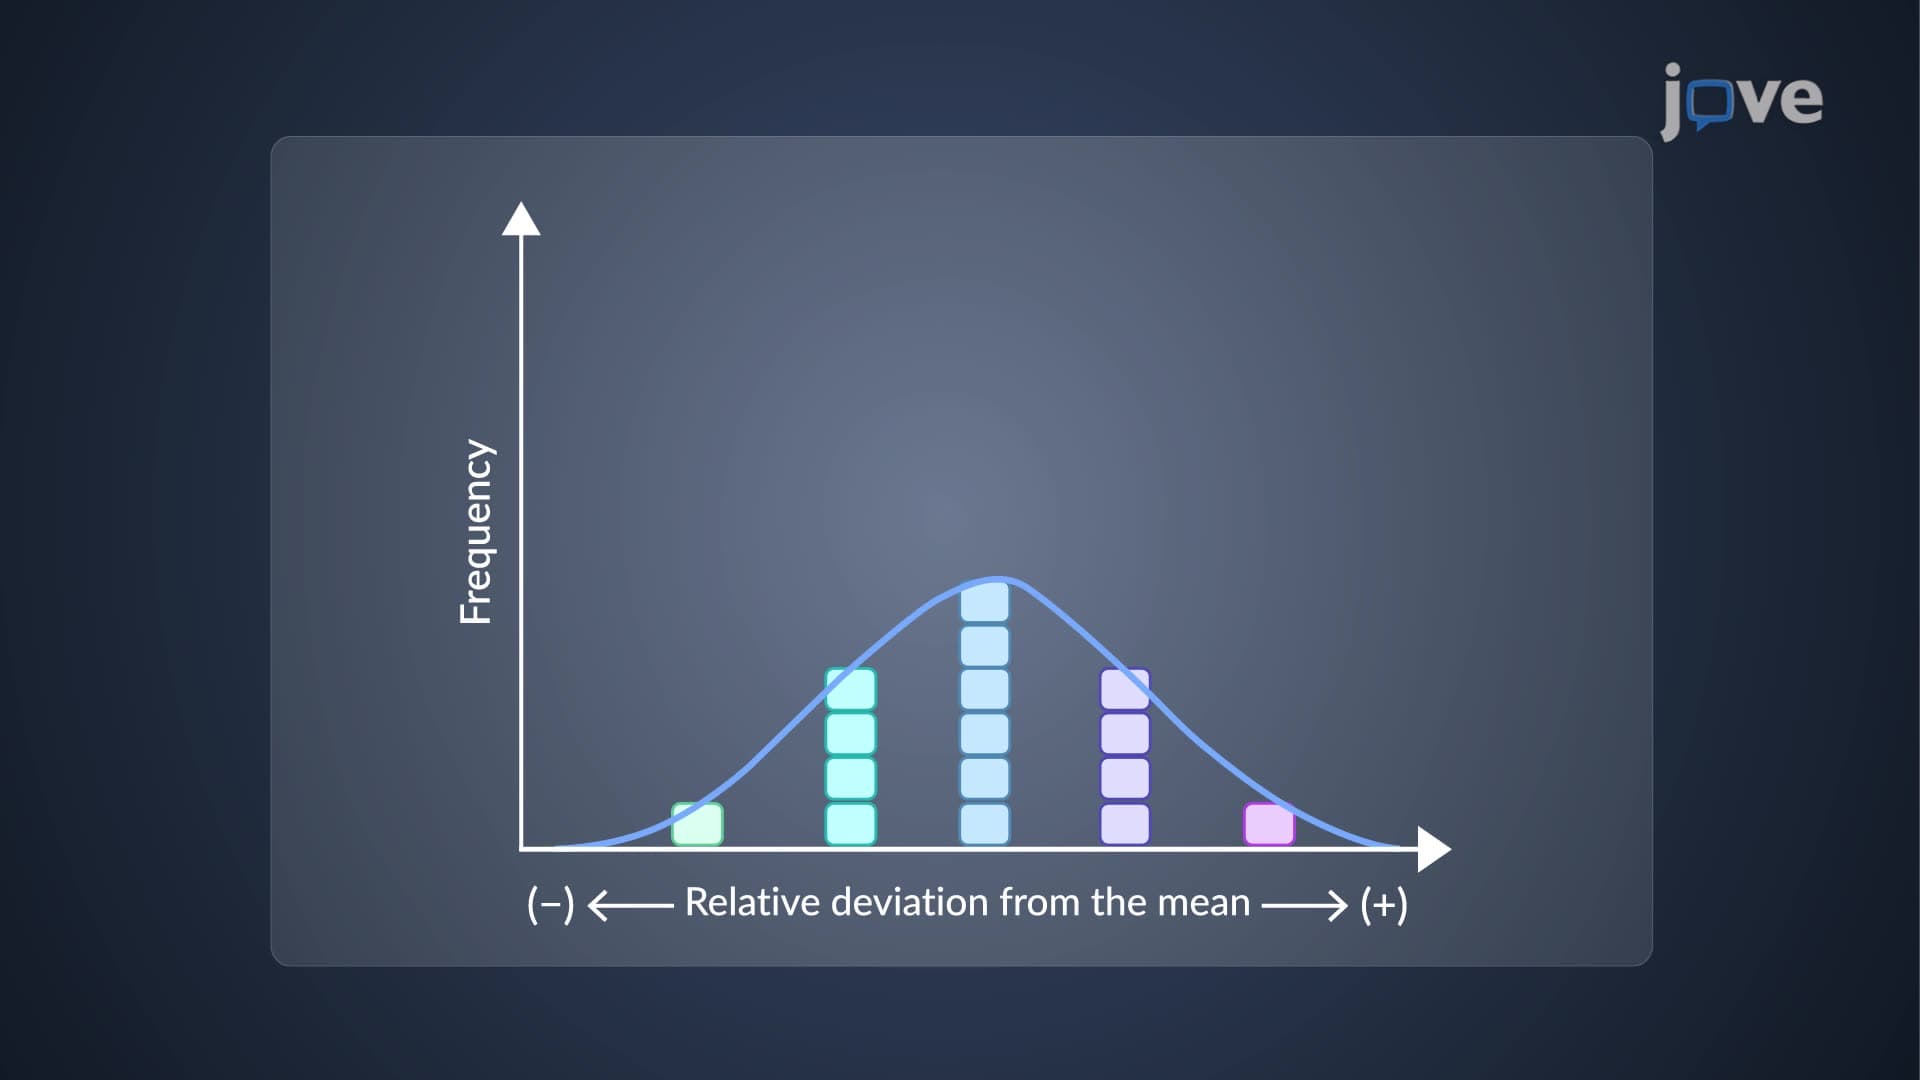
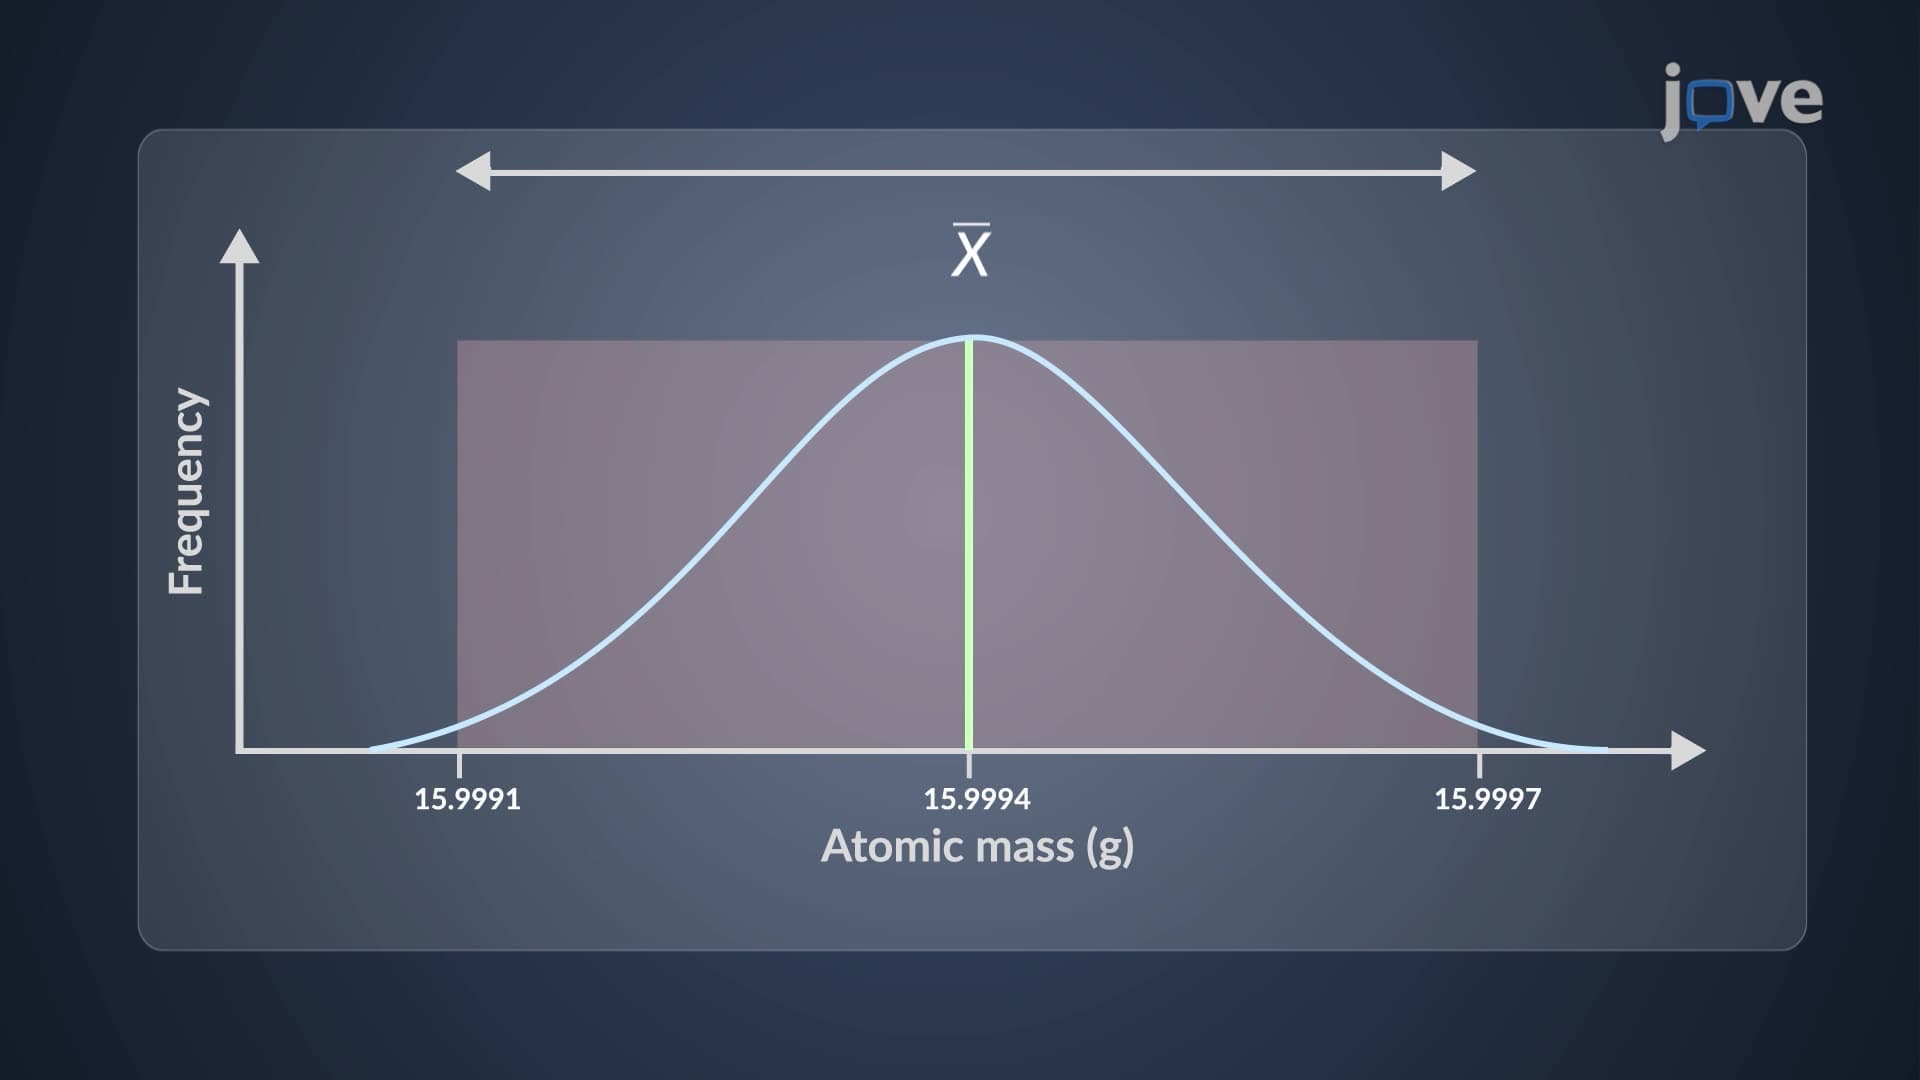
2. Statistical Measures and Distributions: Standard deviation quantifies data spread around the mean, with smaller values indicating higher precision in analytical measurements. The Gaussian distribution describes random error patterns, enabling probability calculations for analytical results. Degrees of freedom determine statistical test validity - for seven replicate titrations, six degrees of freedom exist since the last measurement depends on the others when the mean is fixed.
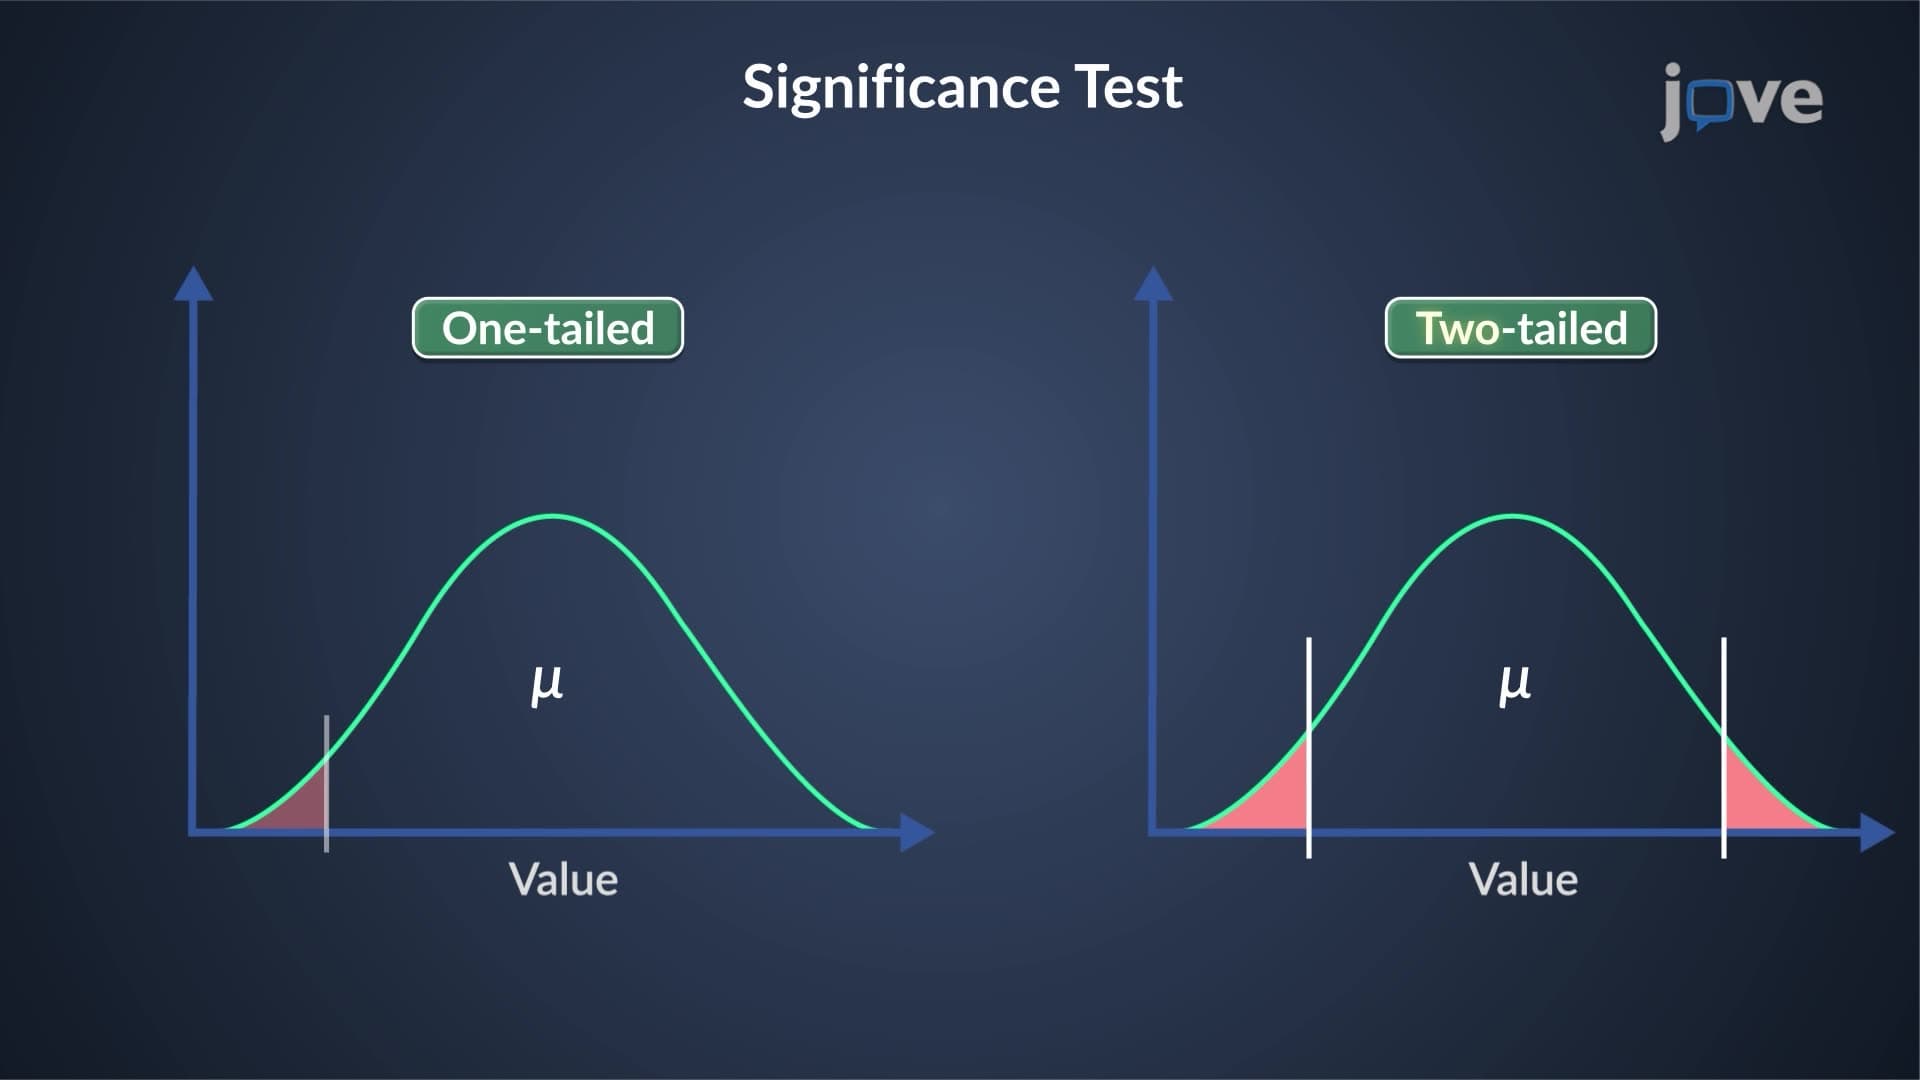
3. Hypothesis Testing with t-Tests: Student's t-test compares means between two groups to determine statistical significance, crucial for validating new analytical methods against established procedures. The test calculates whether observed differences exceed expected random variation. For instance, comparing lead concentrations measured by atomic absorption versus ICP-MS requires t-test analysis to confirm method equivalence within acceptable limits.
4. Variance Analysis with F-Tests and ANOVA: F-tests compare variances between groups to assess measurement precision consistency across different conditions or instruments. ANOVA extends this concept to simultaneously compare means among three or more groups, essential for multi-factor experiments. Quality control laboratories use these tests to verify that different analysts or instruments produce comparable results for the same samples.
5. Outlier Detection and Data Quality: Q-test and Grubbs test identify gross errors or outliers that could skew analytical results, helping maintain data integrity. These tests calculate whether suspicious values fall within expected random variation or represent true errors requiring investigation. Environmental laboratories routinely apply these methods when analyzing water samples to ensure reported contamination levels accurately reflect actual conditions.
6. Calibration and Regression Analysis: Linear least squares regression creates calibration curves relating instrument response to analyte concentration, enabling quantitative analysis of unknown samples. Correlation coefficients assess relationship strength between variables, while limits of detection define minimum measurable concentrations above background noise. Pharmaceutical companies rely on these methods for drug potency testing and impurity analysis in manufacturing quality control.
Frequently Asked Questions
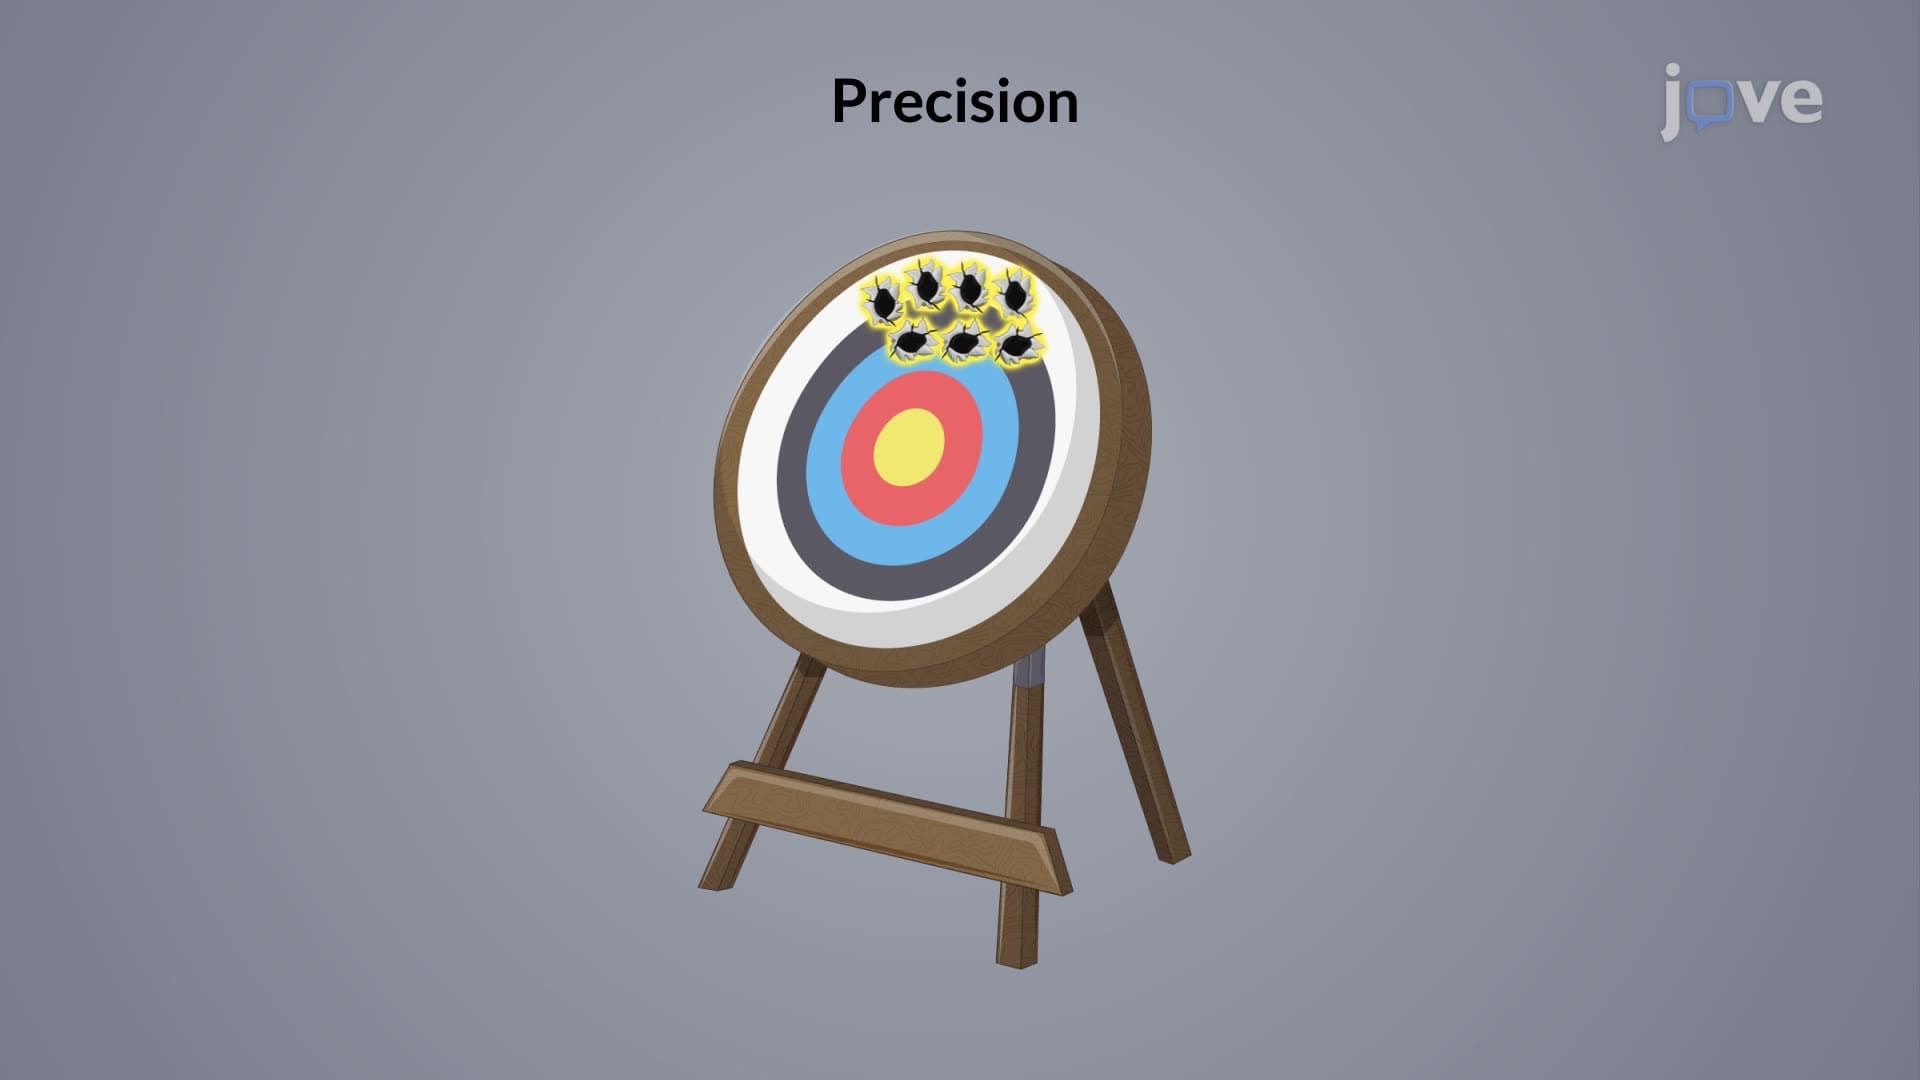
Accuracy measures how close results are to the true value, while precision indicates reproducibility among replicate measurements. You can have precise but inaccurate results (systematic error) or accurate but imprecise results (large random error). High-quality analytical work requires both.
Use t-tests when comparing means between two groups (like two analytical methods). Choose ANOVA when comparing three or more groups simultaneously (like comparing yields from multiple reaction conditions). ANOVA prevents inflation of error rates that occurs with multiple t-tests.
AP Chemistry emphasizes error analysis, significant figures, and basic statistical calculations. The MCAT includes more advanced concepts like confidence intervals and hypothesis testing in research-based passages. Both exams expect understanding of precision, accuracy, and uncertainty propagation in experimental design questions.
Pre-med students should master error analysis, understand normal distributions, and interpret statistical significance in research studies. Medical schools value students who can critically evaluate scientific literature, requiring familiarity with t-tests, correlation analysis, and confidence intervals commonly reported in chemical and biological research.
Pharmaceutical labs use t-tests for method validation, ANOVA for comparing production batches, regression analysis for drug stability studies, and outlier tests for quality control. FDA regulations require statistical validation of analytical methods, making these skills essential for careers in pharmaceutical quality assurance and research.
Students often struggle with uncertainty propagation calculations, interpreting confidence intervals, and choosing appropriate statistical tests. The mathematical complexity can overshadow the chemical applications. Focus on understanding when and why to apply each method rather than memorizing formulas.
Start with real experimental data from your lab work rather than abstract examples. Practice identifying error types in actual measurements, then progress to statistical tests. Use spreadsheet software or statistical calculators to handle computations while focusing on interpreting results and drawing chemical conclusions from statistical analyses.
This microcourse includes 22 concept videos that walk you through the building blocks of Analytical Chemistry. Each video is short, about 1 minute, so you can cover a full topic during a coffee break or between classes. The full sequence starts with SI Units: 2019 Redefinition and ends with What is ANOVA?.