Loading subject page…


104,969 views

Video Summary: What Is Random Error
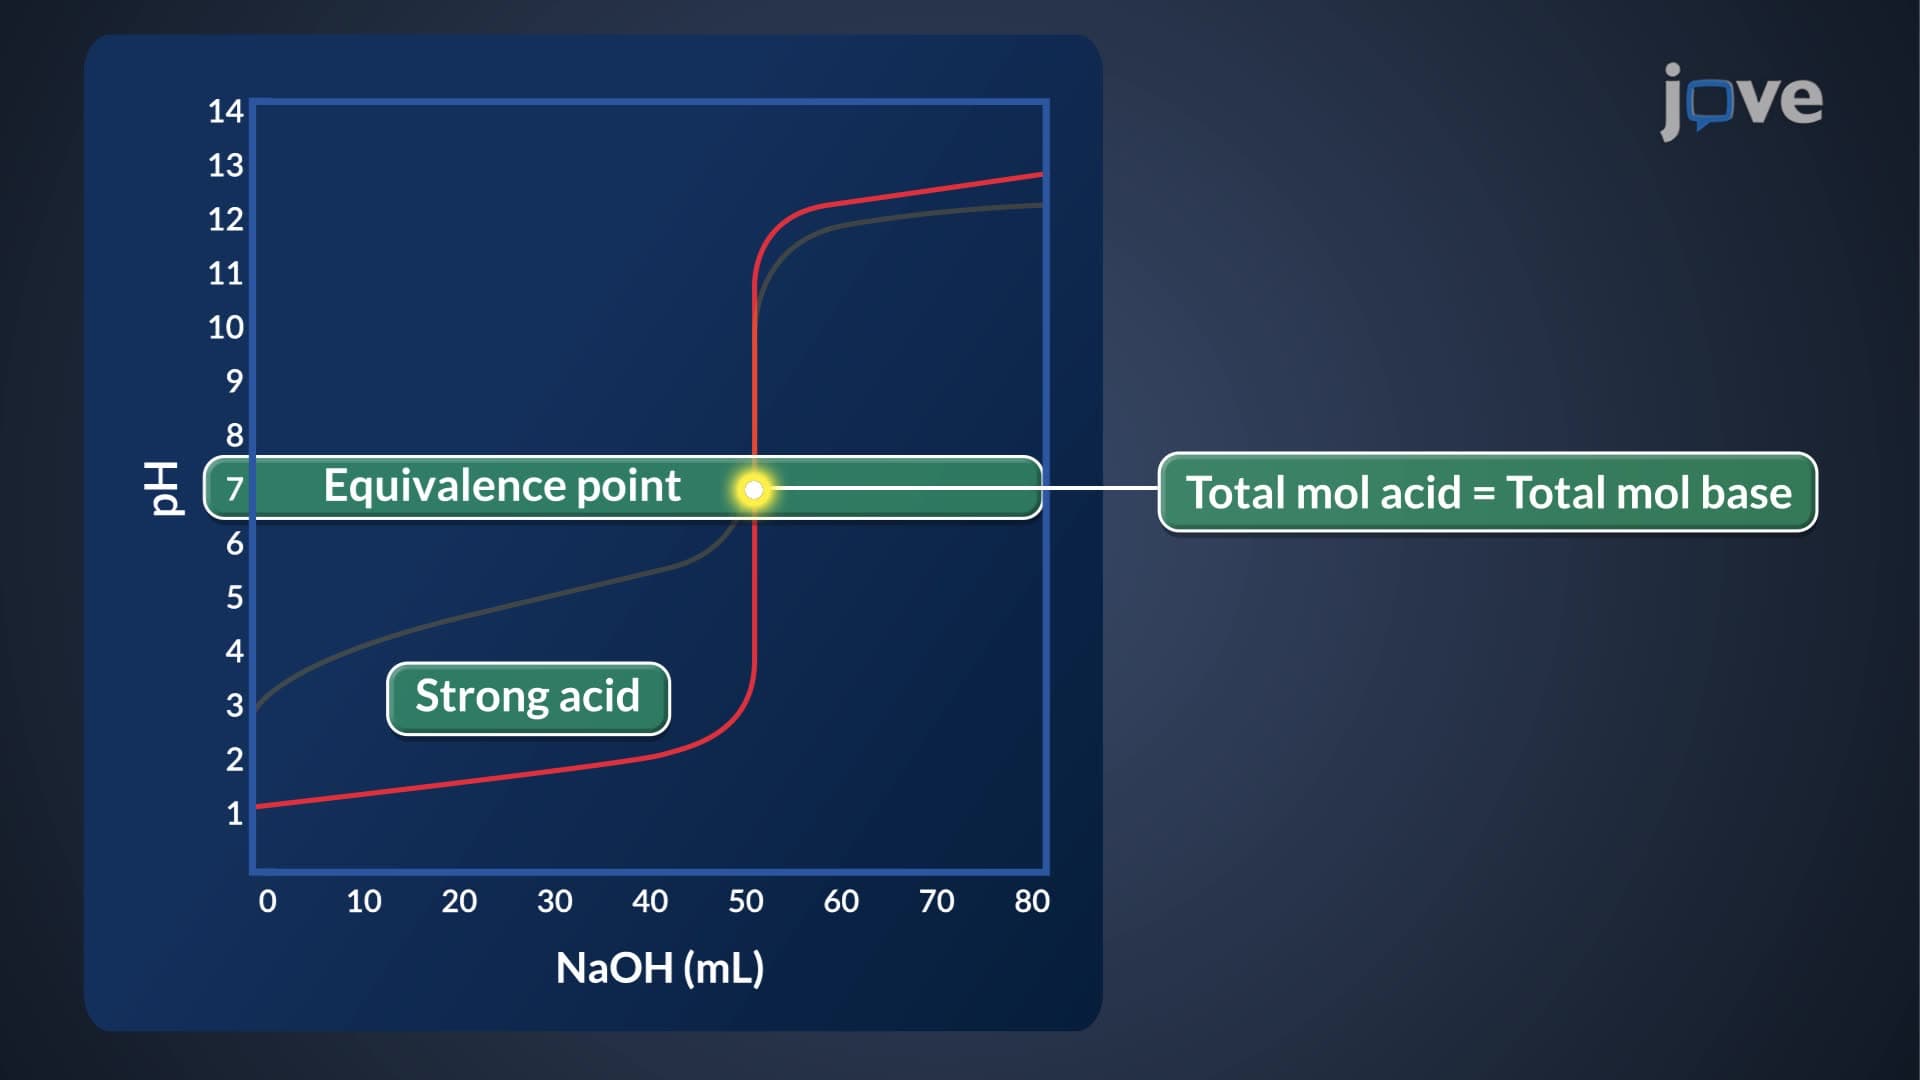
Ever wonder why your lab partner gets slightly different measurements even when using identical equipment? Random error definition encompasses unpredictable variations that occur during repeated measurements, making each result slightly different despite following the same procedure. Unlike systematic errors that consistently skew results in one direction, random errors fluctuate unpredictably in both positive and negative directions. In US chemistry labs, students often observe this when measuring pH levels or titration endpoints. Watch the full video on JoVE Coach to master this concept with expert-led visuals and step-by-step explanations.
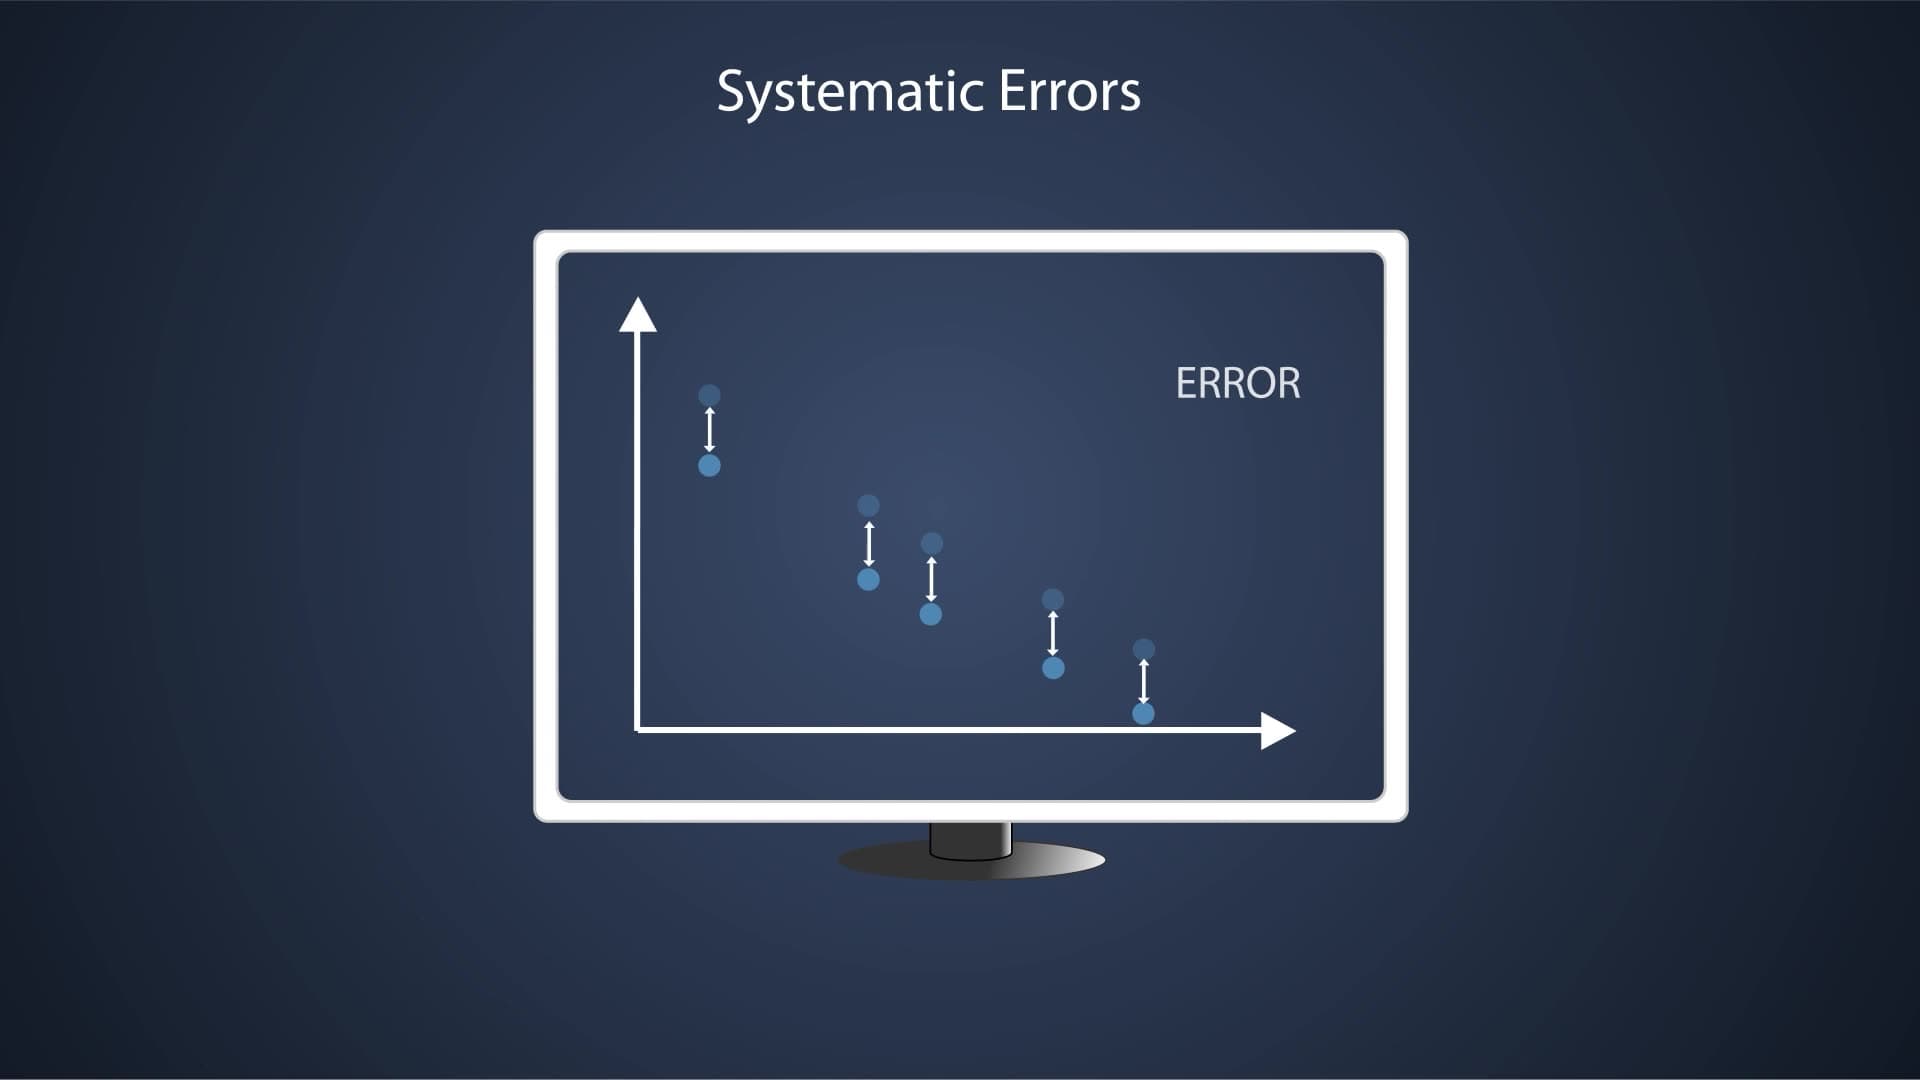
Random error represents the unpredictable variations that occur during measurements, creating scatter around the true value without any consistent pattern. Unlike systematic errors that consistently bias results in one direction, random errors fluctuate both above and below the actual value with equal probability. This unpredictability makes random errors impossible to eliminate completely, though their effects can be minimized through proper statistical treatment.
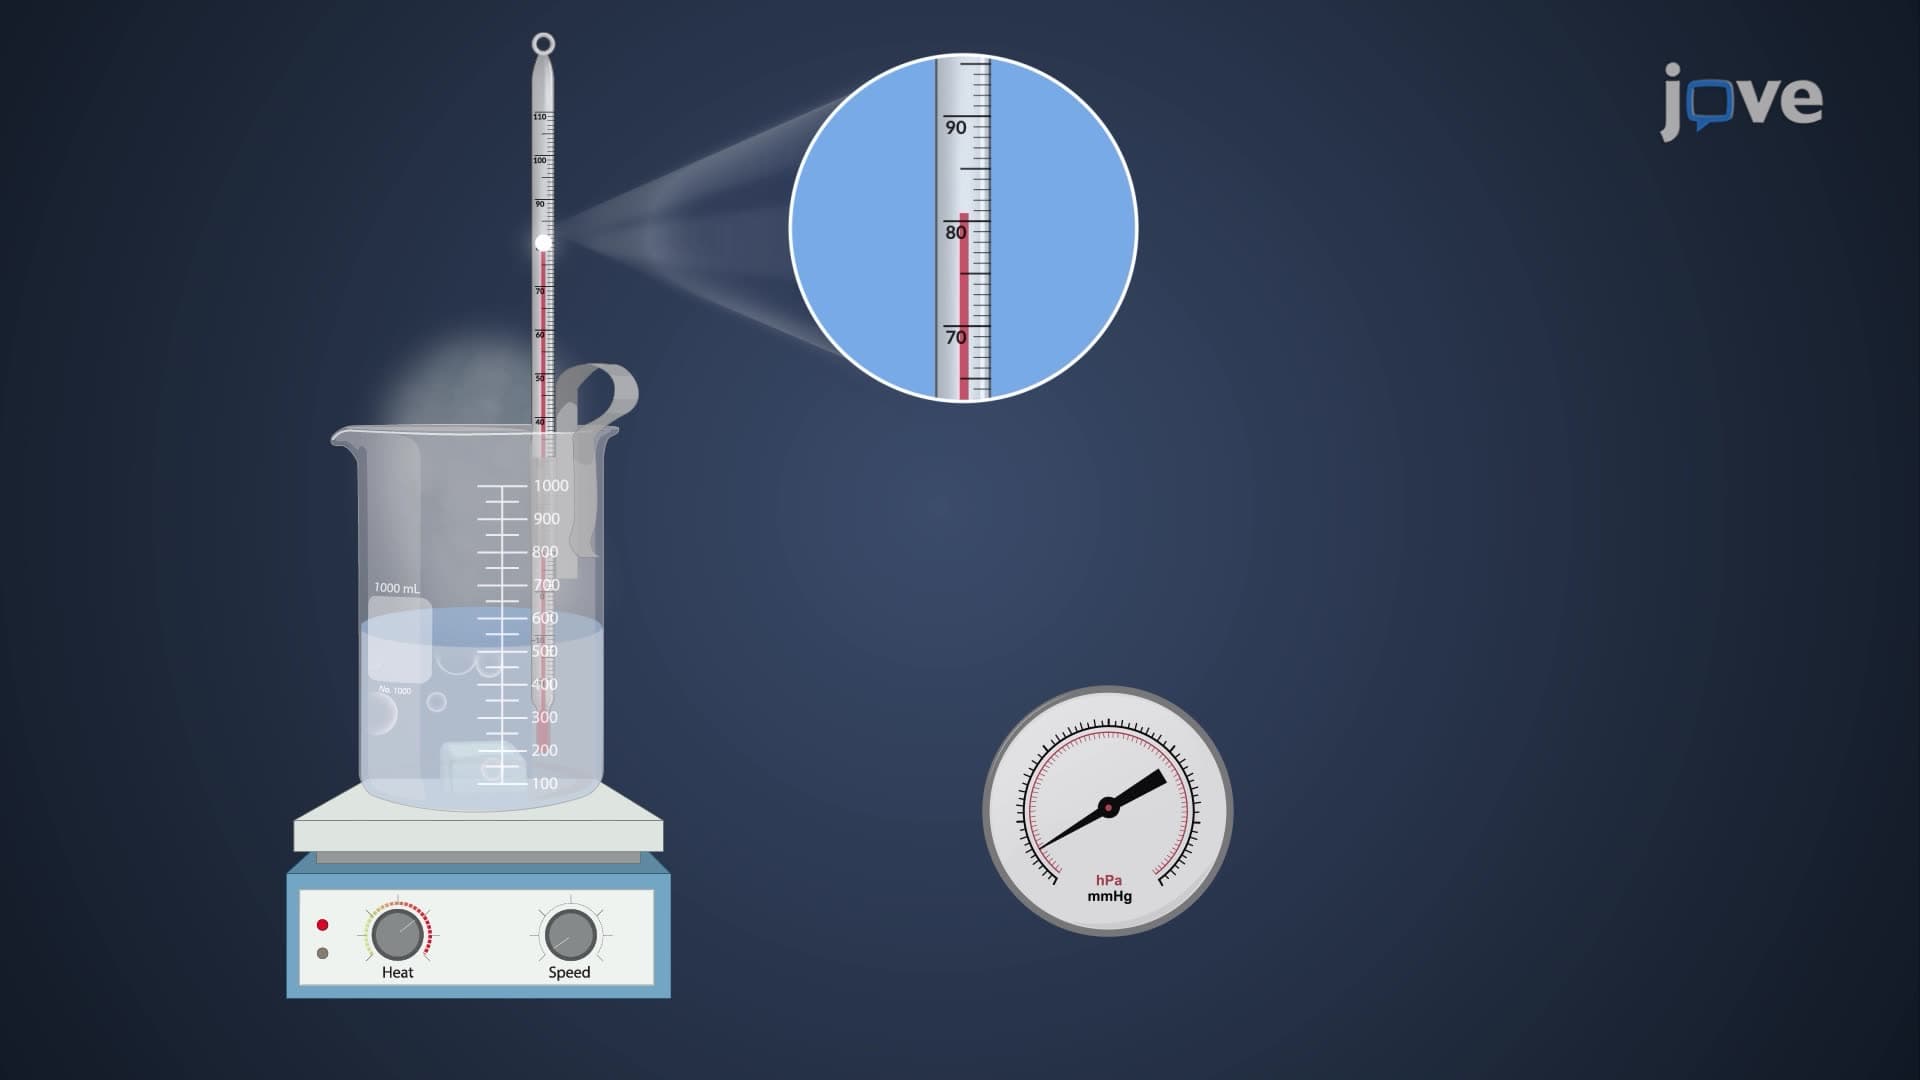
Random error in measurements stems from numerous uncontrollable variables that affect experimental conditions. Common causes of random error in lab environments include electrical noise in digital instruments, slight temperature fluctuations, vibrations from nearby equipment, and minor variations in technique between measurements. For example, when US students measure the mass of a chemical sample using an analytical balance, air currents, static electricity, and microscopic vibrations can cause readings to vary by milligrams even when measuring the same sample repeatedly.
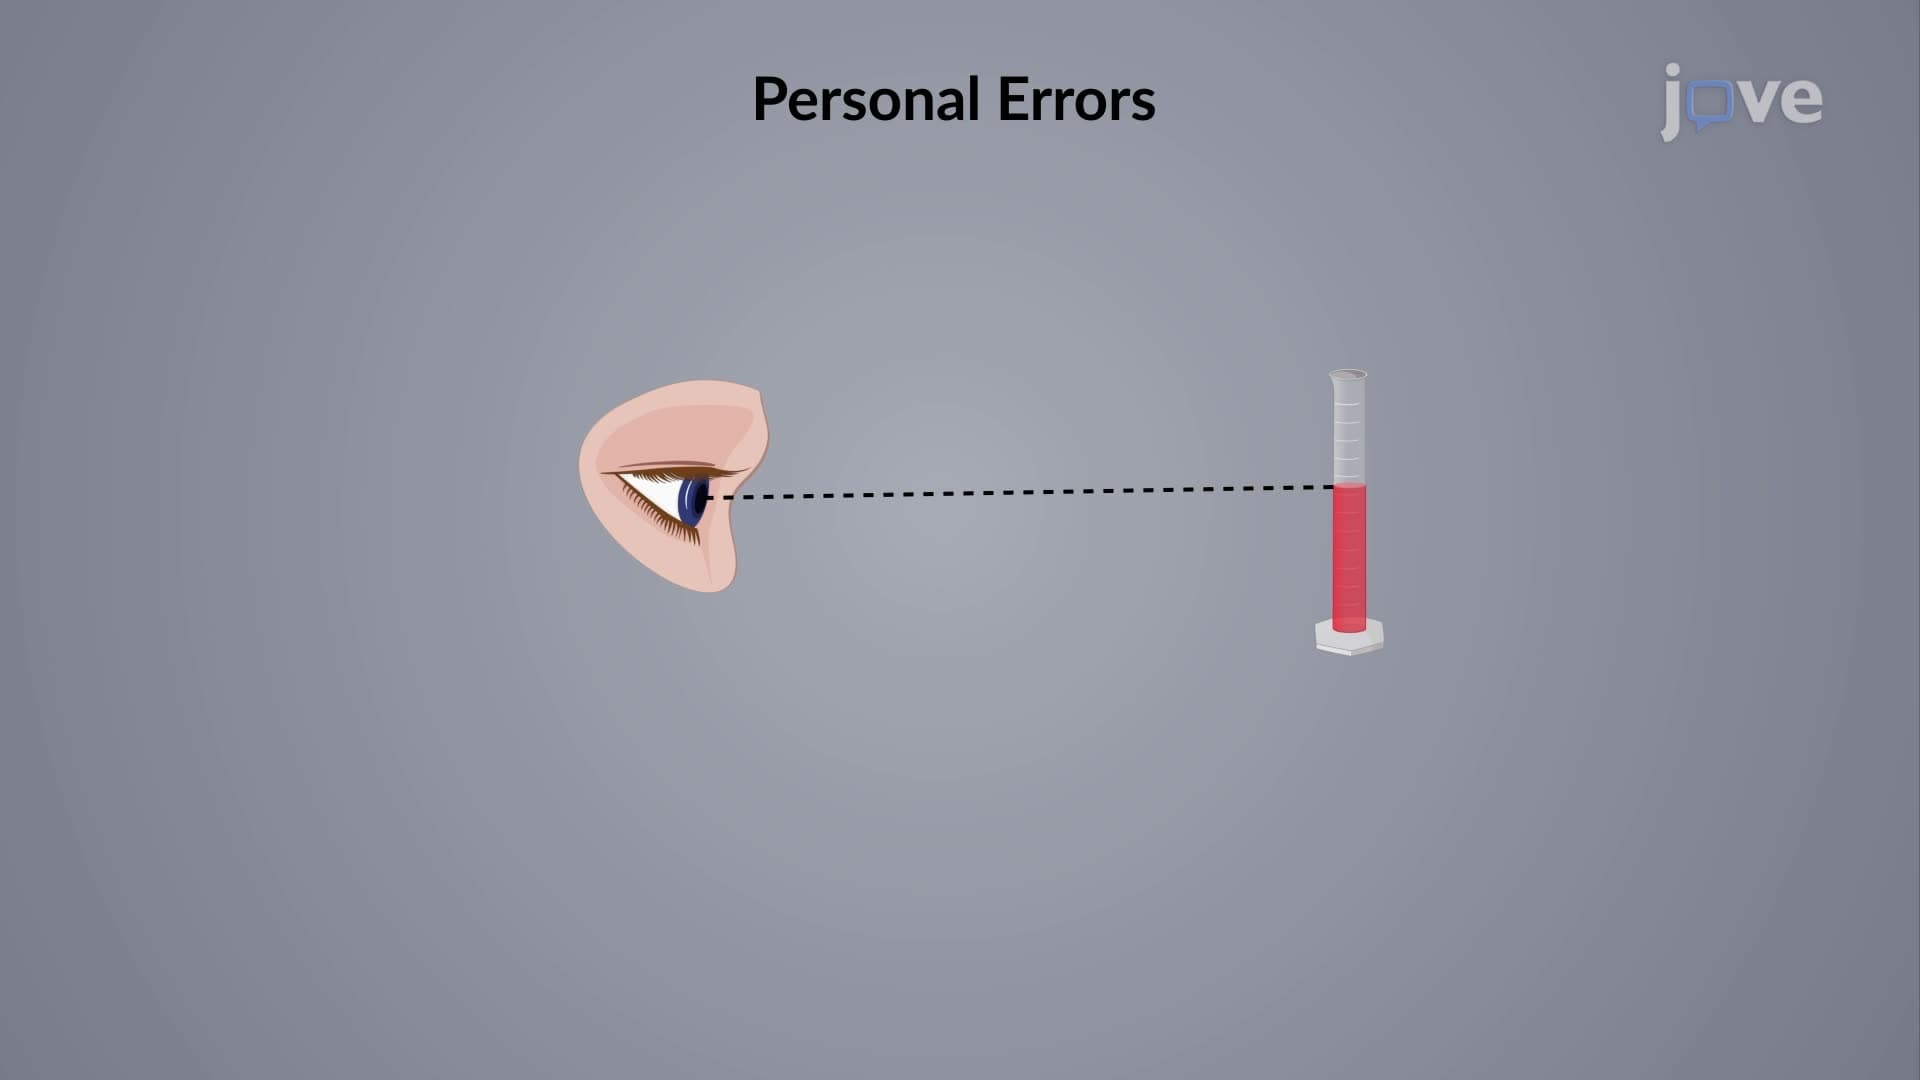
Environmental factors contribute significantly to random error. Room temperature changes affect instrument sensitivity, humidity influences electrostatic buildup, and atmospheric pressure variations can impact gas-phase measurements. Human factors also introduce randomness-slight differences in reading analog scales, timing variations in manual procedures, and minor changes in sample handling technique all contribute to measurement scatter.
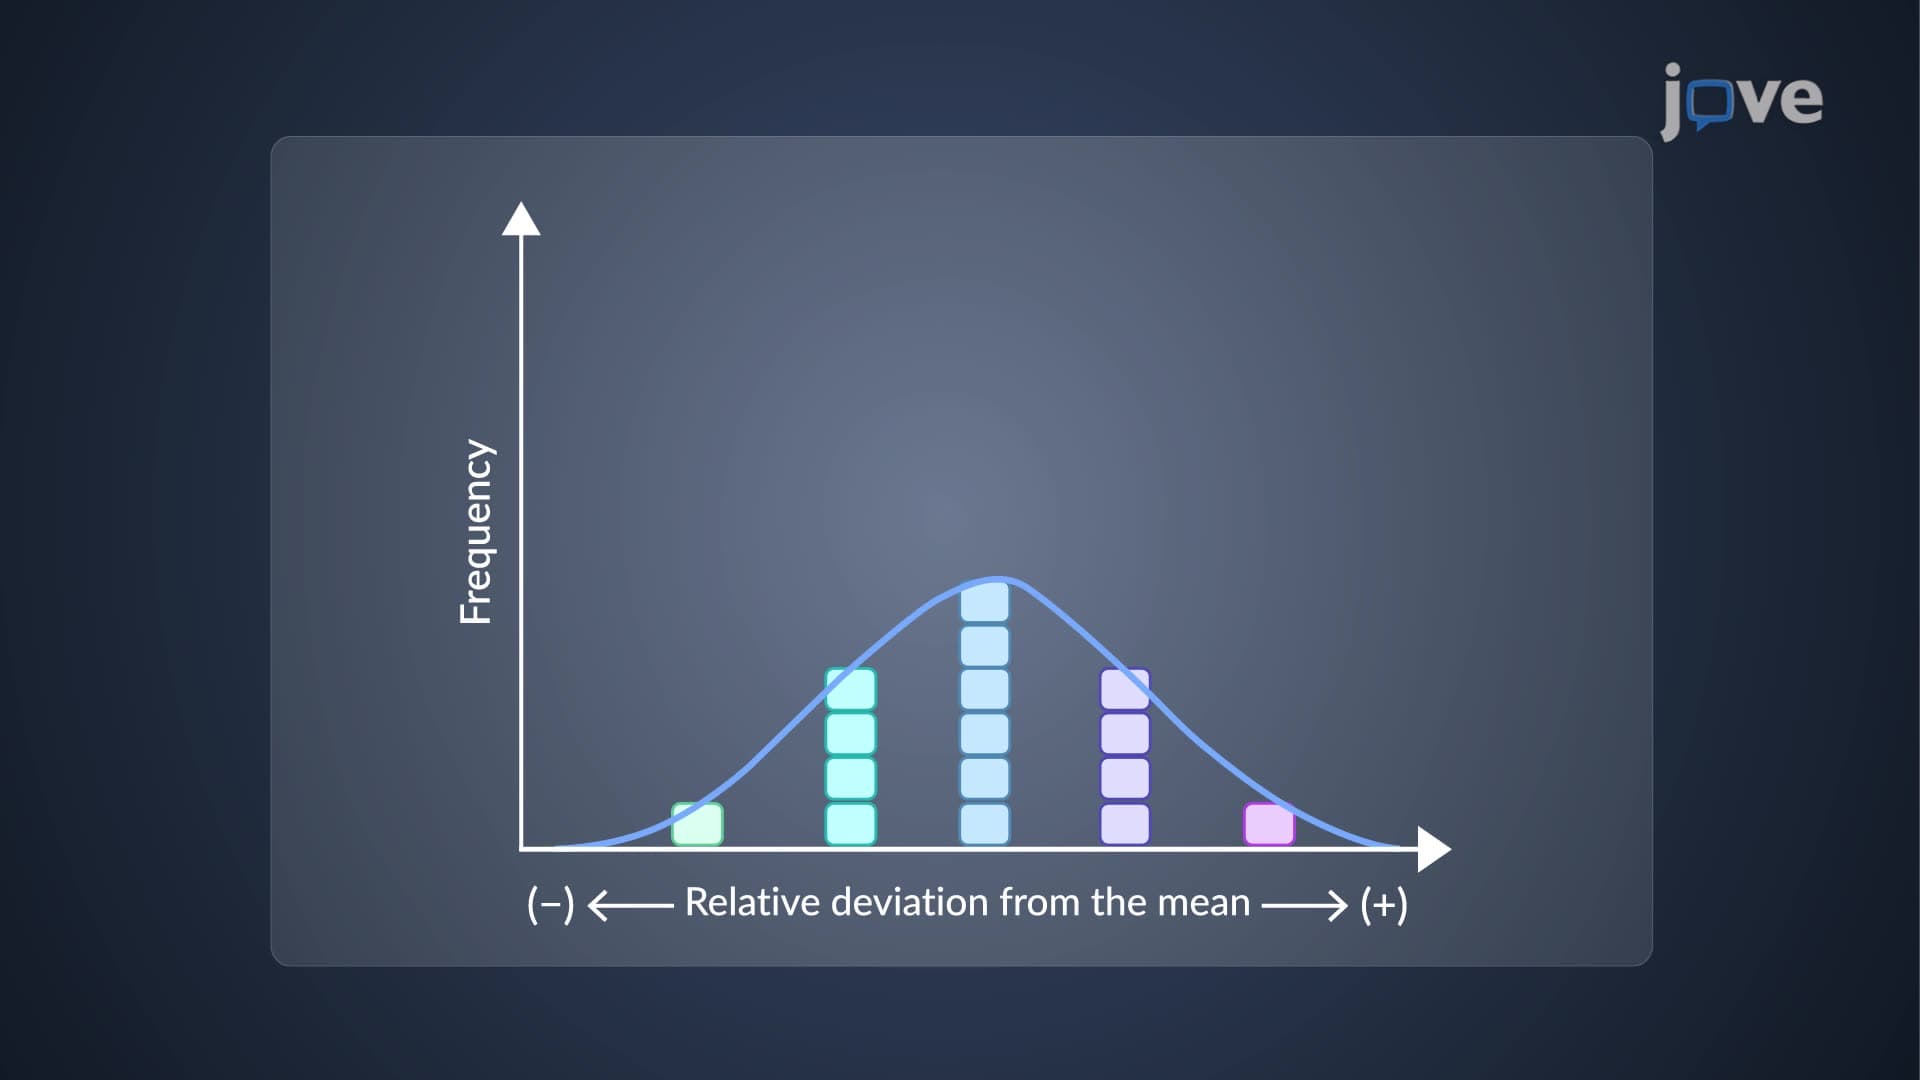
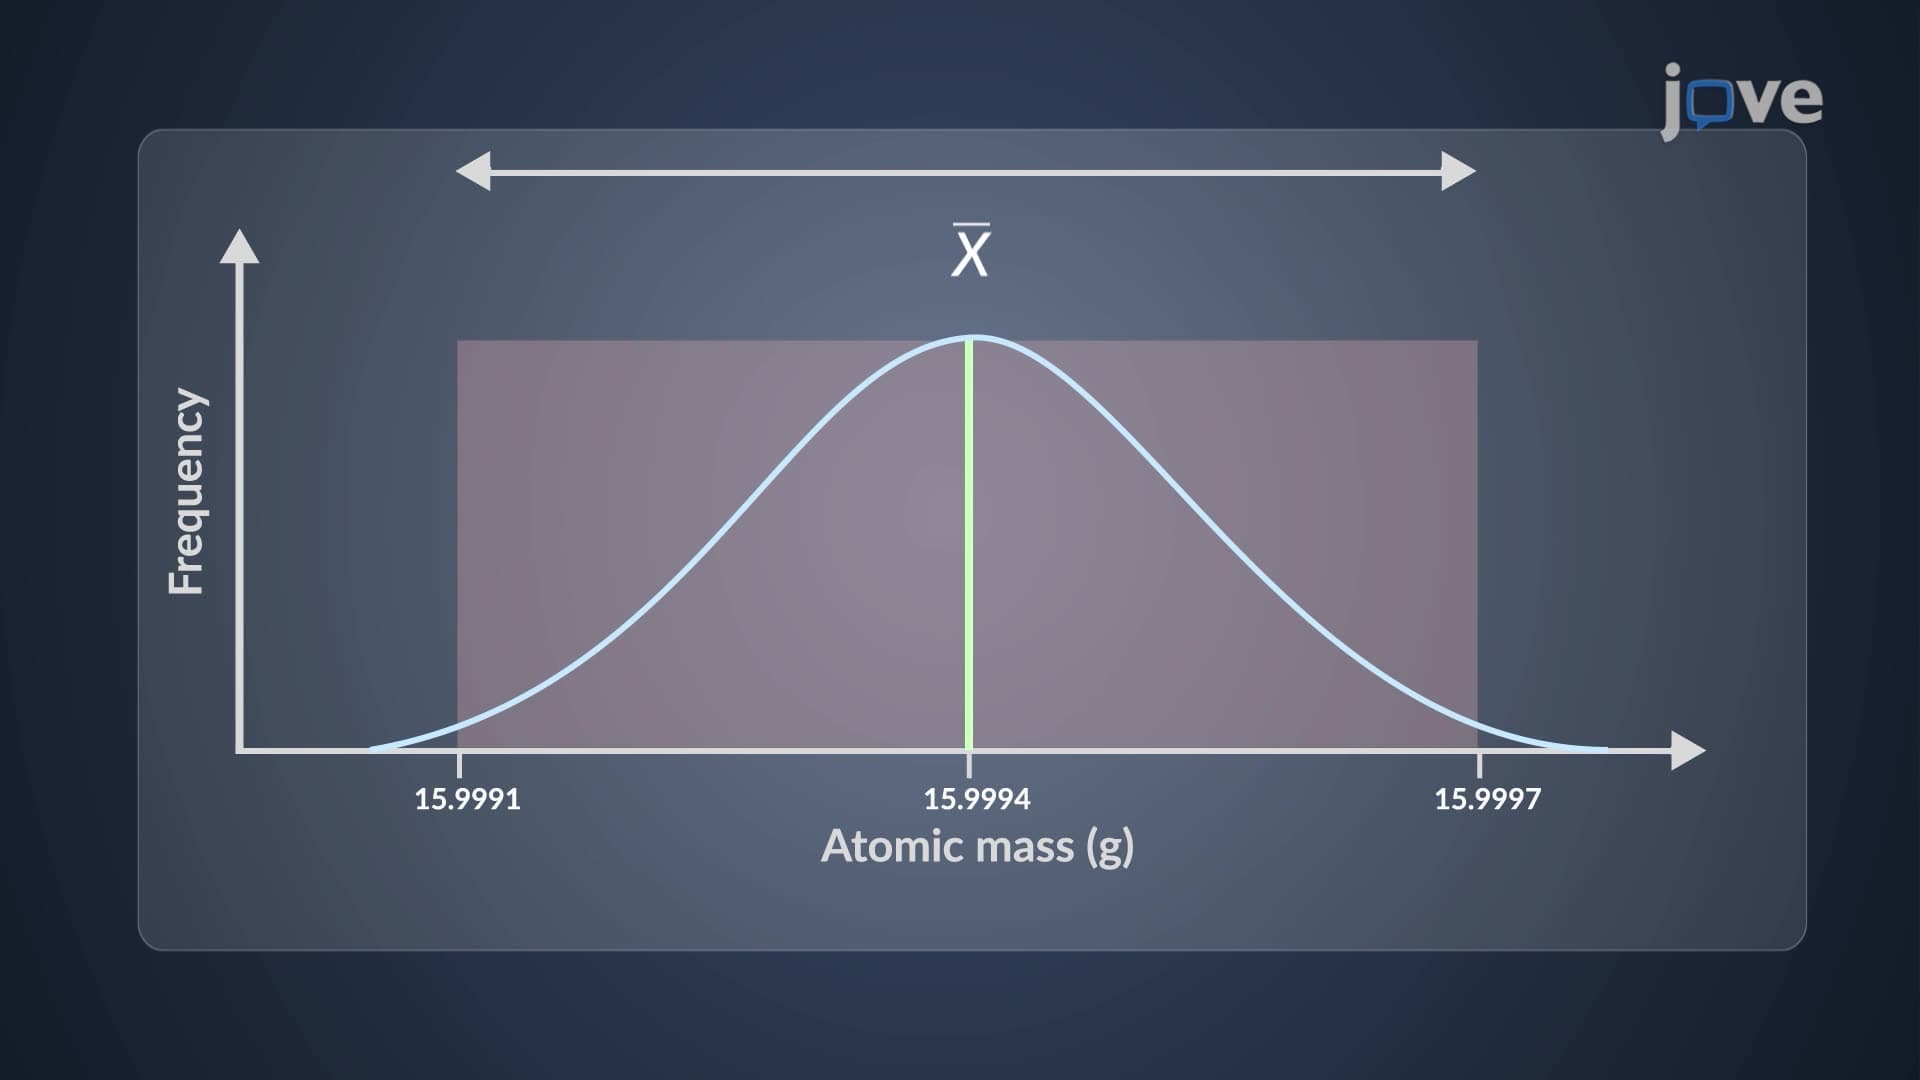
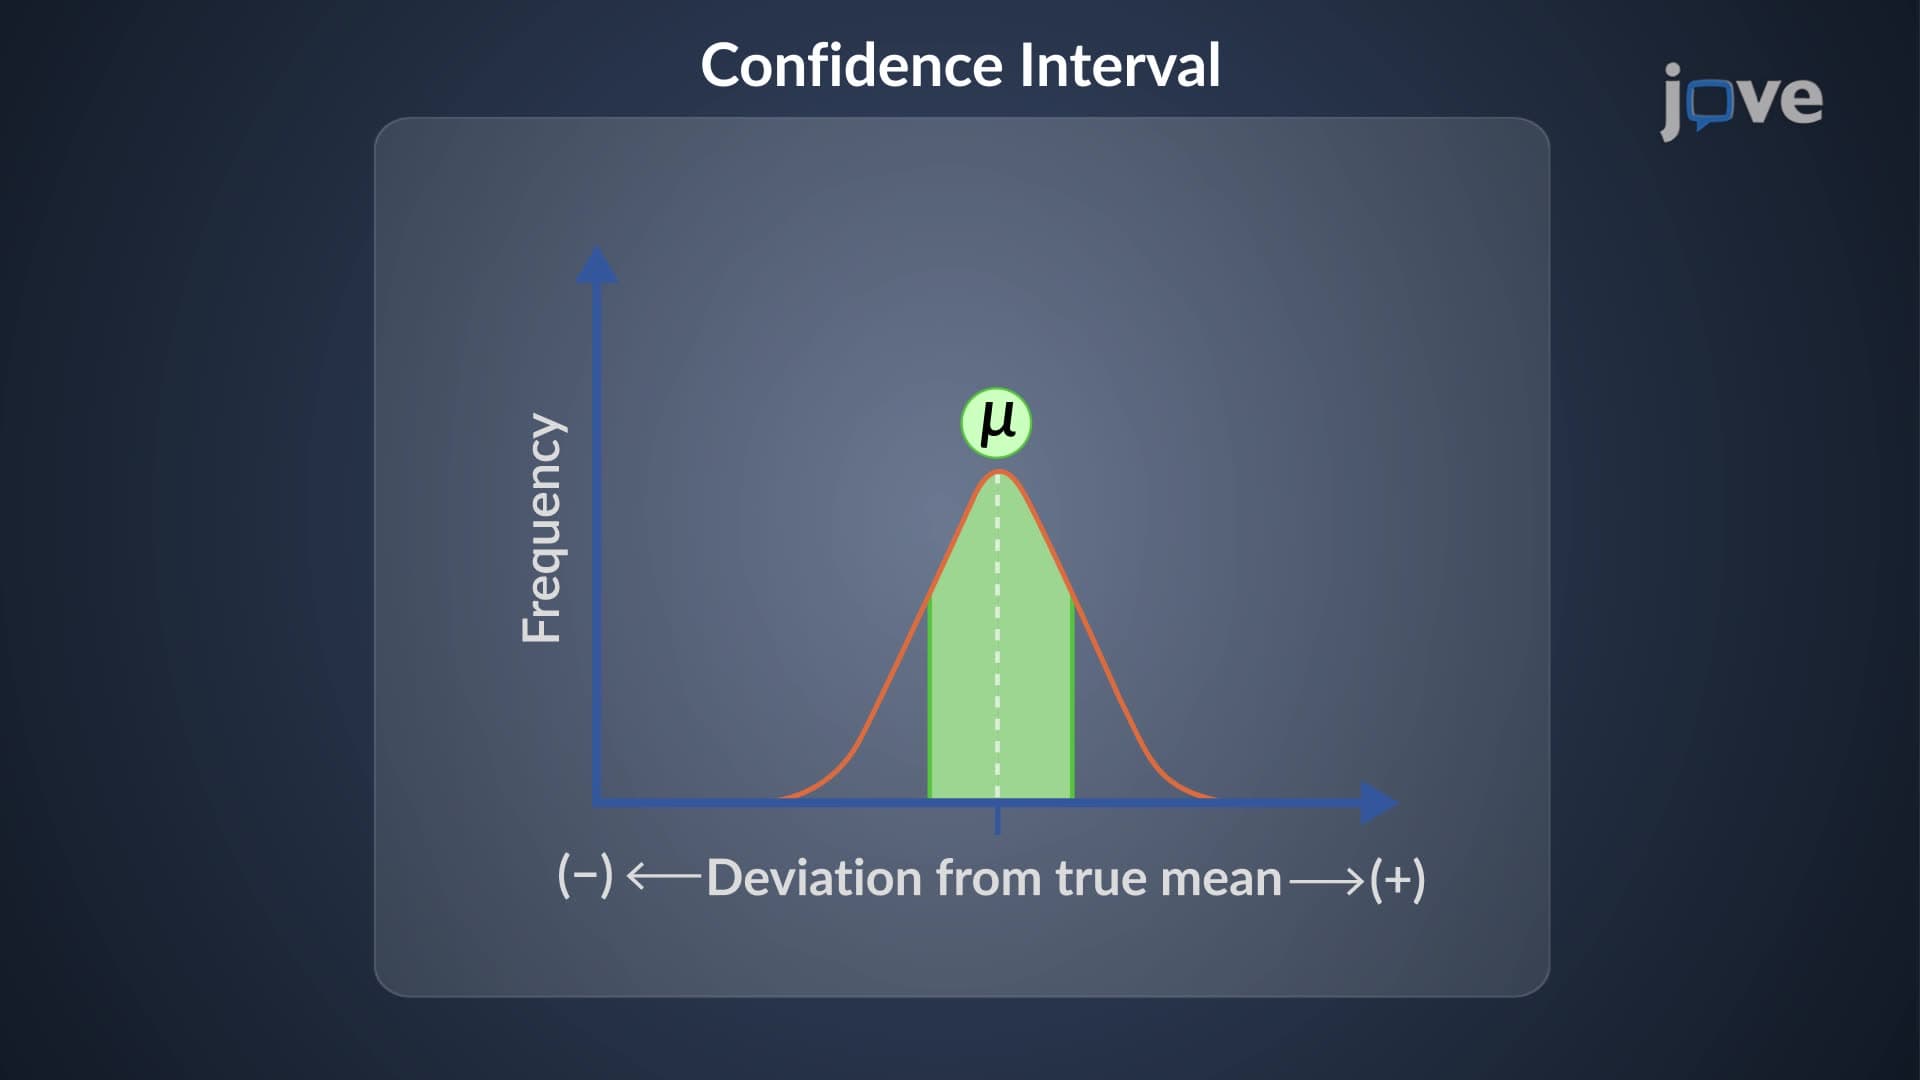
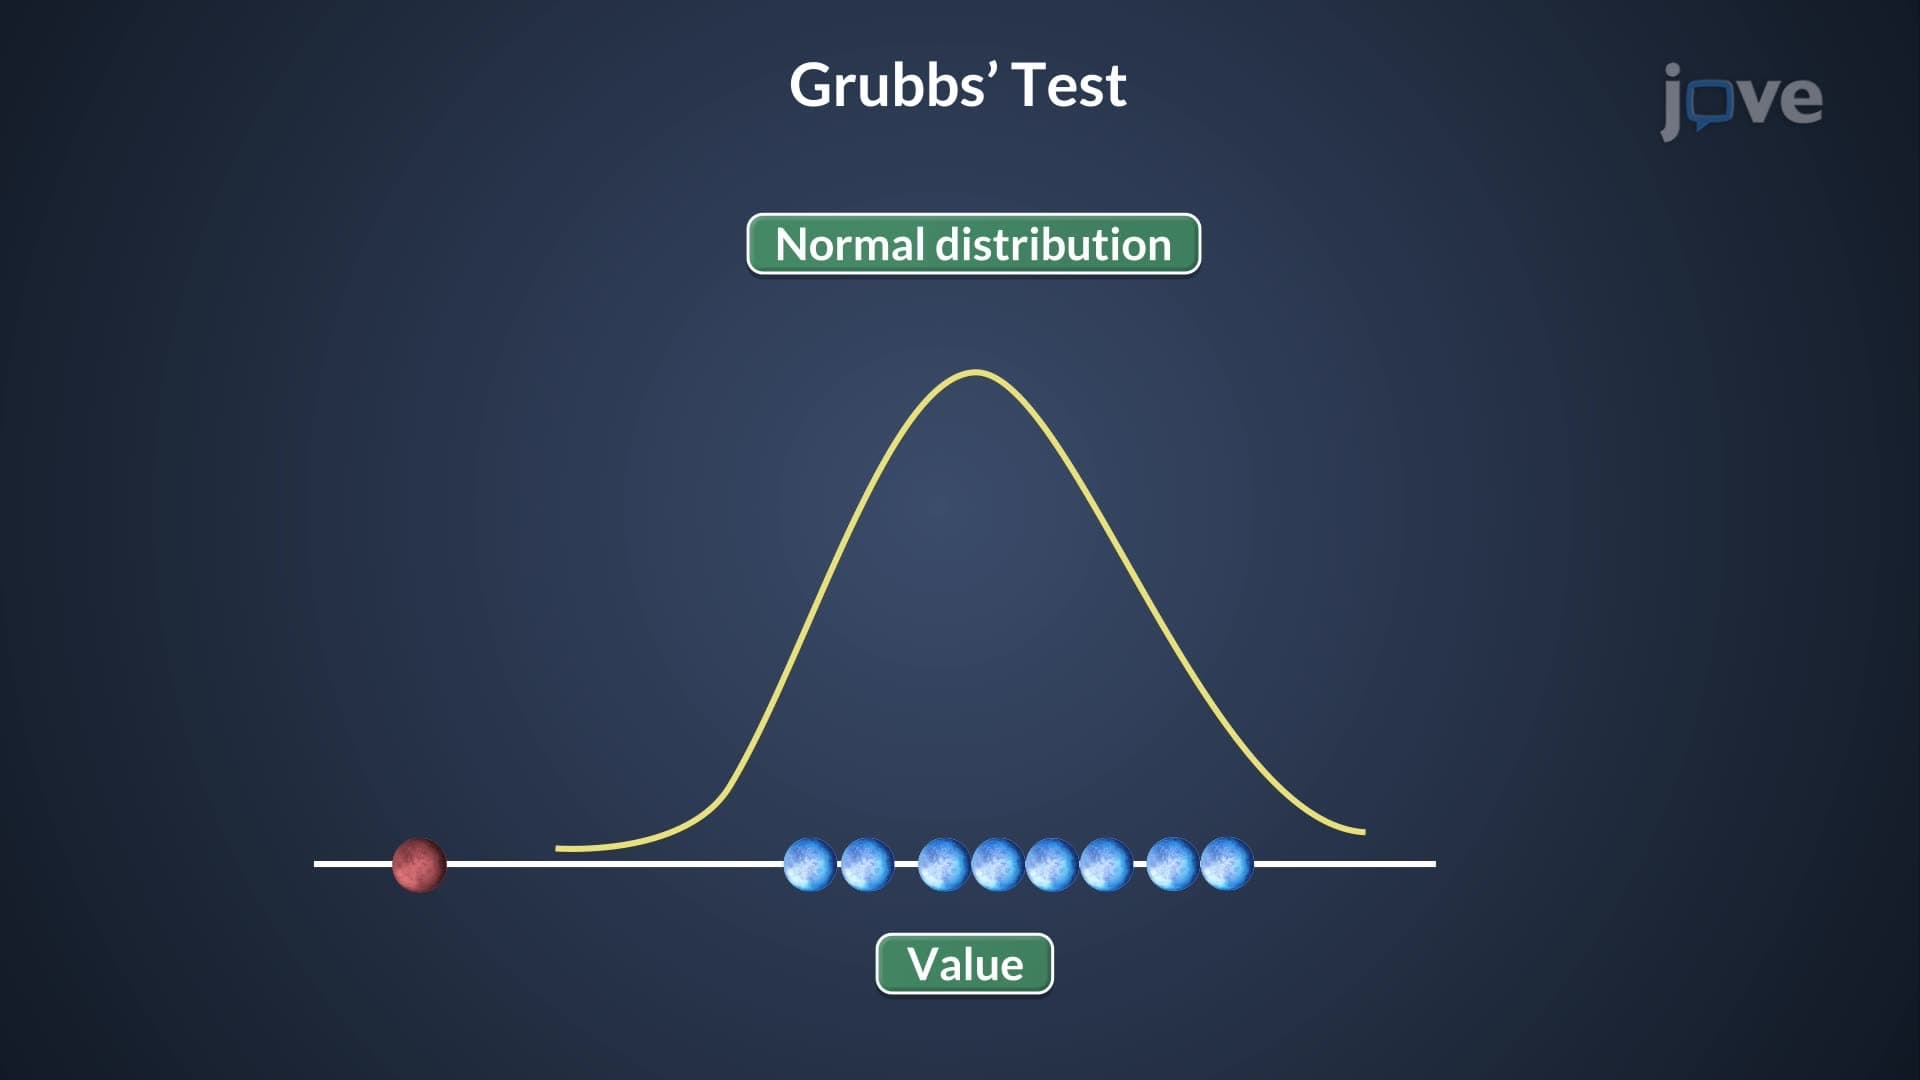
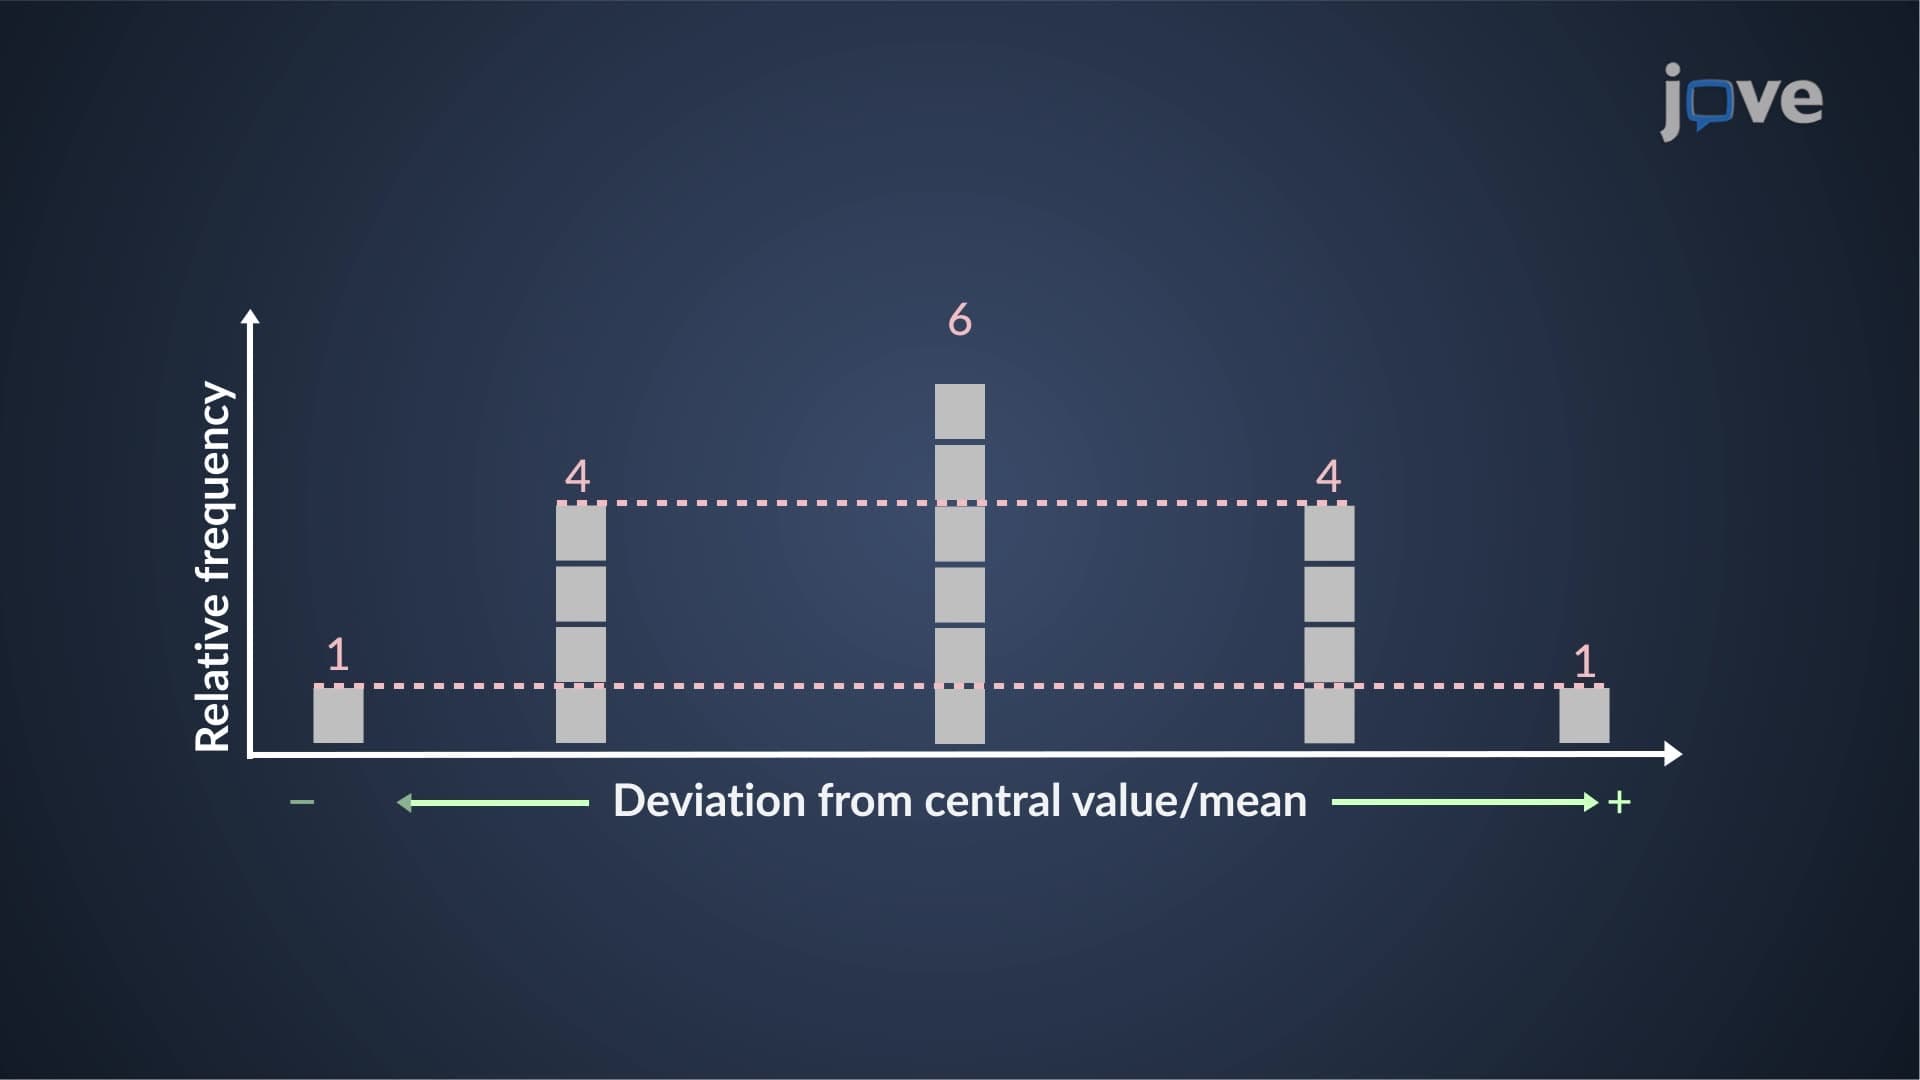
When plotting multiple measurements affected by random error, the data typically forms a bell-shaped curve known as the Gaussian or normal distribution. This pattern emerges because random errors are equally likely to be positive or negative, with smaller deviations occurring more frequently than larger ones. The peak of this distribution represents the most probable true value, while the width indicates measurement precision.
Students preparing for AP Chemistry or college-level analytical chemistry courses must understand that increasing the number of measurements improves precision by allowing statistical averaging to minimize random error effects. The standard deviation quantifies the scatter, while the standard error of the mean decreases proportionally to the square root of the number of measurements.
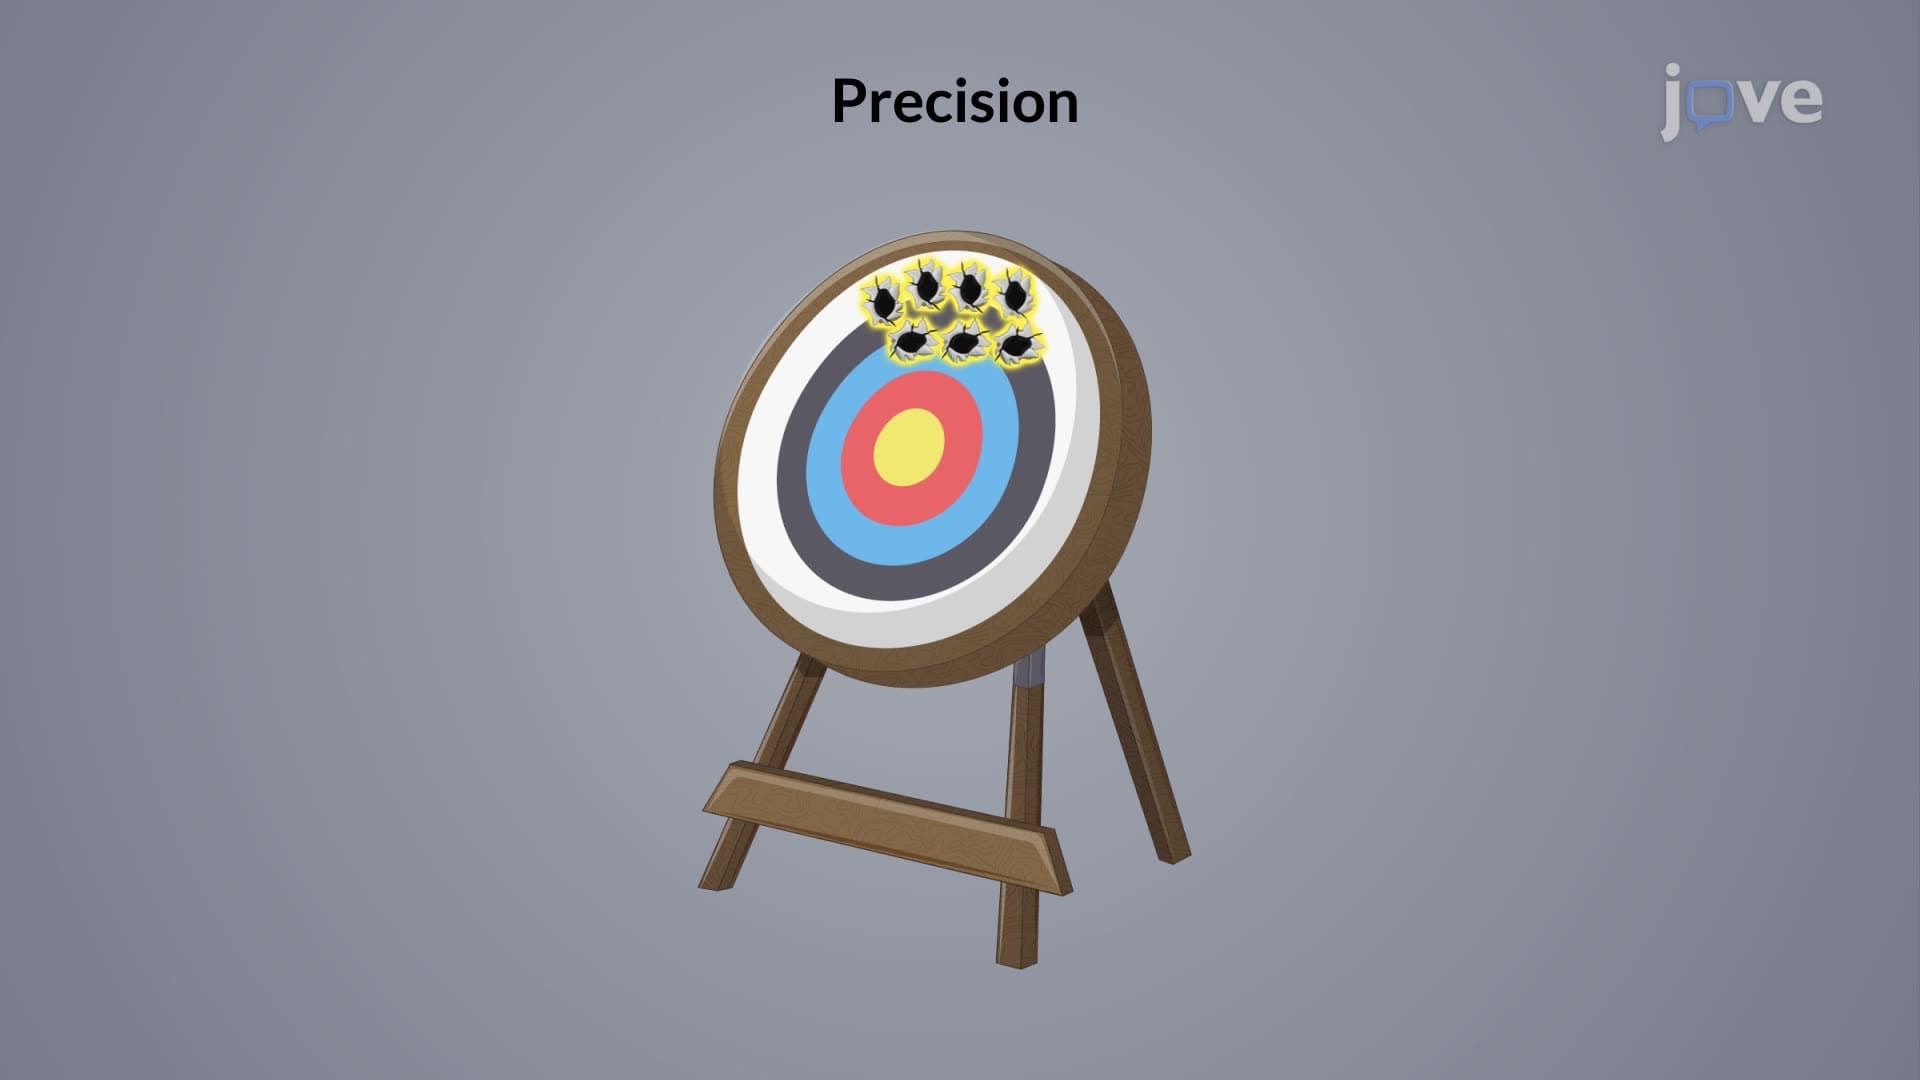
Understanding random error proves crucial for success in standardized tests like the MCAT, where students must interpret experimental data and identify error sources. In college laboratory courses, proper random error analysis distinguishes between measurement precision (random error) and accuracy (systematic error). Professional applications include quality control in pharmaceutical manufacturing, where random error affects drug potency measurements, and environmental monitoring, where atmospheric interference creates measurement variability.
Students can minimize random error by taking multiple measurements, maintaining consistent experimental conditions, and using appropriate statistical analysis. This knowledge directly applies to AP exam questions about experimental design and data interpretation, making it essential for academic success.
Related Micro-courses