Loading subject page…


104,969 views

Video Summary: What Is Statistical Analysis
Did you know that statistical analysis basics help NASA determine if a Mars rover's soil samples contain signs of life? Statistical analysis transforms scattered experimental data into meaningful conclusions by examining patterns, central tendencies, and measurement errors. When a pharmaceutical company tests a new drug across multiple clinical trials, researchers use introduction to statistical analysis to evaluate effectiveness and safety. These fundamental concepts distinguish between precision (consistency of measurements) and accuracy (closeness to true values), enabling scientists to make objective decisions about data quality. Watch the full video on JoVE Coach to master this concept with expert-led visuals and step-by-step explanations.
Statistical analysis serves as the foundation for transforming raw experimental data into reliable scientific knowledge. When researchers conduct experiments-whether testing water quality in the Great Lakes or analyzing blood glucose levels in diabetes studies-they rarely obtain identical results from repeated measurements. This natural variation, called measurement error, occurs due to instrument limitations, environmental factors, and human factors. Statistical analysis basics provide the tools to interpret this scattered data meaningfully.
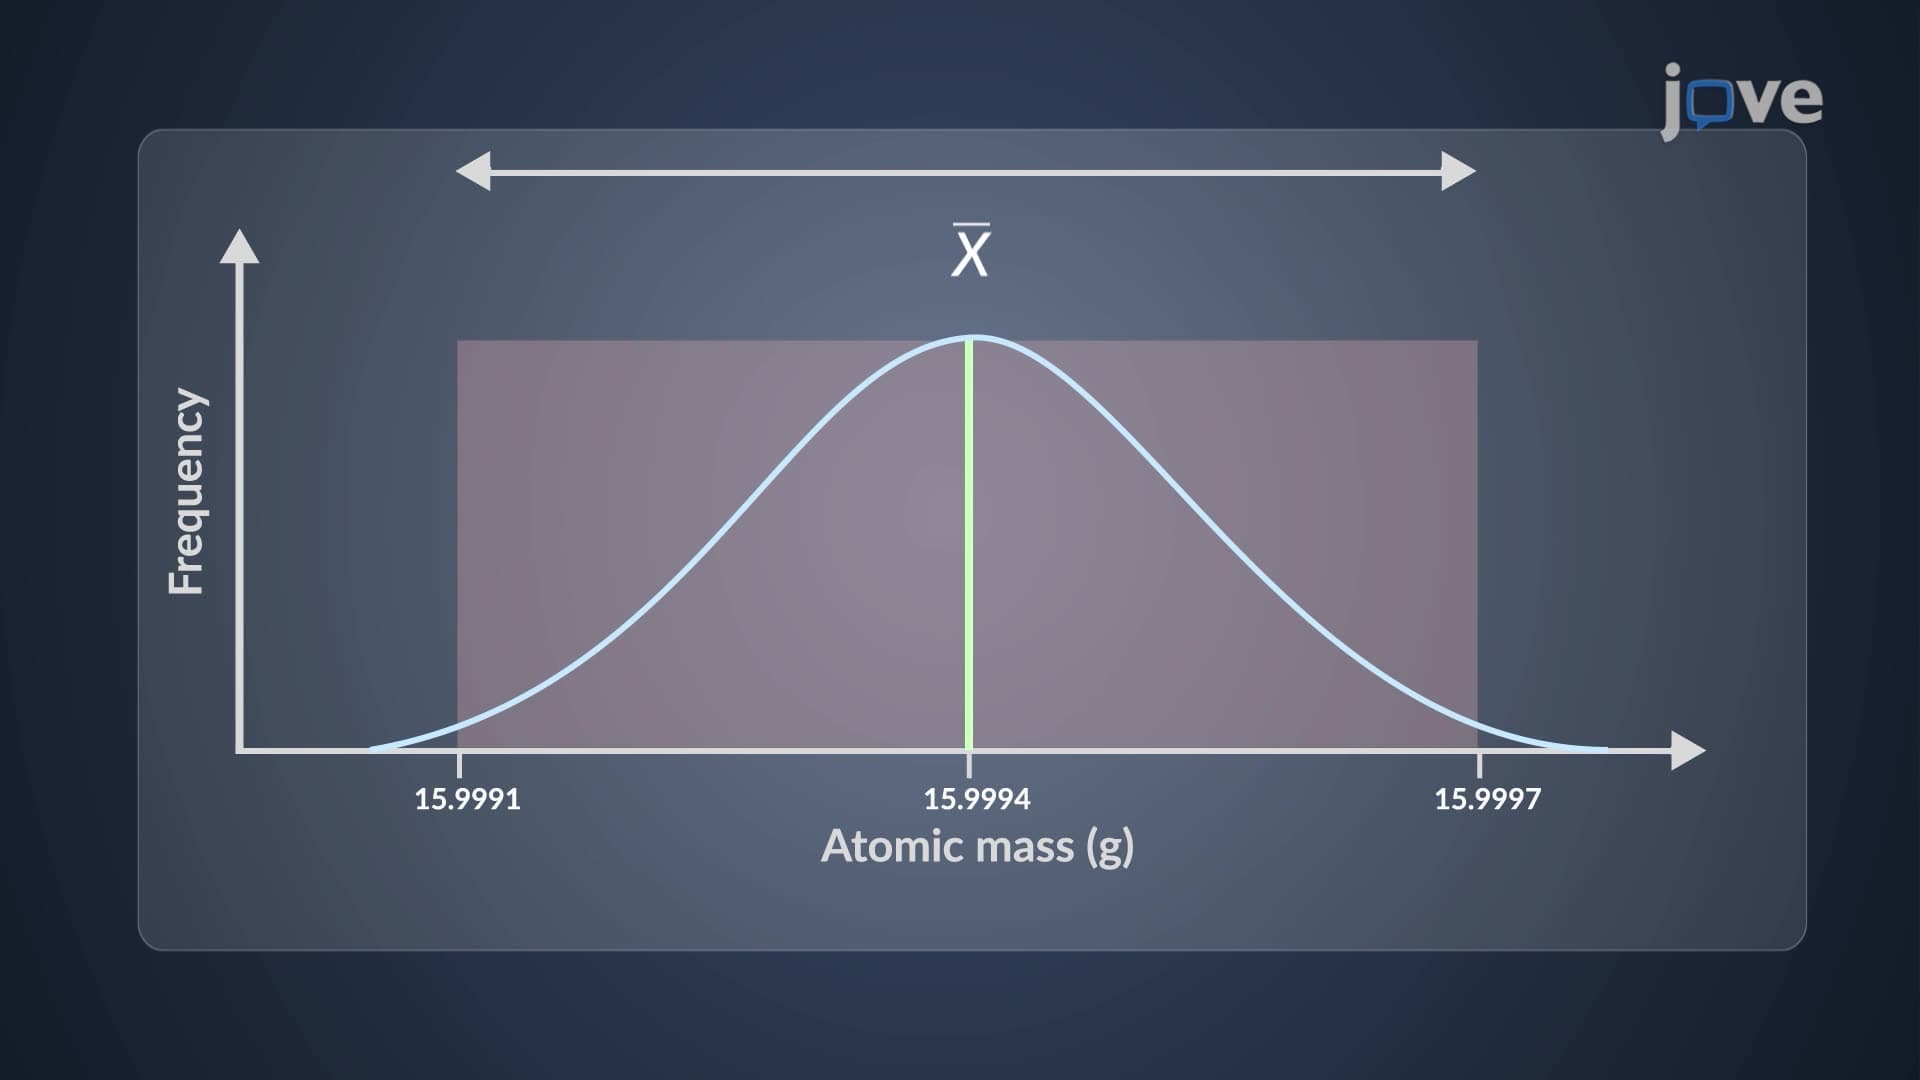
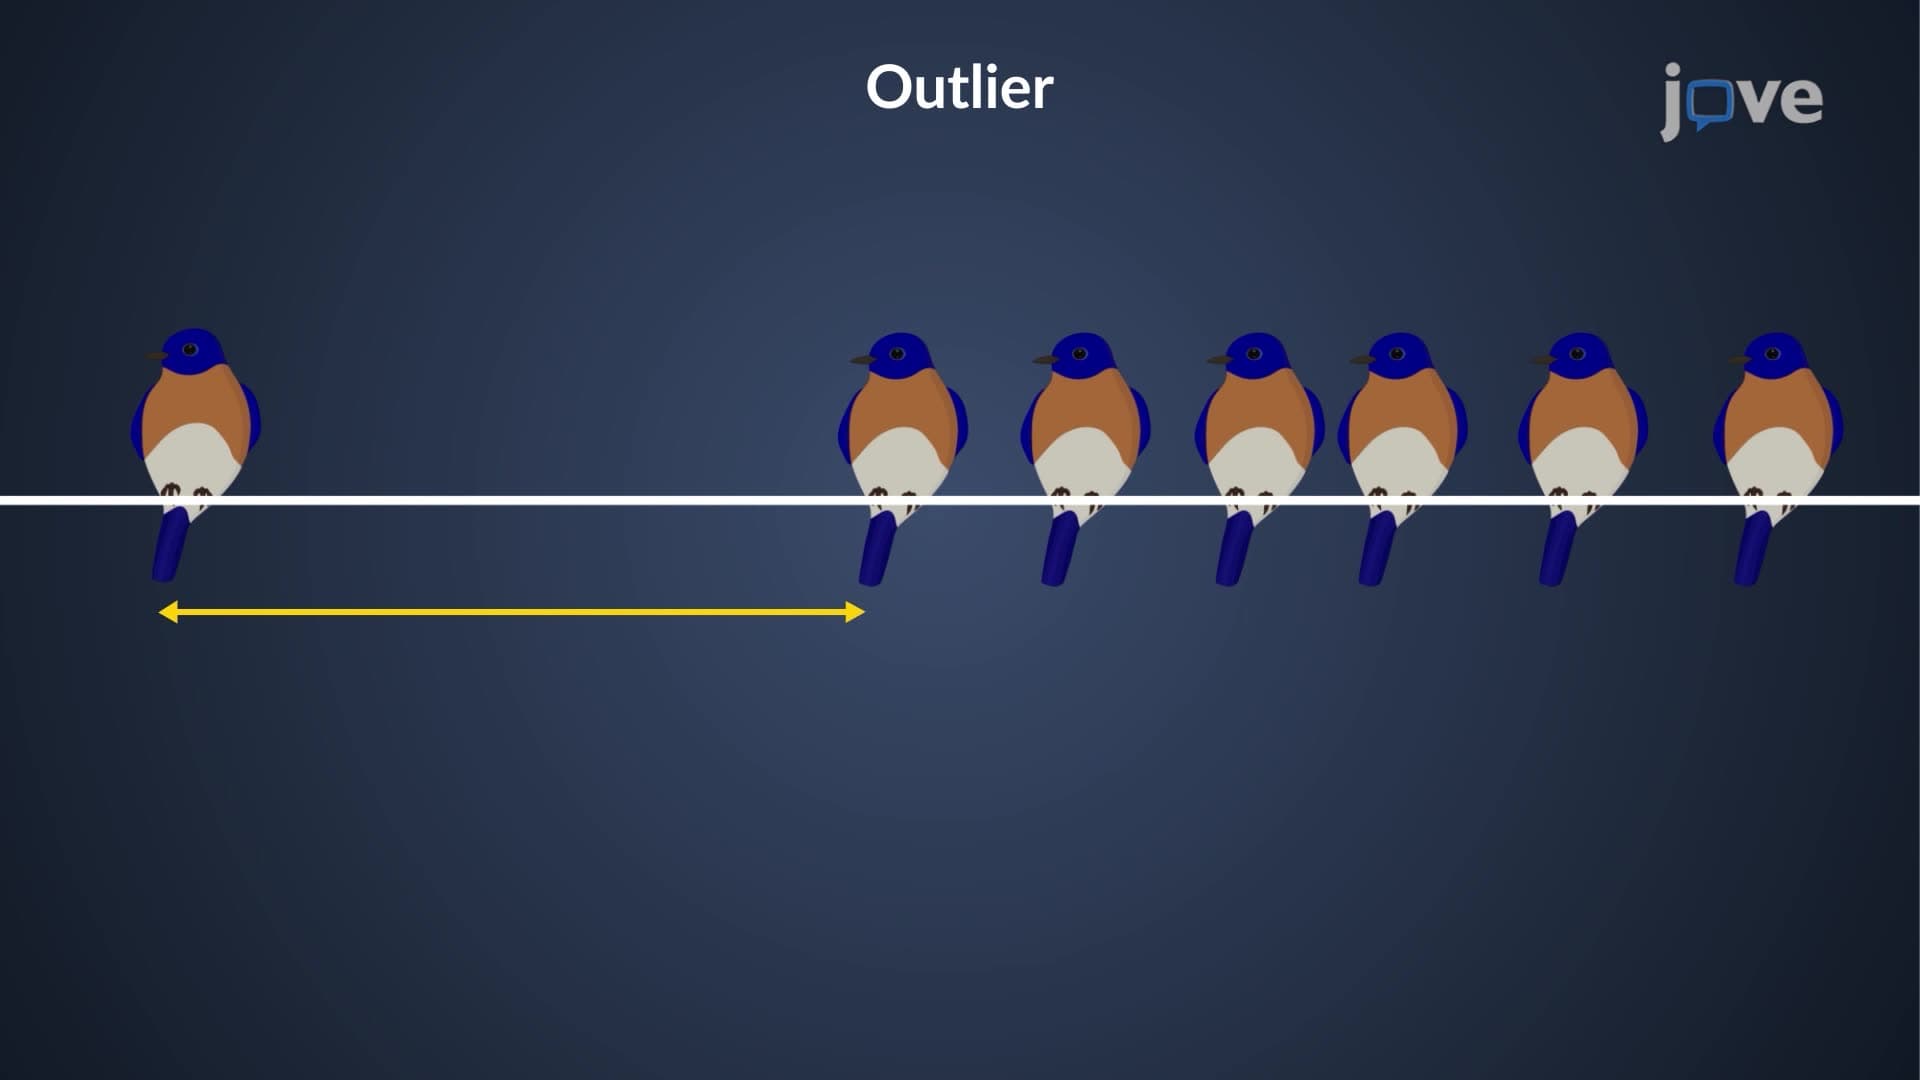
The most fundamental statistical analysis methods in science involve calculating central values. The mean represents the arithmetic average, calculated by summing all measurements and dividing by the number of observations. For example, if a chemistry student measures the pH of a solution five times (7.2, 7.4, 7.1, 7.3, 7.2), the mean equals 7.24. The median, alternatively, represents the middle value when data points are arranged in order-in this case, 7.2. While means are sensitive to extreme values (outliers), medians provide more robust measures when data contains unusual measurements.
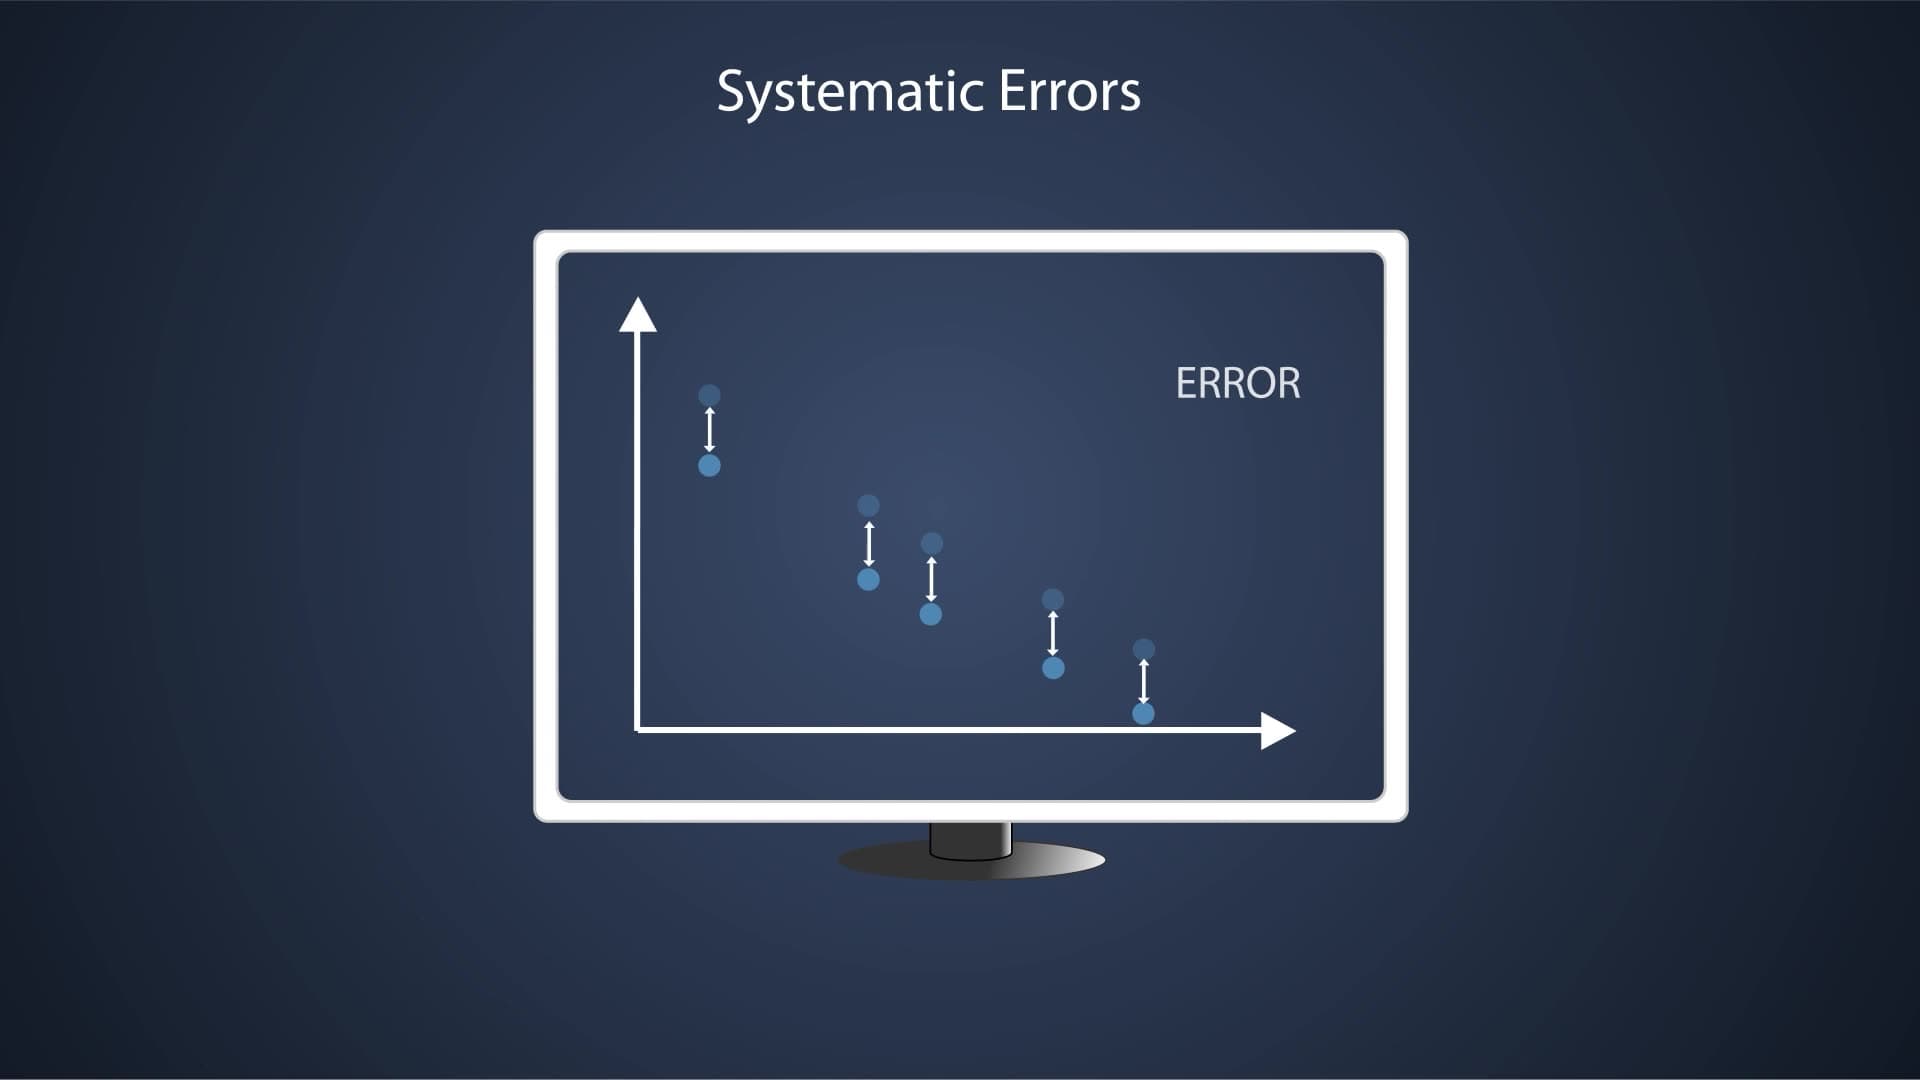
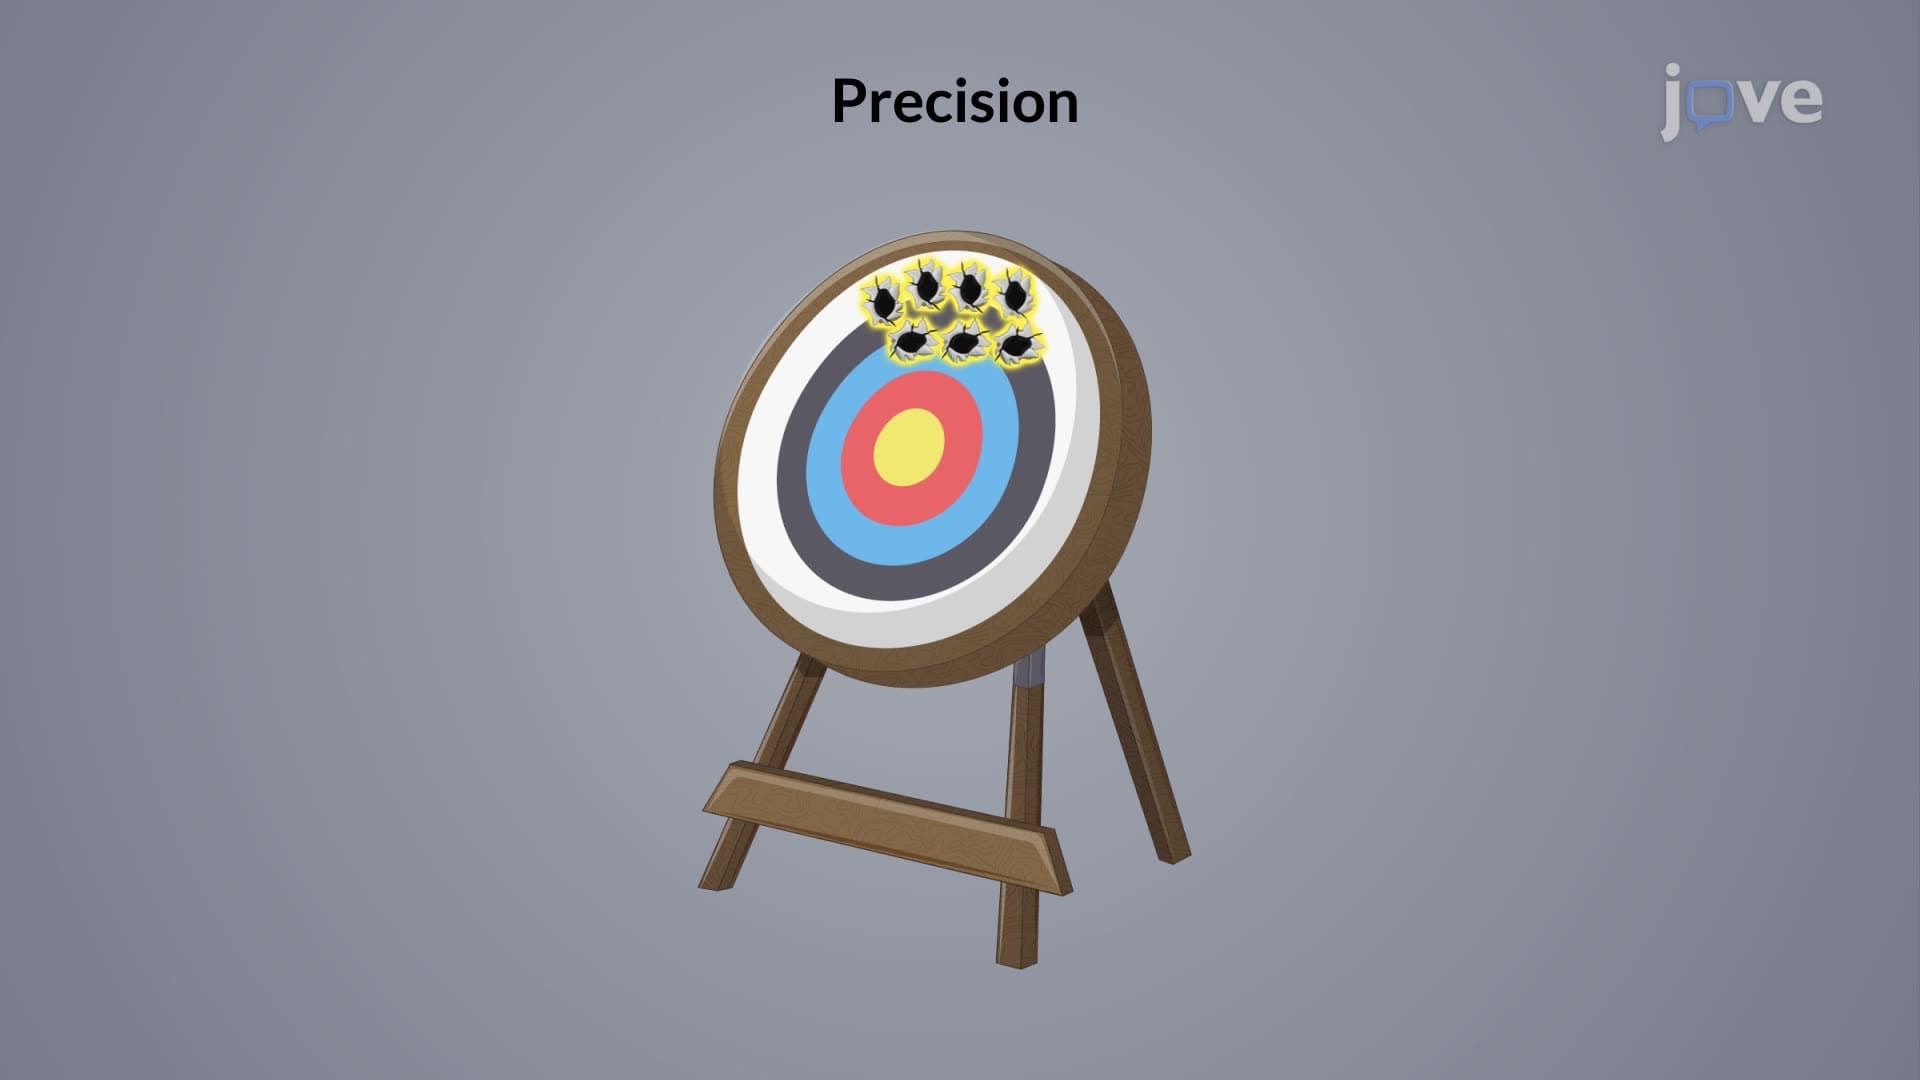
Understanding precision and accuracy forms a cornerstone of introduction to statistical analysis. Precision measures consistency between repeated measurements-how close multiple readings are to each other. Accuracy measures how close measurements come to the true or accepted value. Consider a student using a balance to weigh a 10.00g standard: measurements of 9.98g, 9.99g, and 10.01g show high precision and accuracy. However, consistent readings of 10.50g, 10.52g, and 10.49g demonstrate high precision but poor accuracy due to systematic error.
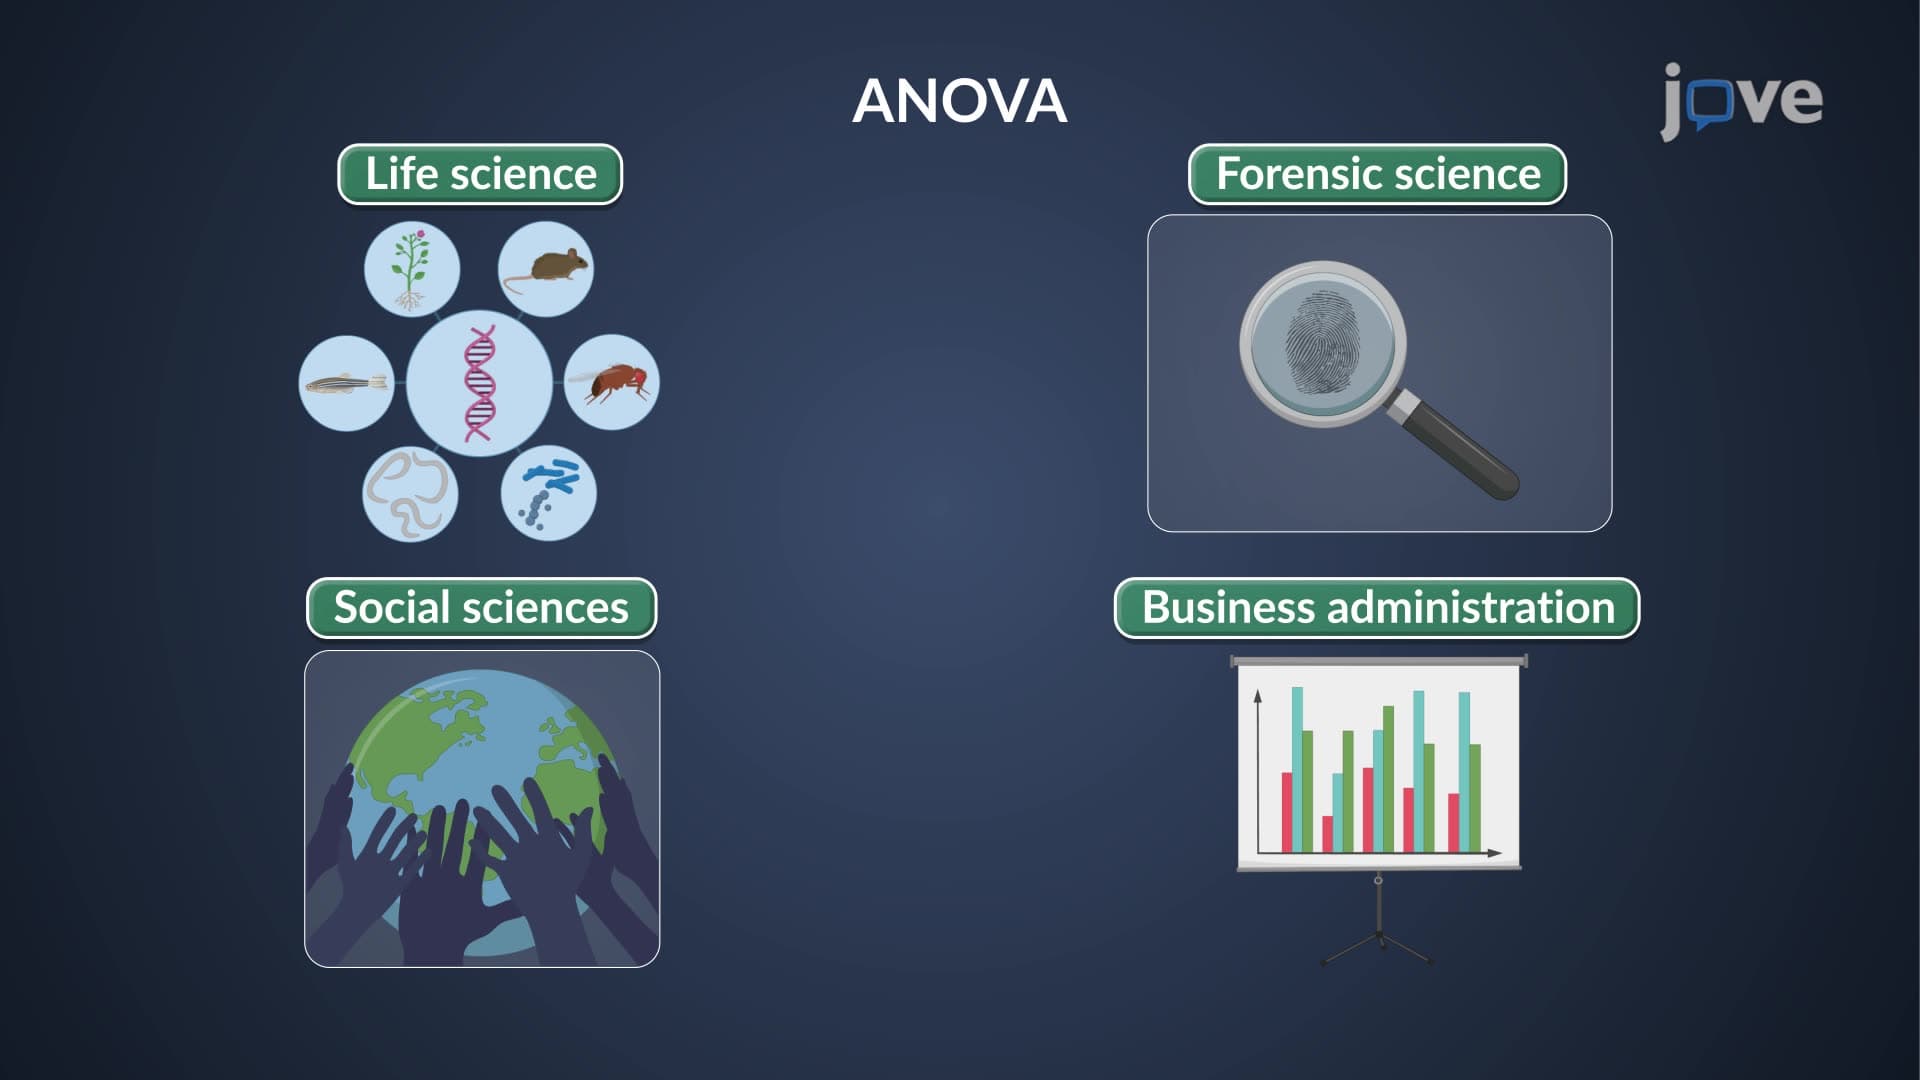
These concepts directly apply to AP Biology labs, college chemistry courses, and standardized tests like the MCAT. Students encounter statistical analysis when designing experiments for science fairs, analyzing data in AP Statistics, or interpreting research findings in college coursework. Professional applications span from quality control in pharmaceutical manufacturing to environmental monitoring by the EPA, where accurate data interpretation can influence public health policies.
Related Micro-courses