Loading subject page…


925,504 views

Video Summary: What are Acid Base Titration Curves
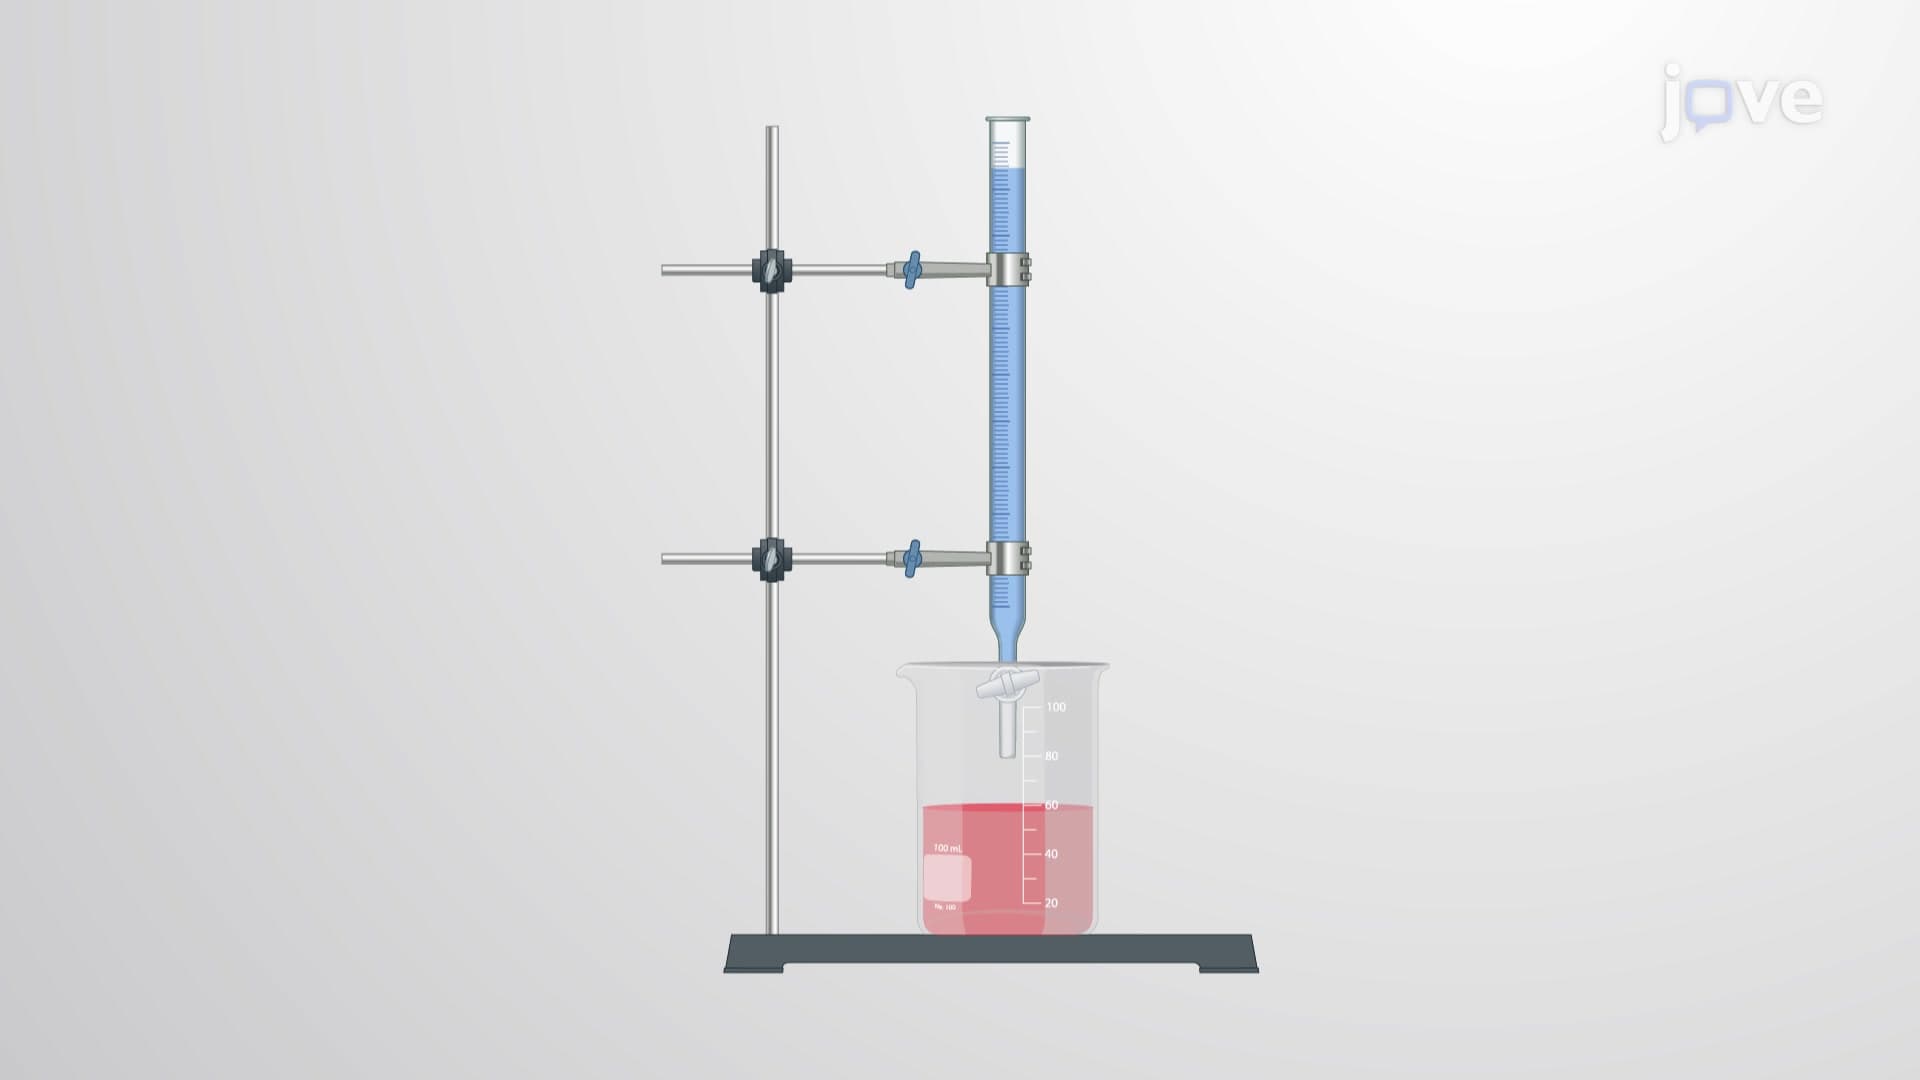
Ever wondered how pharmaceutical companies ensure precise medication dosages? Acid base titration curves are the S-shaped graphs that reveal exactly when chemical reactions reach perfect balance. These curves map pH changes as solutions are mixed, helping chemists at companies like Pfizer determine unknown concentrations with remarkable accuracy. From quality control in food production to environmental testing by the EPA, understanding what are acid base titration curves unlocks the science behind countless analytical processes. Watch the full video on JoVE Coach to master this concept with expert-led visuals and step-by-step explanations.
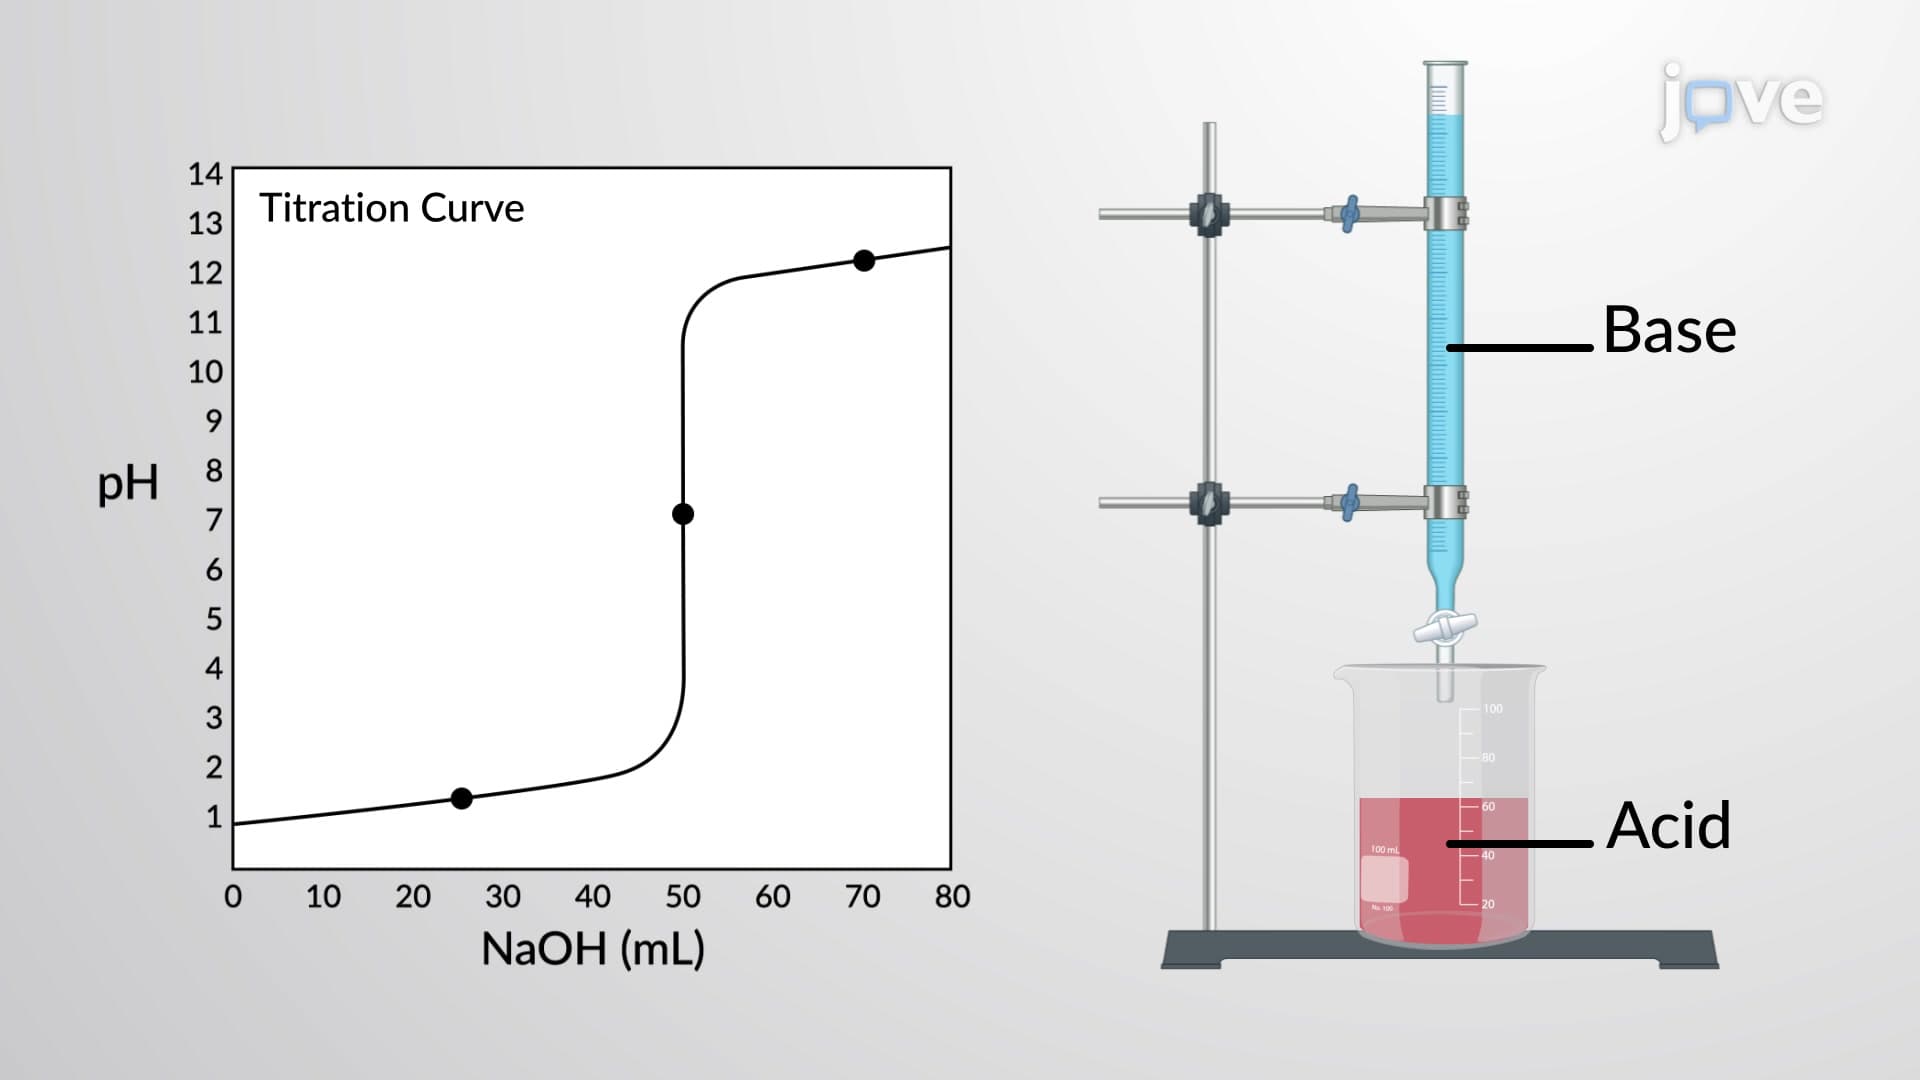
Acid base titration curves serve as visual roadmaps for one of chemistry's most fundamental analytical techniques. These distinctive S-shaped graphs plot pH versus volume of titrant added, revealing the precise moment when acids and bases neutralize each other. In the United States, mastering these curves is essential for AP Chemistry students and appears frequently on college general chemistry exams, including those at institutions like UCLA and MIT.
The power of titration curves lies in their ability to transform abstract chemical processes into concrete visual data. When a pharmaceutical company like Johnson & Johnson tests the acidity of aspirin tablets, technicians rely on titration curves to ensure each tablet meets FDA specifications. Similarly, environmental scientists monitoring acid rain effects on lakes throughout the Northeast use these curves to track pH changes over time.
Strong acid titration curves exhibit the most dramatic pH changes, creating steep vertical sections near the equivalence point. When hydrochloric acid (a common industrial chemical) reacts with sodium hydroxide, the equivalence point occurs precisely at pH 7. This predictability makes strong acid-strong base titrations ideal for introductory chemistry courses and serves as the foundation for more complex analytical work.
The sharpness of these curves reflects the complete dissociation of strong acids and bases. Students preparing for the MCAT often struggle with this concept until they visualize how millions of H+ ions suddenly disappear from solution at the equivalence point, causing the dramatic pH jump that characterizes these titrations.
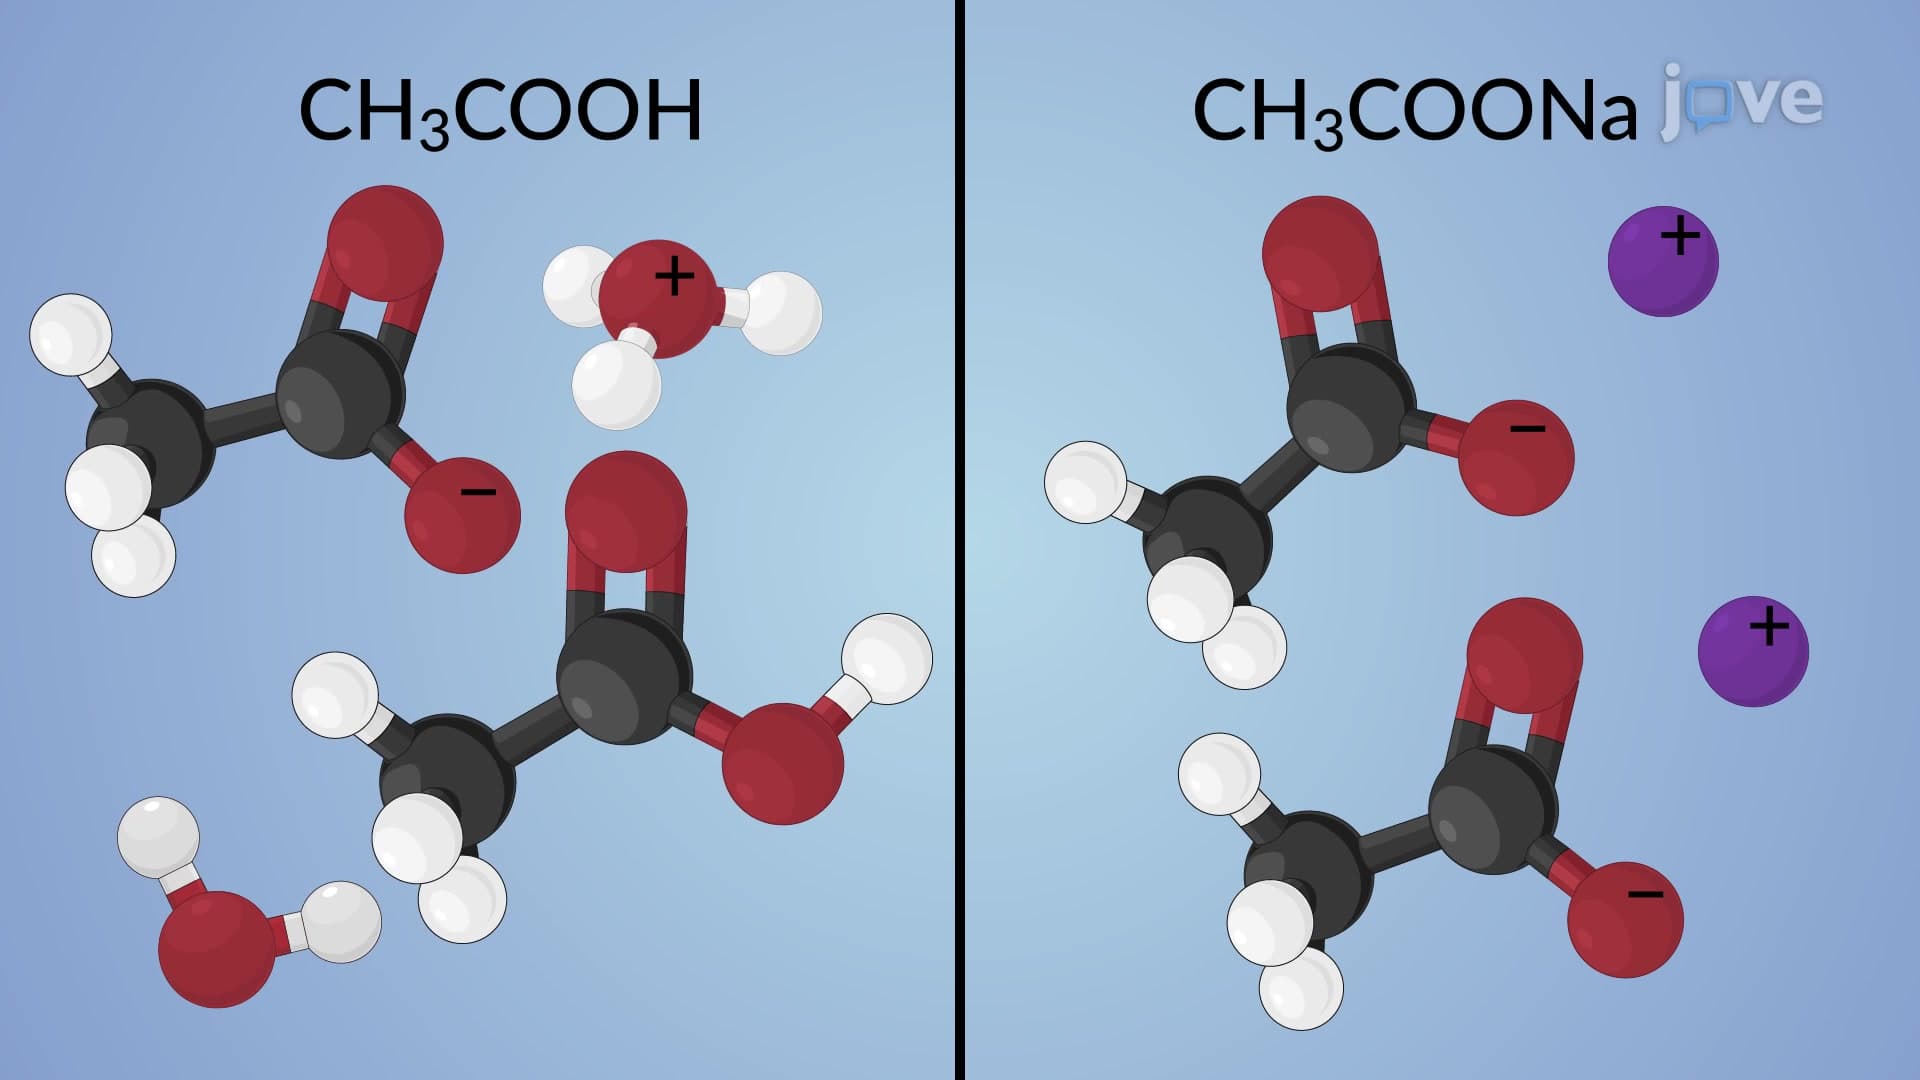
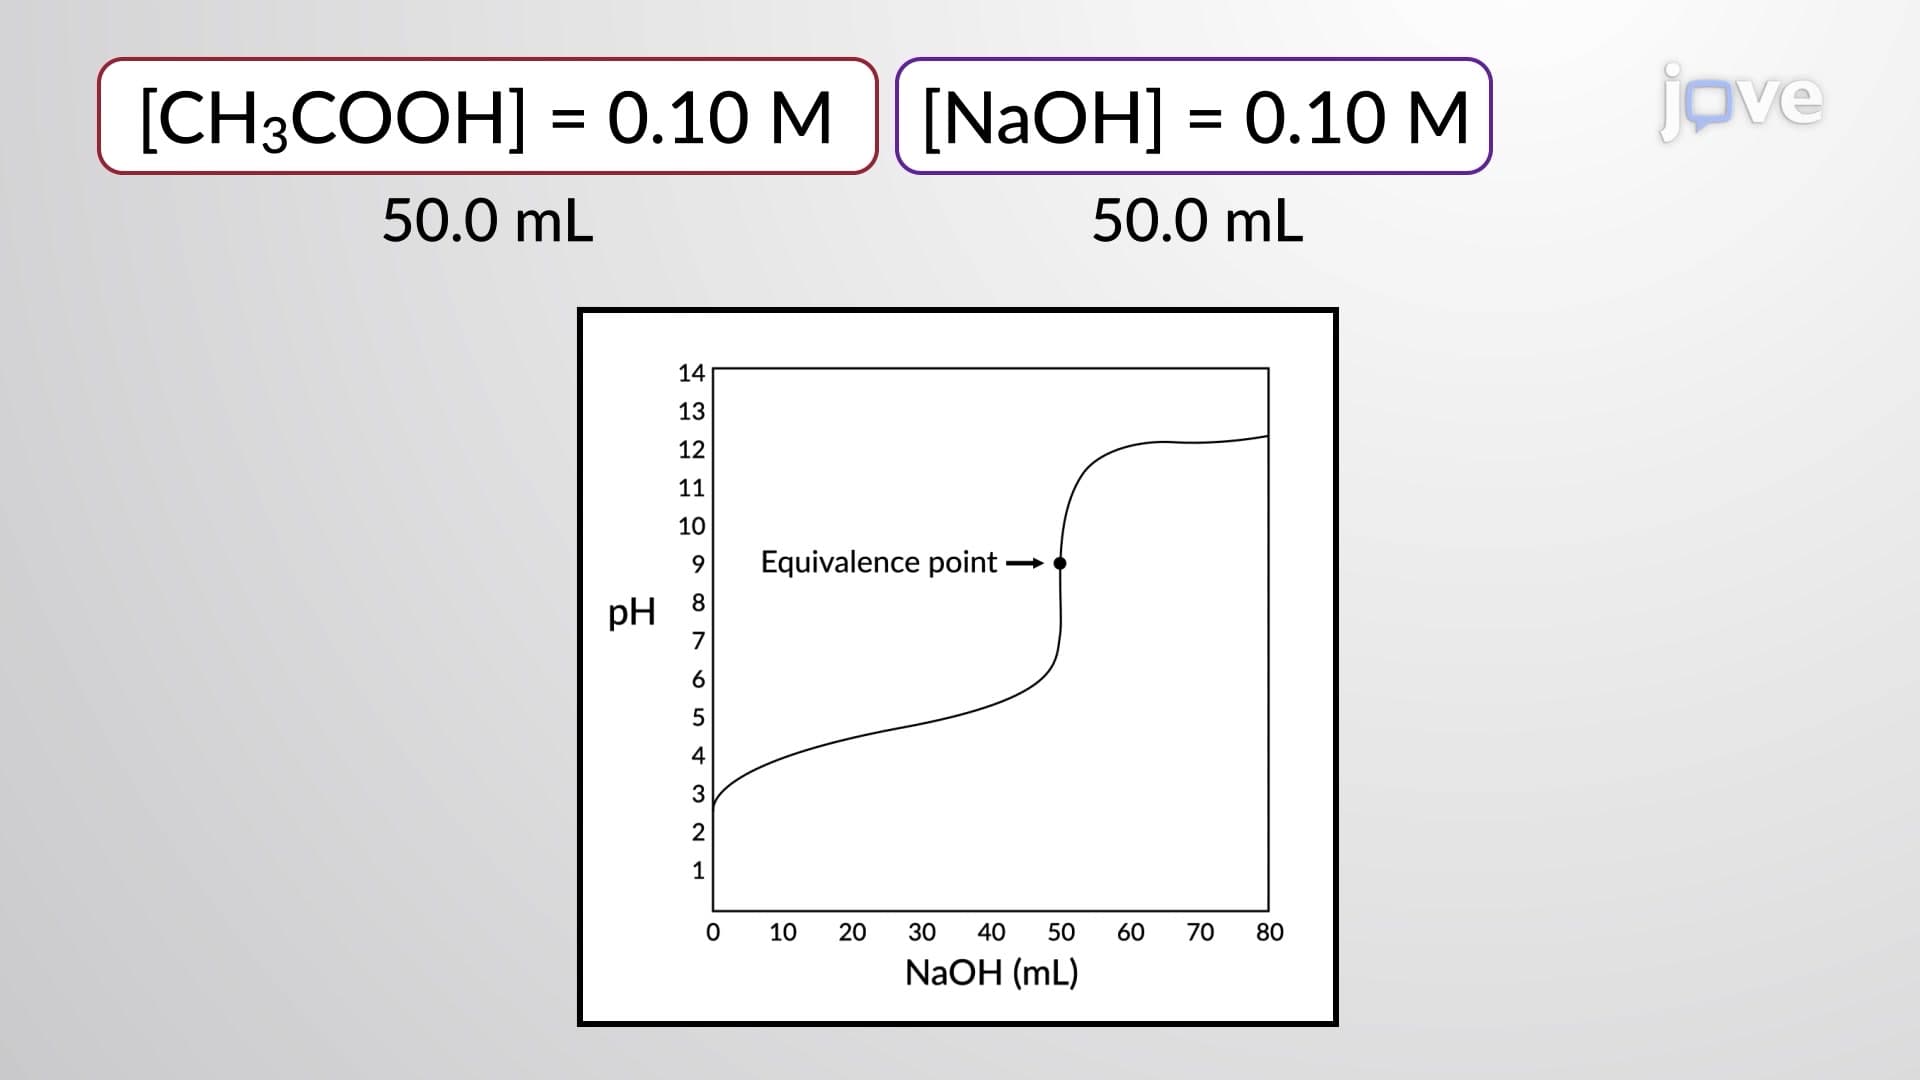
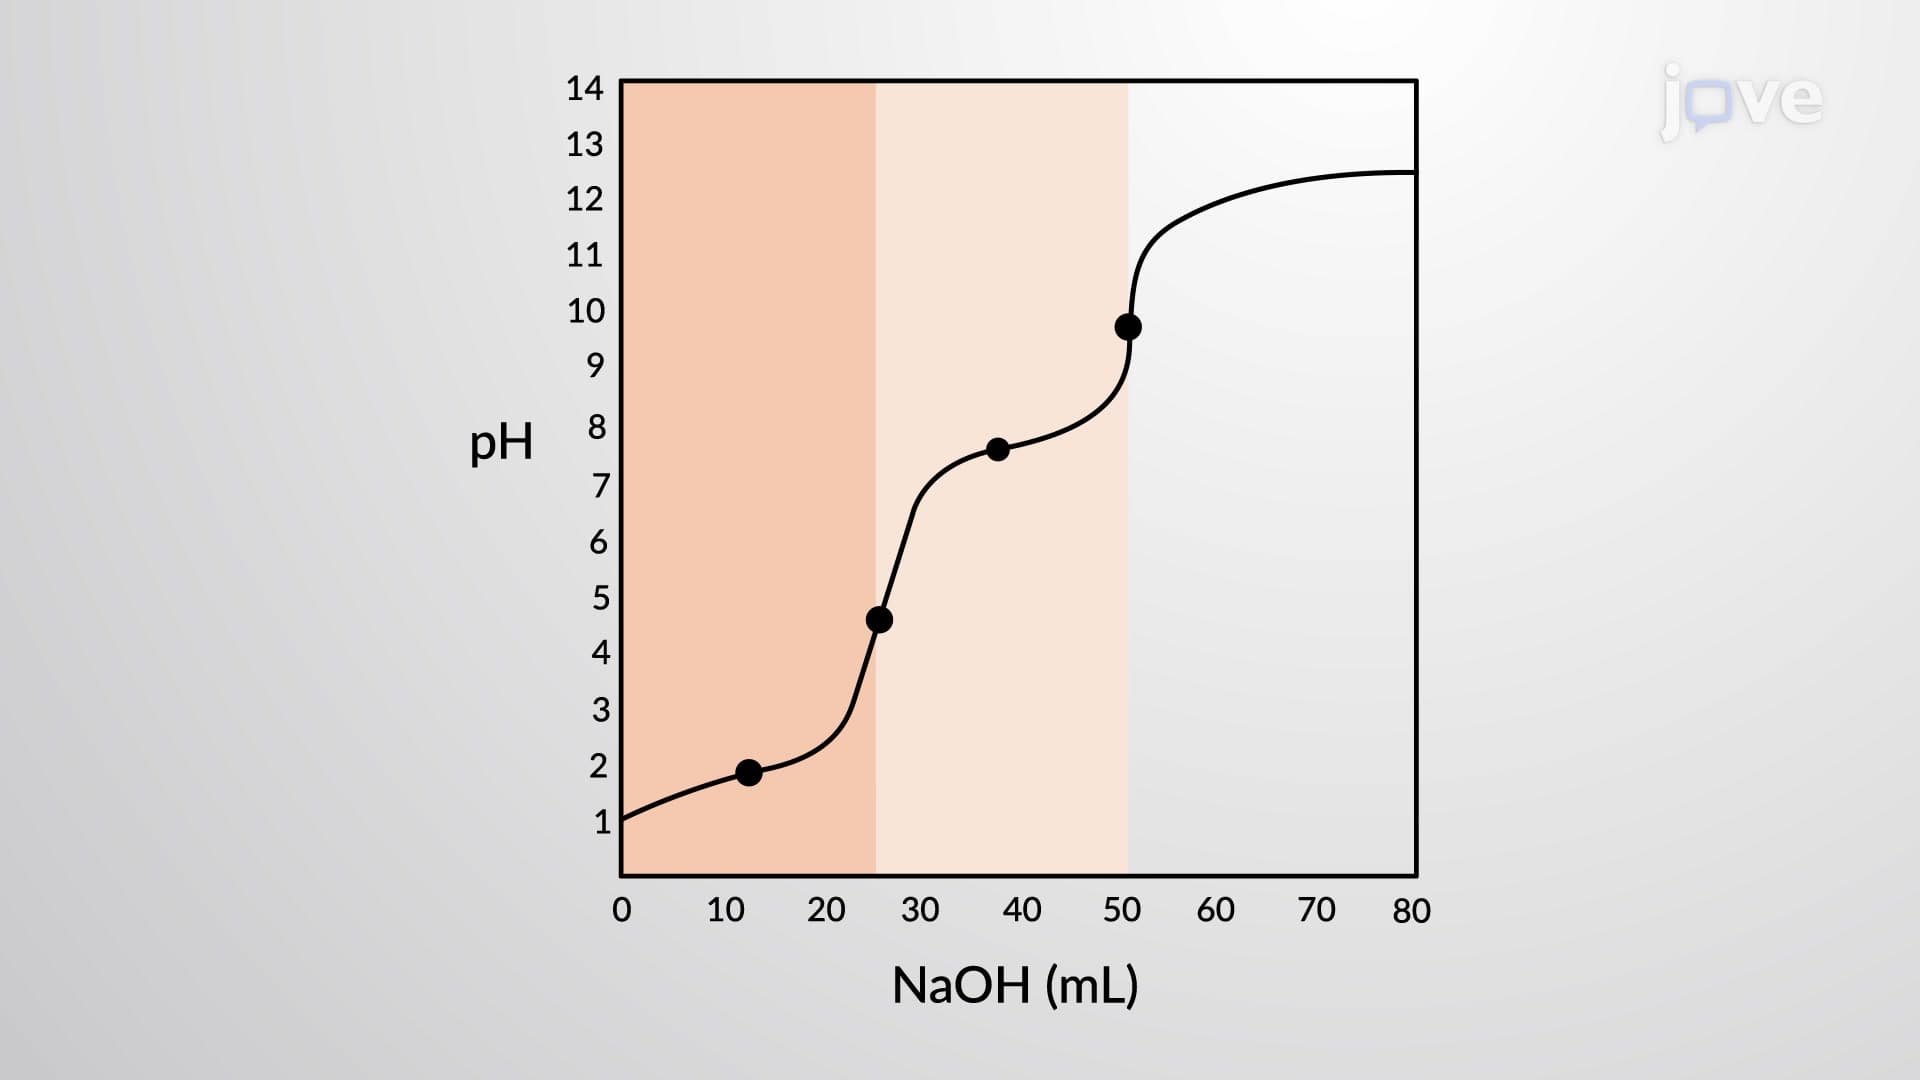
Types of acid base titration curves become more complex when weak acids enter the picture. Unlike their strong acid counterparts, weak acid curves feature distinctive buffer regions-gradual slopes where pH changes slowly despite continued base addition. This buffering capacity explains why biological systems, from blood pH regulation to soil chemistry, rely heavily on weak acid-conjugate base pairs.
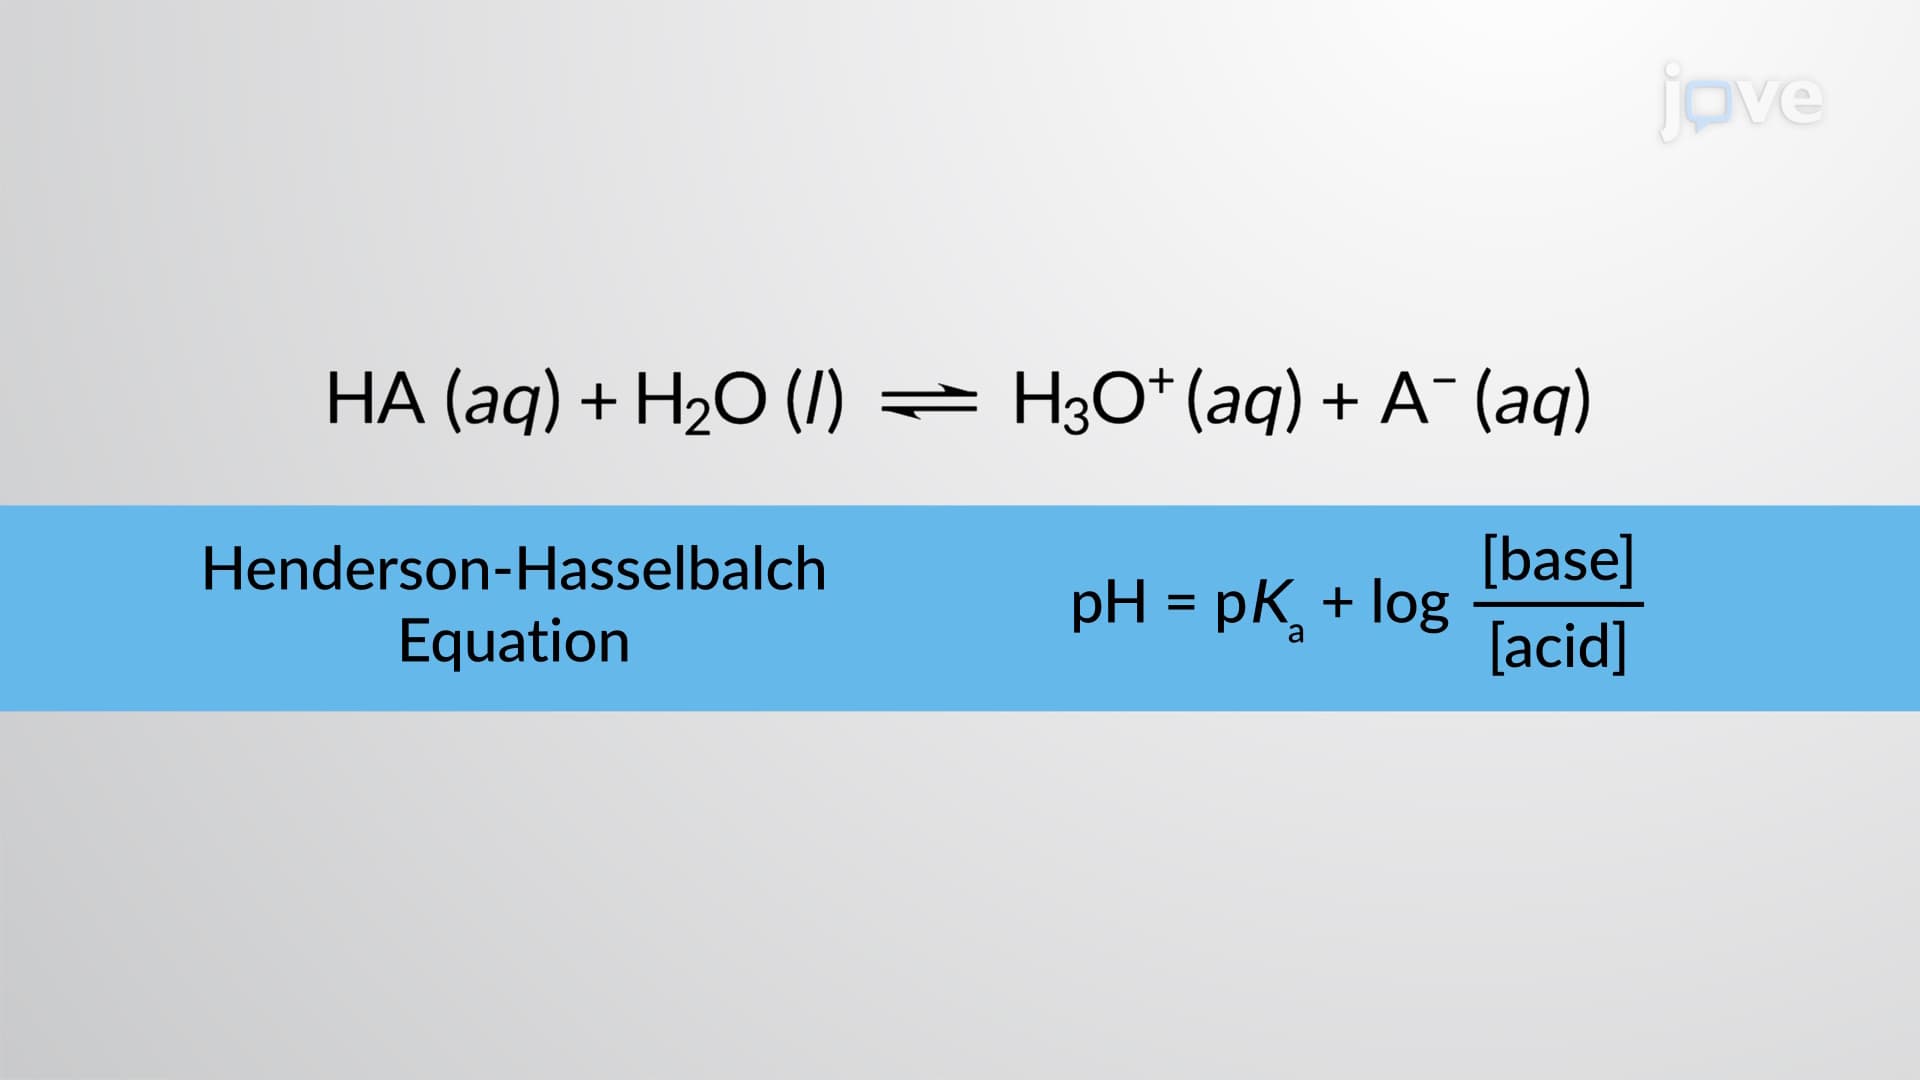
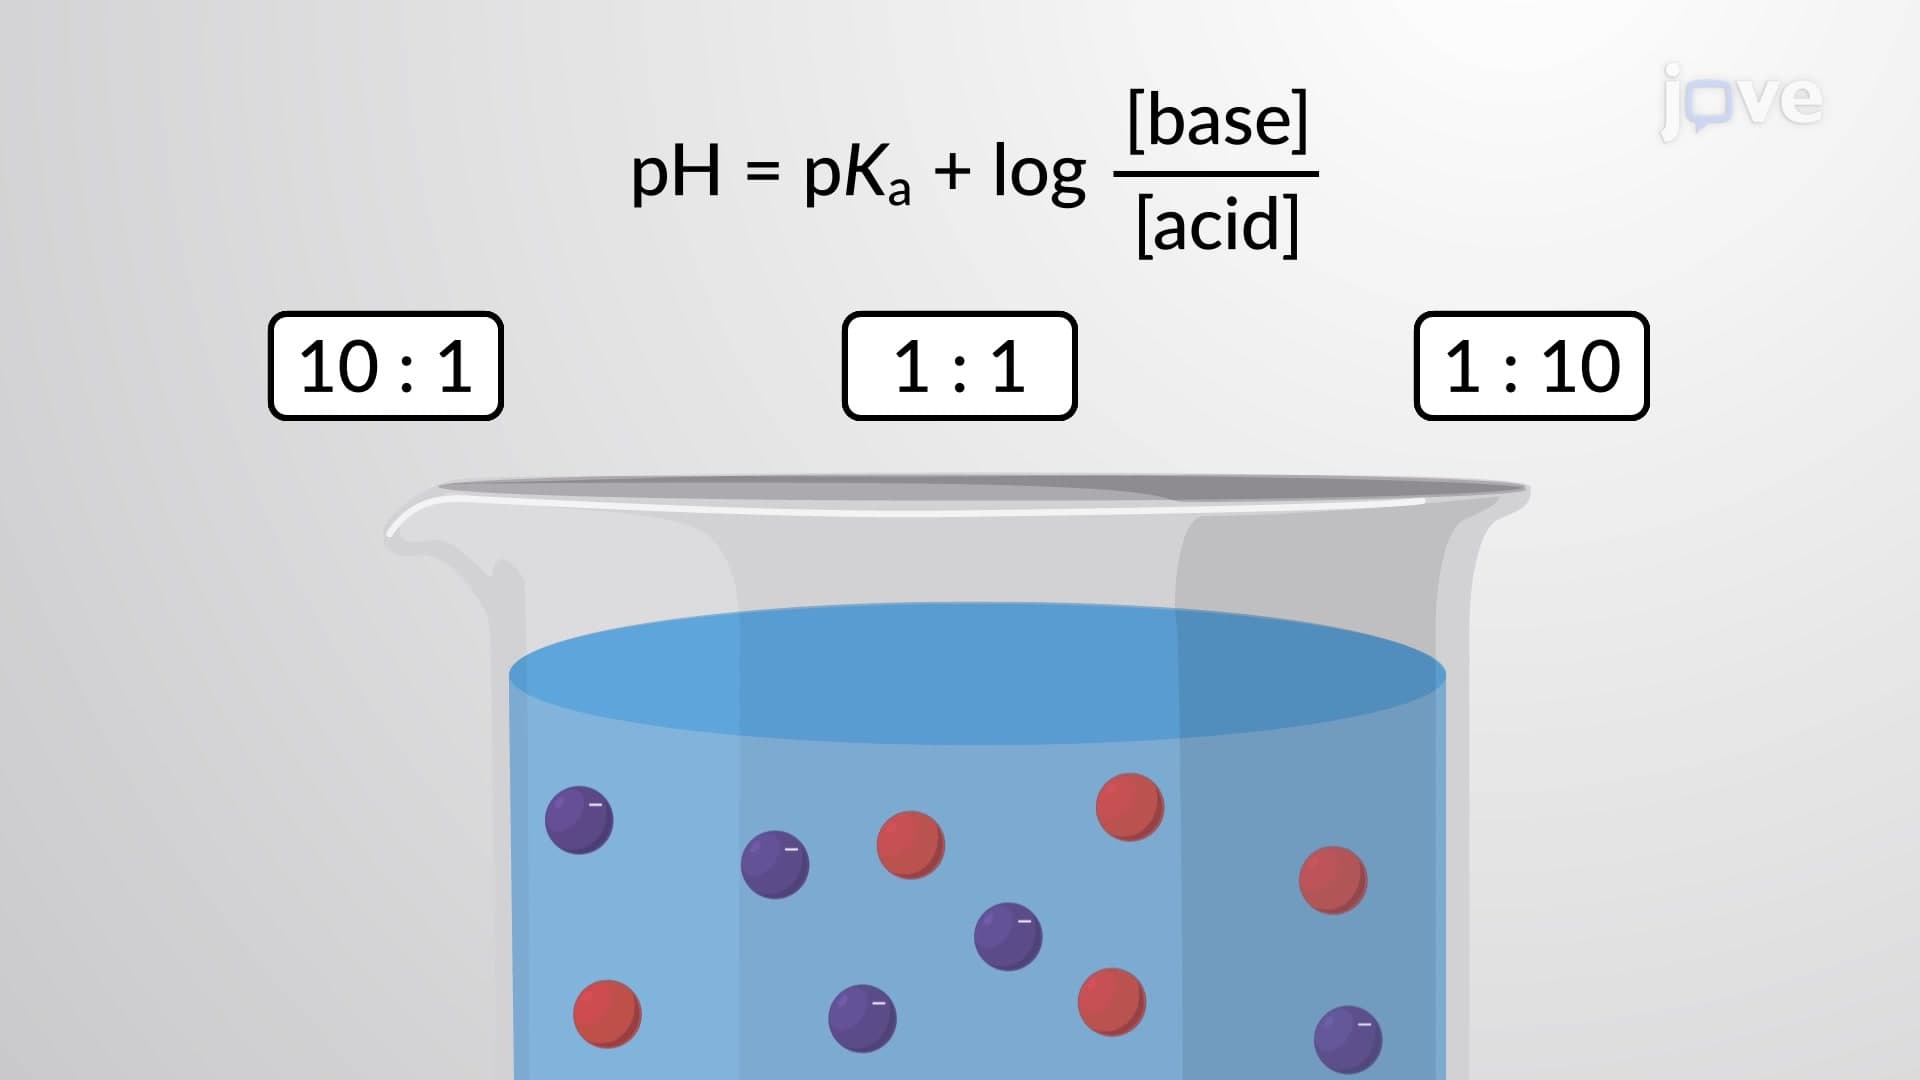
The half-equivalence point represents a critical milestone in weak acid titrations, occurring when exactly half the required base has been added. At this point, the concentration of weak acid equals its conjugate base concentration, making the solution pH equal to the acid's pKa value. This relationship proves invaluable for determining unknown pKa values, a technique frequently employed by biochemists studying enzyme function at companies like Genentech.
Understanding these curves extends far beyond theoretical knowledge. Food scientists at companies like General Mills use titration curves to standardize vinegar acidity, while water treatment facilities employ them to optimize pH levels for safe drinking water. For students tackling college chemistry courses or preparing for graduate school entrance exams, recognizing curve patterns enables quick problem-solving and confident analysis of experimental data.
Related Micro-courses