Loading subject page…


774,425 views

Video Summary: What Is Emission Spectra
Ever wonder how NASA identifies elements on distant stars millions of miles away? Emission spectra act like atomic fingerprints, revealing the unique light patterns elements produce when energized. When hydrogen atoms in a neon sign absorb electrical energy, they emit specific wavelengths of light that create the characteristic red glow. What is emission spectra becomes clear through these distinctive line patterns that help scientists identify unknown substances. Watch the full video on JoVE Coach to master this concept with expert-led visuals and step-by-step explanations.
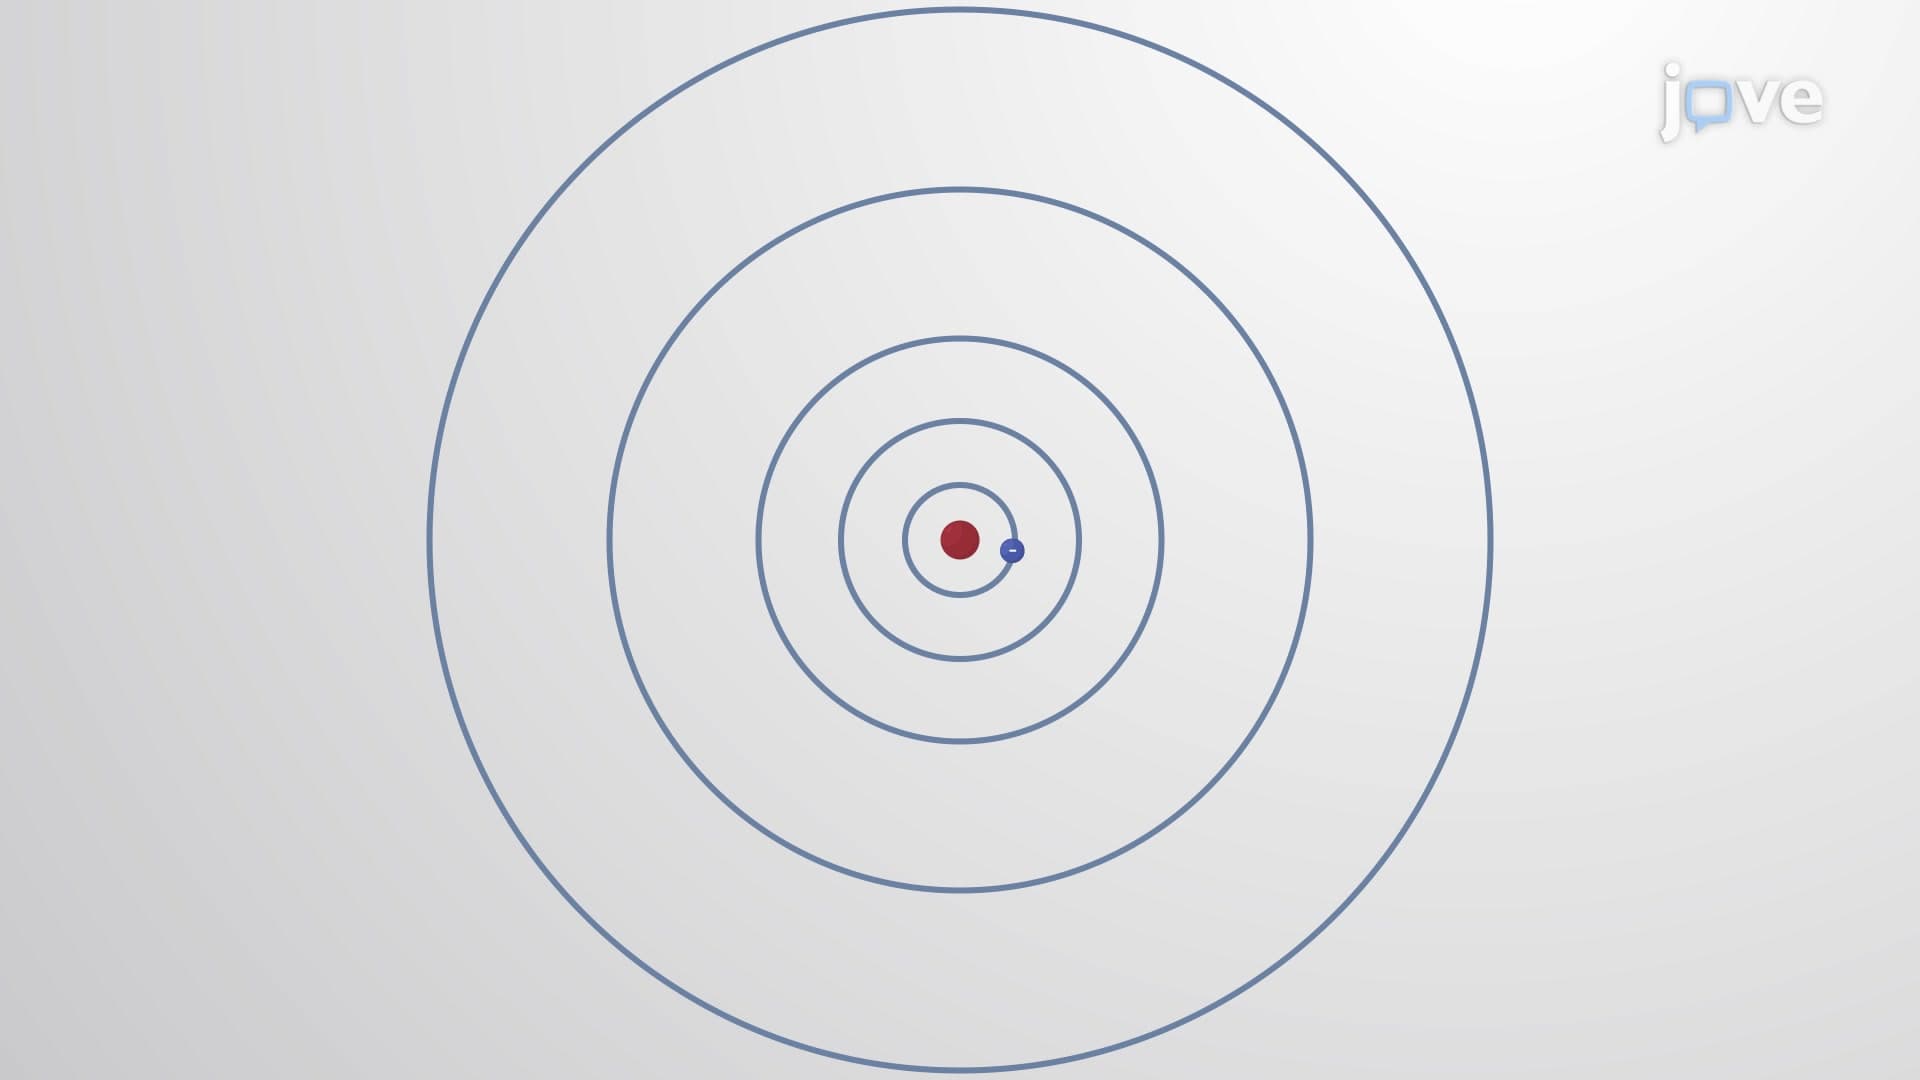
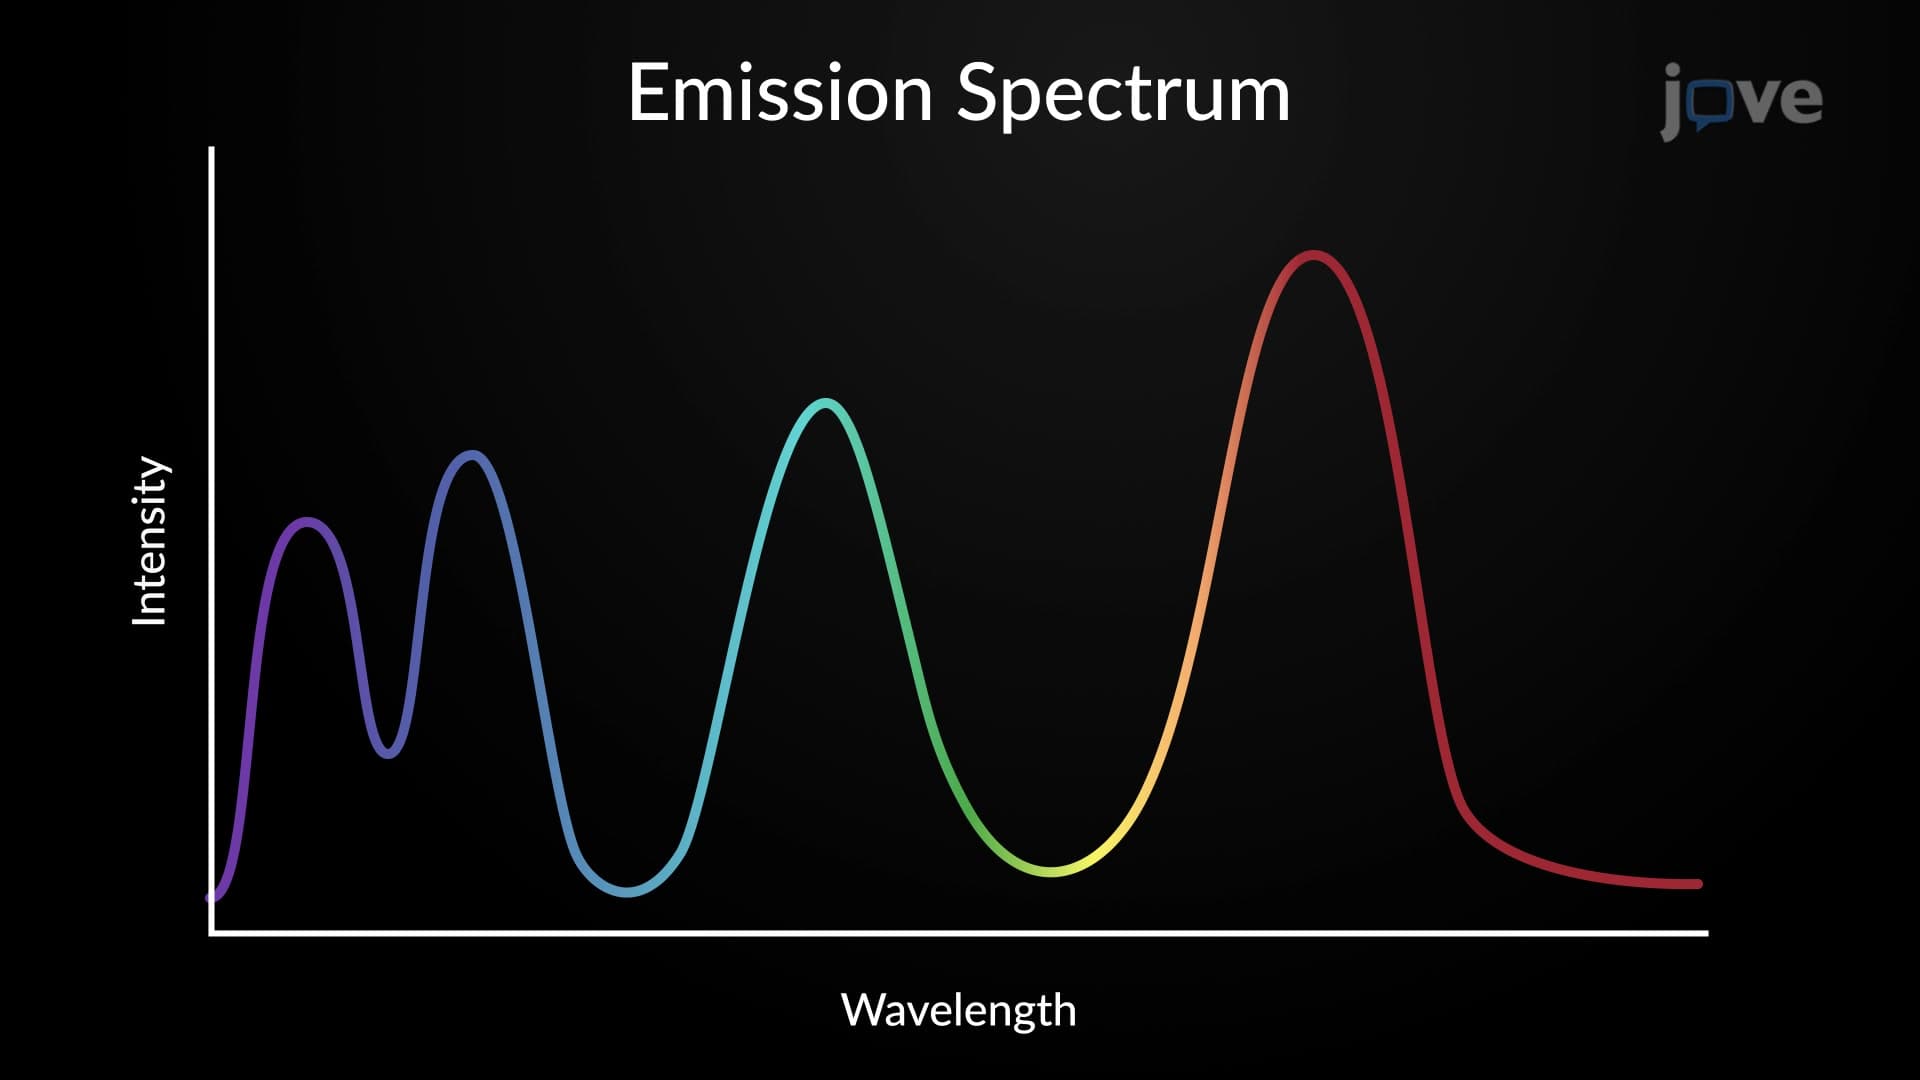
What is emission spectra begins with atomic structure and electron behavior. When atoms absorb energy through heat, electricity, or radiation, their electrons jump to higher energy levels, creating an unstable excited state. As these electrons naturally fall back to lower energy positions, they release excess energy as photons of light. The specific wavelengths emitted depend entirely on the energy gaps between electron shells, making each element's emission pattern unique and measurable.
Unlike continuous light spectra from incandescent bulbs, pure elements produce discrete spectral lines at specific wavelengths. This line spectrum occurs because electrons can only occupy certain allowed energy levels, not arbitrary positions between them. When a hydrogen atom's electron drops from the third energy level (n=3) to the second level (n=2), it always emits light at exactly 656 nanometers, producing the characteristic red line in hydrogen's spectrum. This predictability makes emission spectroscopy invaluable for analytical chemistry.
The Balmer series represents hydrogen's most studied emission pattern, occurring in visible light when electrons transition from higher levels (n≥3) down to n=2. Students preparing for AP Chemistry or college general chemistry courses frequently encounter the Rydberg equation: 1/λ = RH × (1/n1² - 1/n2²), where RH equals 1.097 × 10⁷ m⁻¹. This formula accurately predicts hydrogen's emission wavelengths at 410, 434, 486, and 656 nanometers, corresponding to violet, blue, blue-green, and red light respectively.
Emission spectroscopy drives numerous US industries and research applications. The EPA uses emission spectra to monitor heavy metal contamination in water supplies, while forensic laboratories analyze paint chips and glass fragments by their unique spectral signatures. Astronomers at observatories like Palomar and Mauna Kea identify stellar composition by analyzing starlight emission patterns. Medical laboratories employ atomic emission spectroscopy to measure trace elements in blood samples, helping diagnose mineral deficiencies. Students encountering this concept on the MCAT or in undergraduate analytical chemistry labs learn to interpret these patterns for quantitative elemental analysis.
Related Micro-courses