Loading subject page…


669,501 views


Video Summary: What are Phase Diagrams
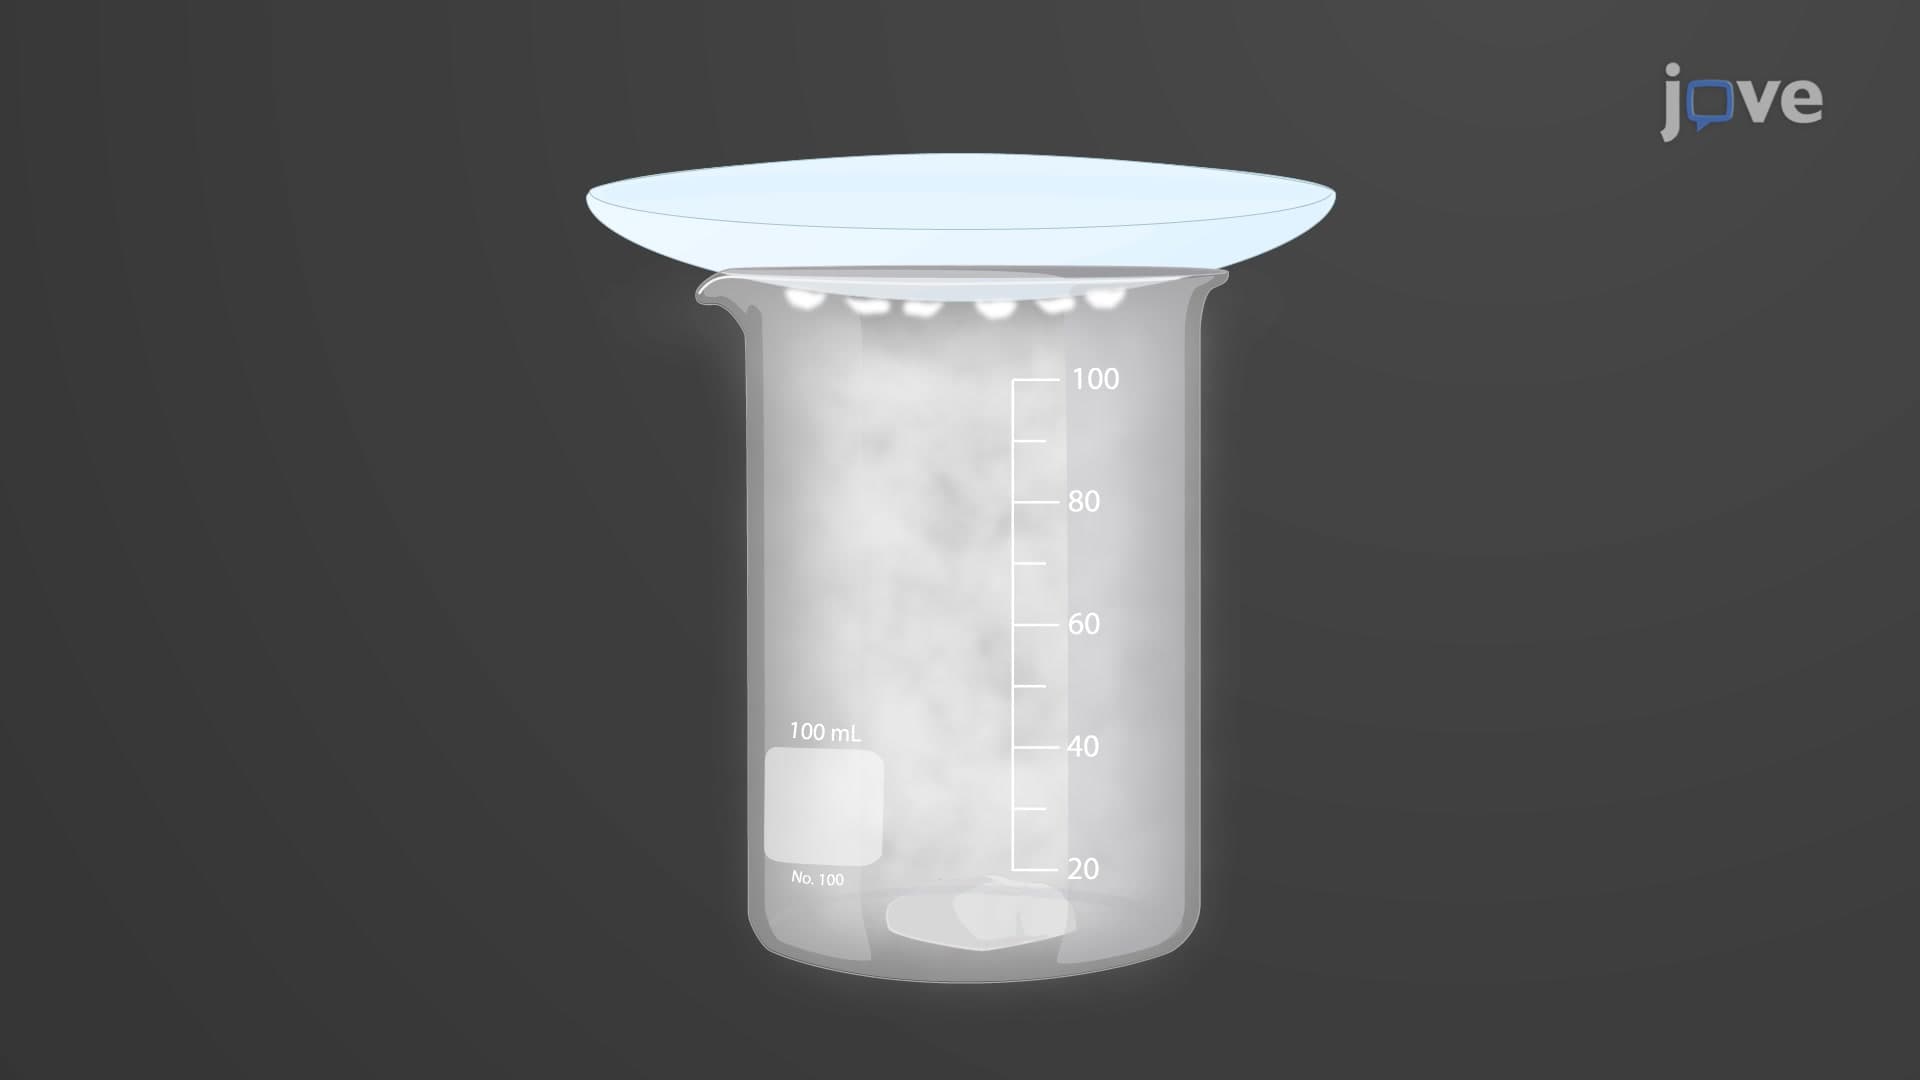
Ever wonder why dry ice "smokes" instead of melting like regular ice? Phase diagrams reveal the fascinating science behind how substances like carbon dioxide behave under different conditions. These powerful tools map out when materials exist as solids, liquids, or gases, helping explain everything from industrial processes at DuPont chemical plants to the sublimation of dry ice used in Halloween fog effects. What are Phase Diagrams becomes clearer when you see how temperature and pressure control these dramatic transformations. Watch the full video on JoVE Coach to master this concept with expert-led visuals and step-by-step explanations.
Phase diagrams serve as roadmaps for understanding matter's behavior under varying conditions. These scientific tools plot temperature against pressure to show where substances exist as solids, liquids, or gases. Think of them as weather maps for molecules, just as meteorologists predict rain or snow based on atmospheric conditions, chemists use phase diagrams to predict physical states based on temperature and pressure.
The concept becomes crucial for students preparing for AP Chemistry exams and college-level physical chemistry courses. Universities like MIT and Stanford extensively cover phase diagrams in their introductory chemistry curricula because they bridge theoretical concepts with practical applications.
Phase diagrams contain three fundamental elements that students must master. Regions represent areas where only one phase exists stably. These single-phase zones are separated by phase boundaries, curves indicating equilibrium between two phases. The intersection points where multiple boundaries meet represent special conditions like triple points and critical points.
For carbon dioxide, the triple point occurs at 5.1 atmospheres and -56.6°C, where solid, liquid, and gas phases coexist. This differs dramatically from water's triple point at much lower pressure. Understanding these differences helps explain why dry ice sublimates at atmospheric pressure while water ice melts, a concept frequently tested on MCAT physical sciences sections.
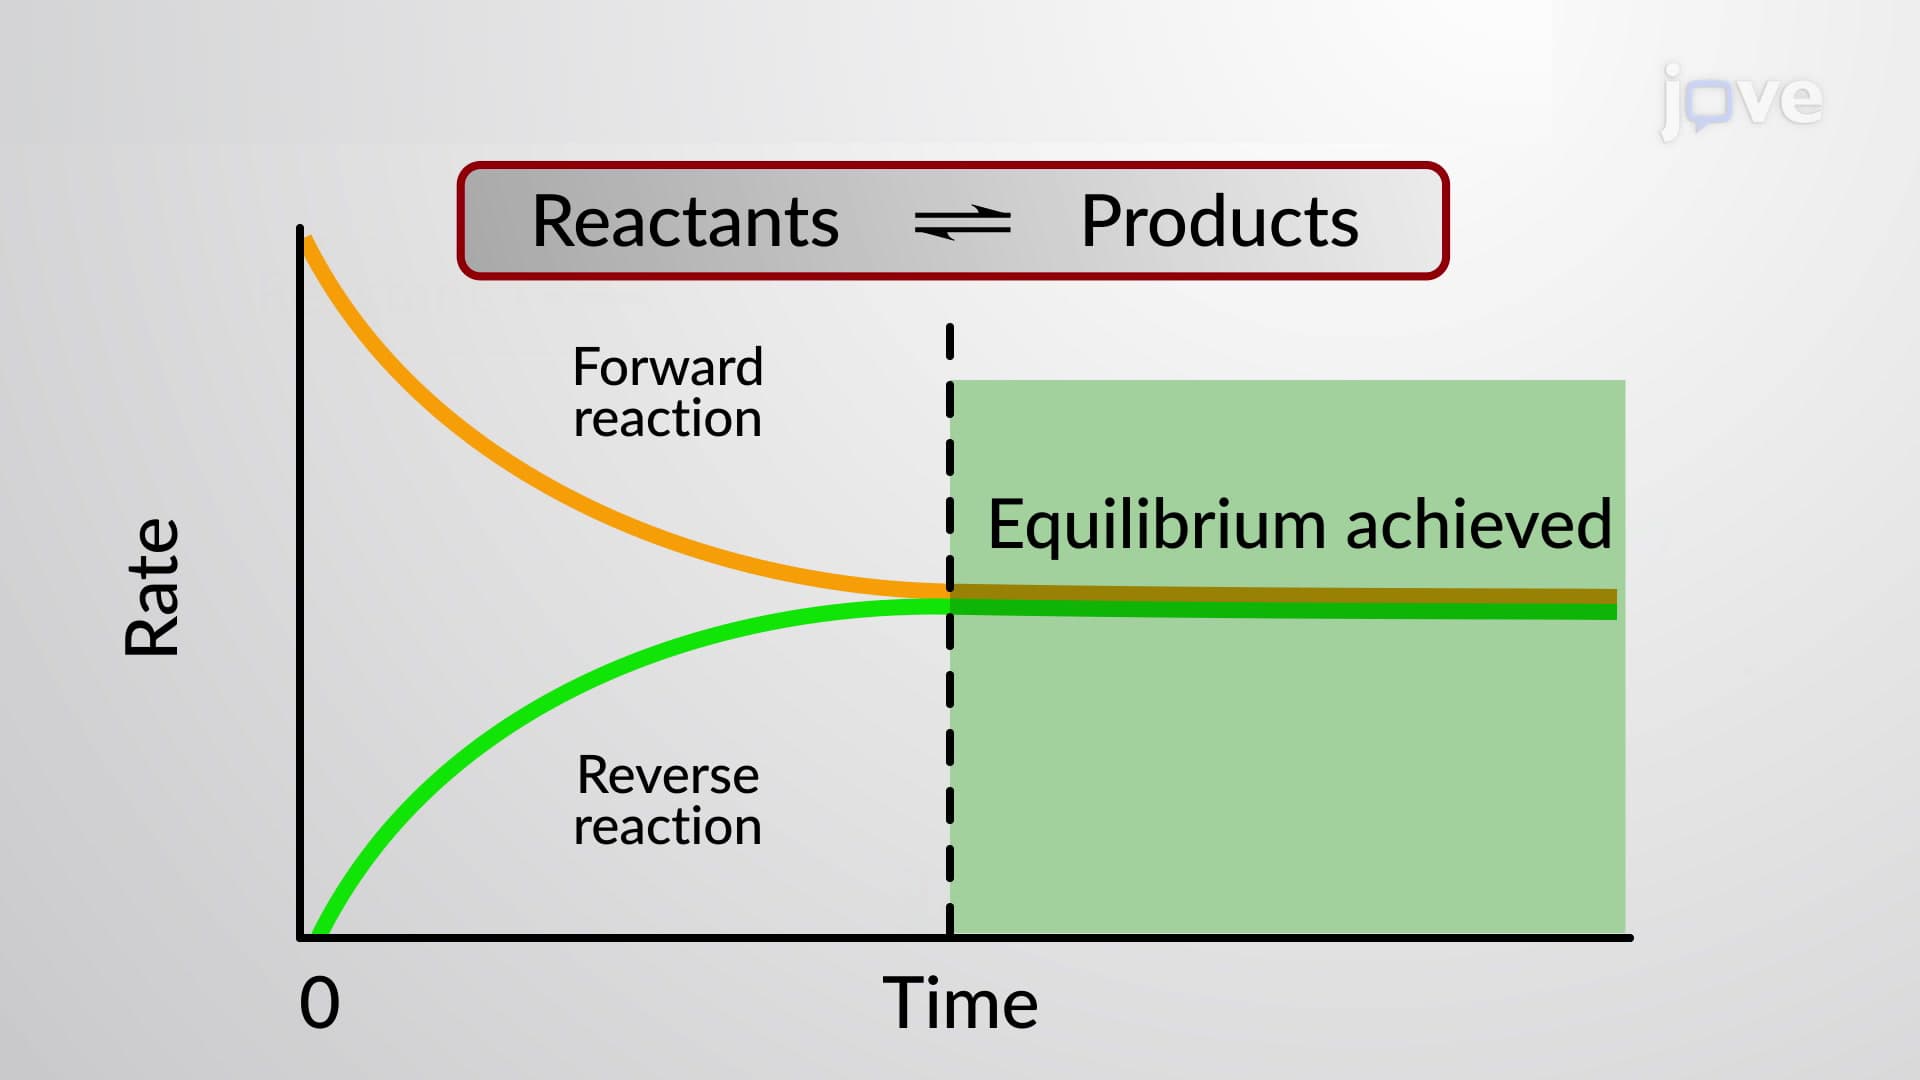
The curves separating regions indicate dynamic equilibrium between phases. Along the sublimation curve, solid and vapor phases exist simultaneously. The vaporization curve shows liquid-gas equilibrium, while the fusion curve represents solid-liquid equilibrium. These aren't static barriers but dynamic zones where molecules constantly transition between phases at equal rates.
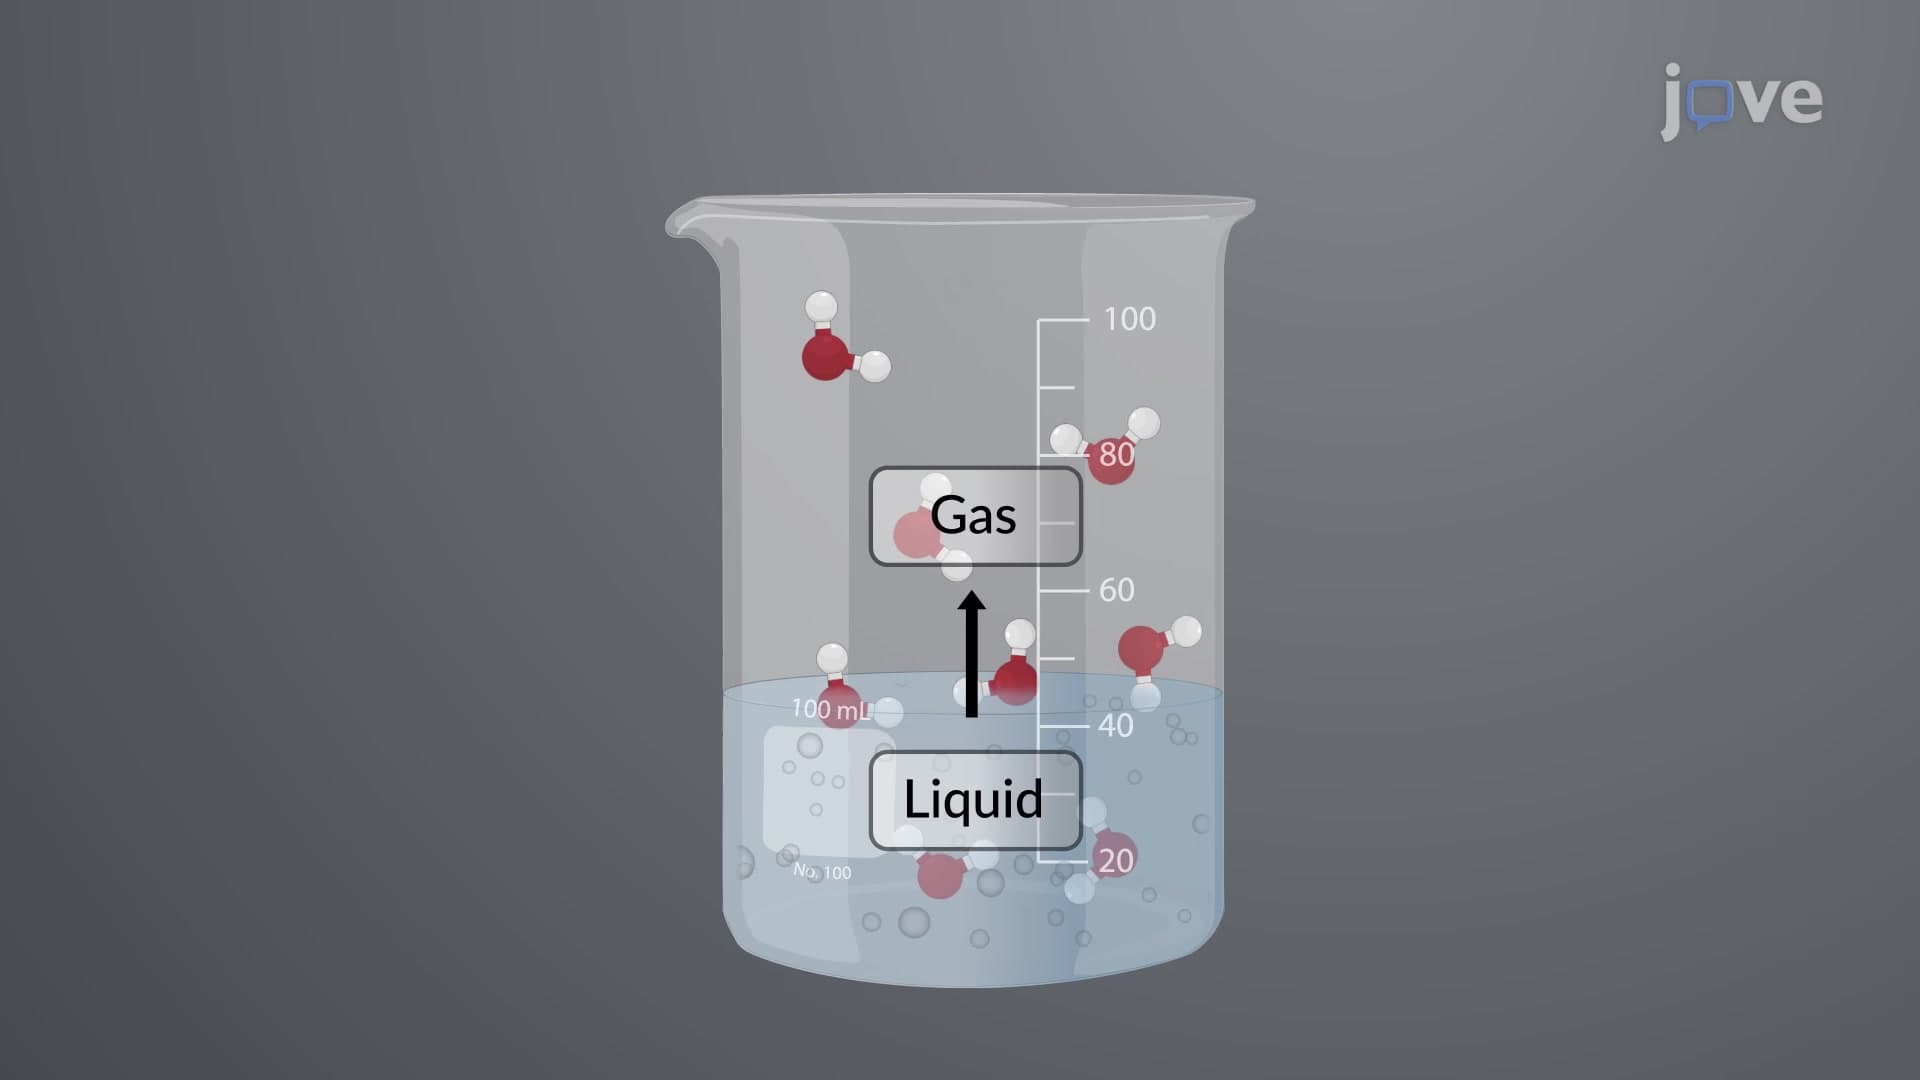
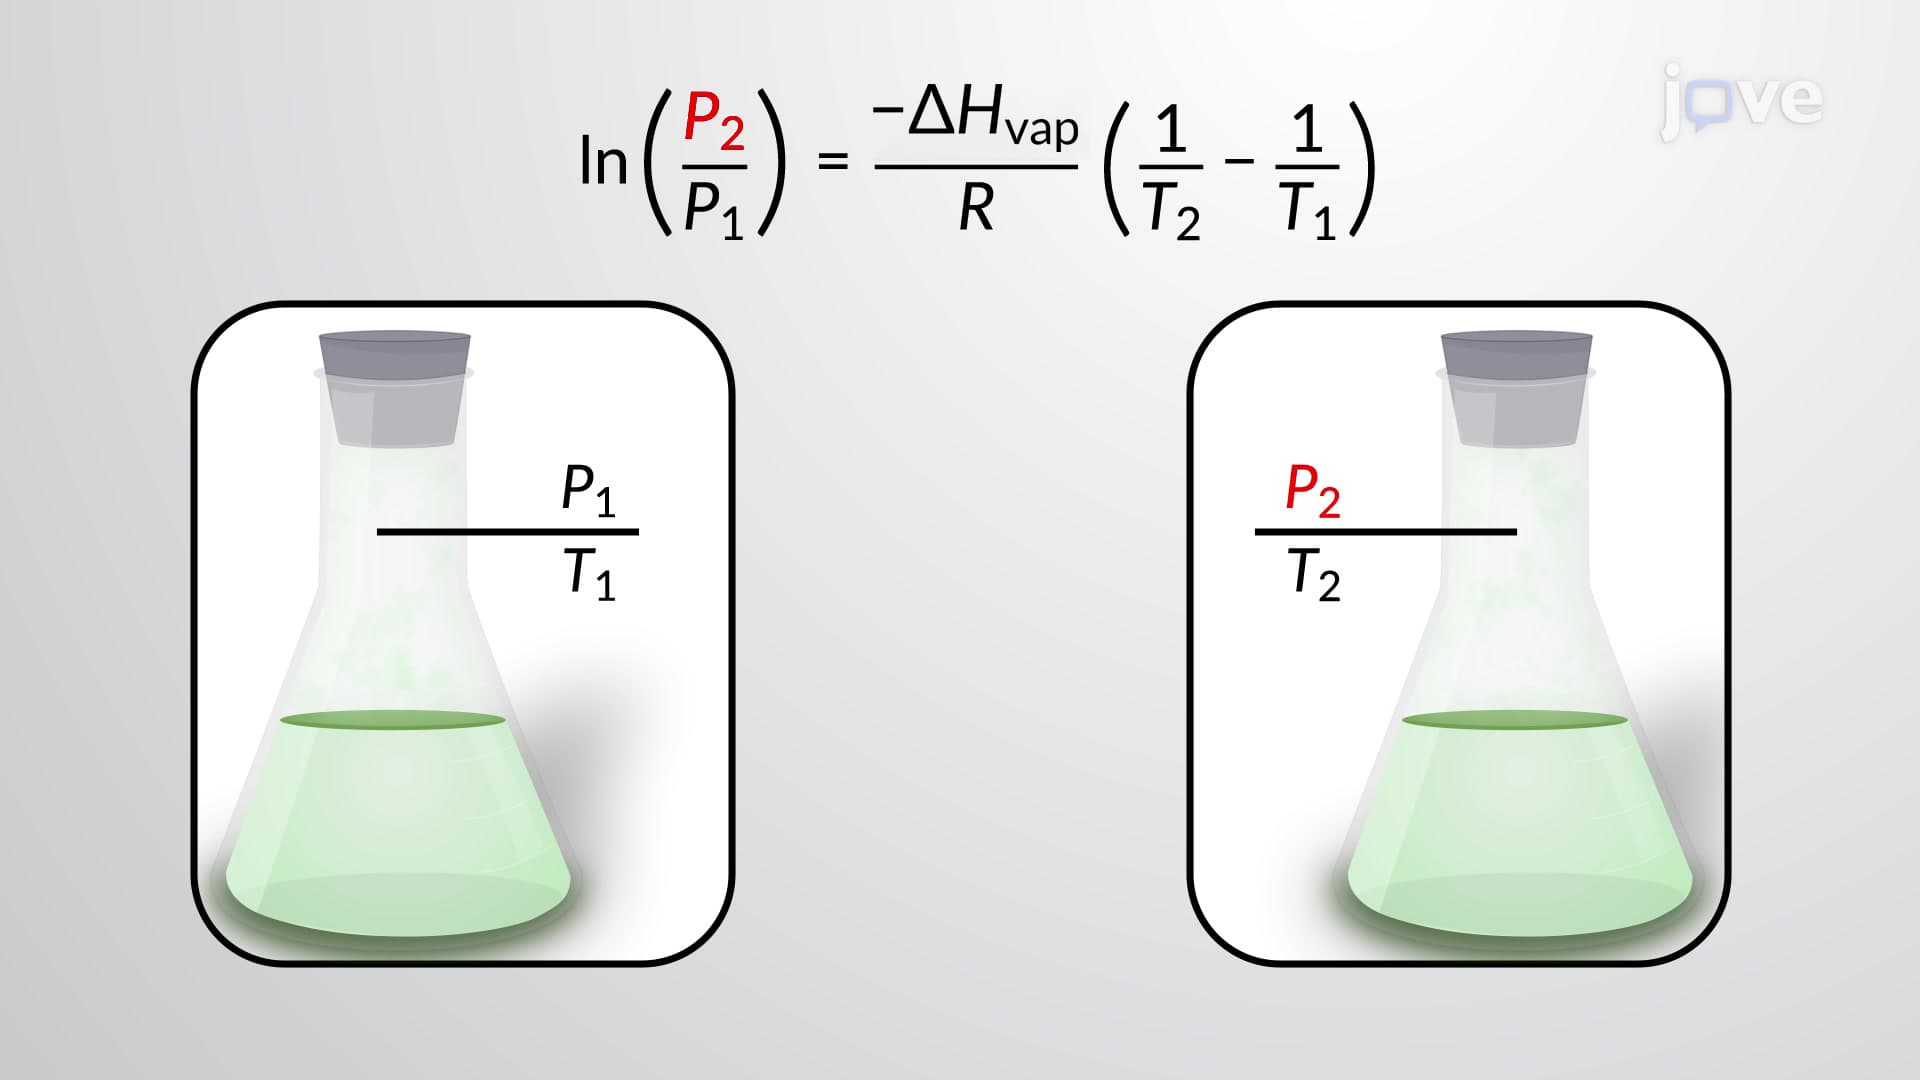
Students often struggle with equilibrium concepts, but real-world examples clarify the principle. Consider a sealed bottle of water at room temperature, liquid water and water vapor coexist in equilibrium. The vapor pressure remains constant until temperature or pressure changes shift the equilibrium position.
Beyond the critical point, phase distinctions disappear entirely. For carbon dioxide, this occurs at 73 atmospheres and 31°C, creating supercritical CO2. This state combines liquid-like density with gas-like viscosity, making it invaluable in industrial applications. Companies like Starbucks use supercritical CO2 for caffeine extraction because it leaves no chemical residues.
Understanding supercritical fluids becomes increasingly important as students advance to engineering programs. Universities emphasize these applications in chemical engineering courses, particularly for sustainable extraction processes and advanced materials synthesis.
Related Micro-courses