Loading subject page…


11,950 views


Video Summary: Statistical Methods for Parametric Data Student S T Test and Goodness of Fit Tests
Did you know that statistical methods for parametric data help determine if a new blood pressure medication actually works better than existing treatments? These powerful analytical tools, including Student's t-test and goodness-of-fit tests, form the backbone of evidence-based medicine and scientific research. From comparing SAT scores between different teaching methods to analyzing clinical trial results at major US medical centers like Johns Hopkins, Statistical Methods for Parametric Data: Student's t-Test and Goodness-of-Fit Tests provide researchers with reliable frameworks for hypothesis testing. Watch the full video on JoVE Coach to master this concept with expert-led visuals and step-by-step explanations.
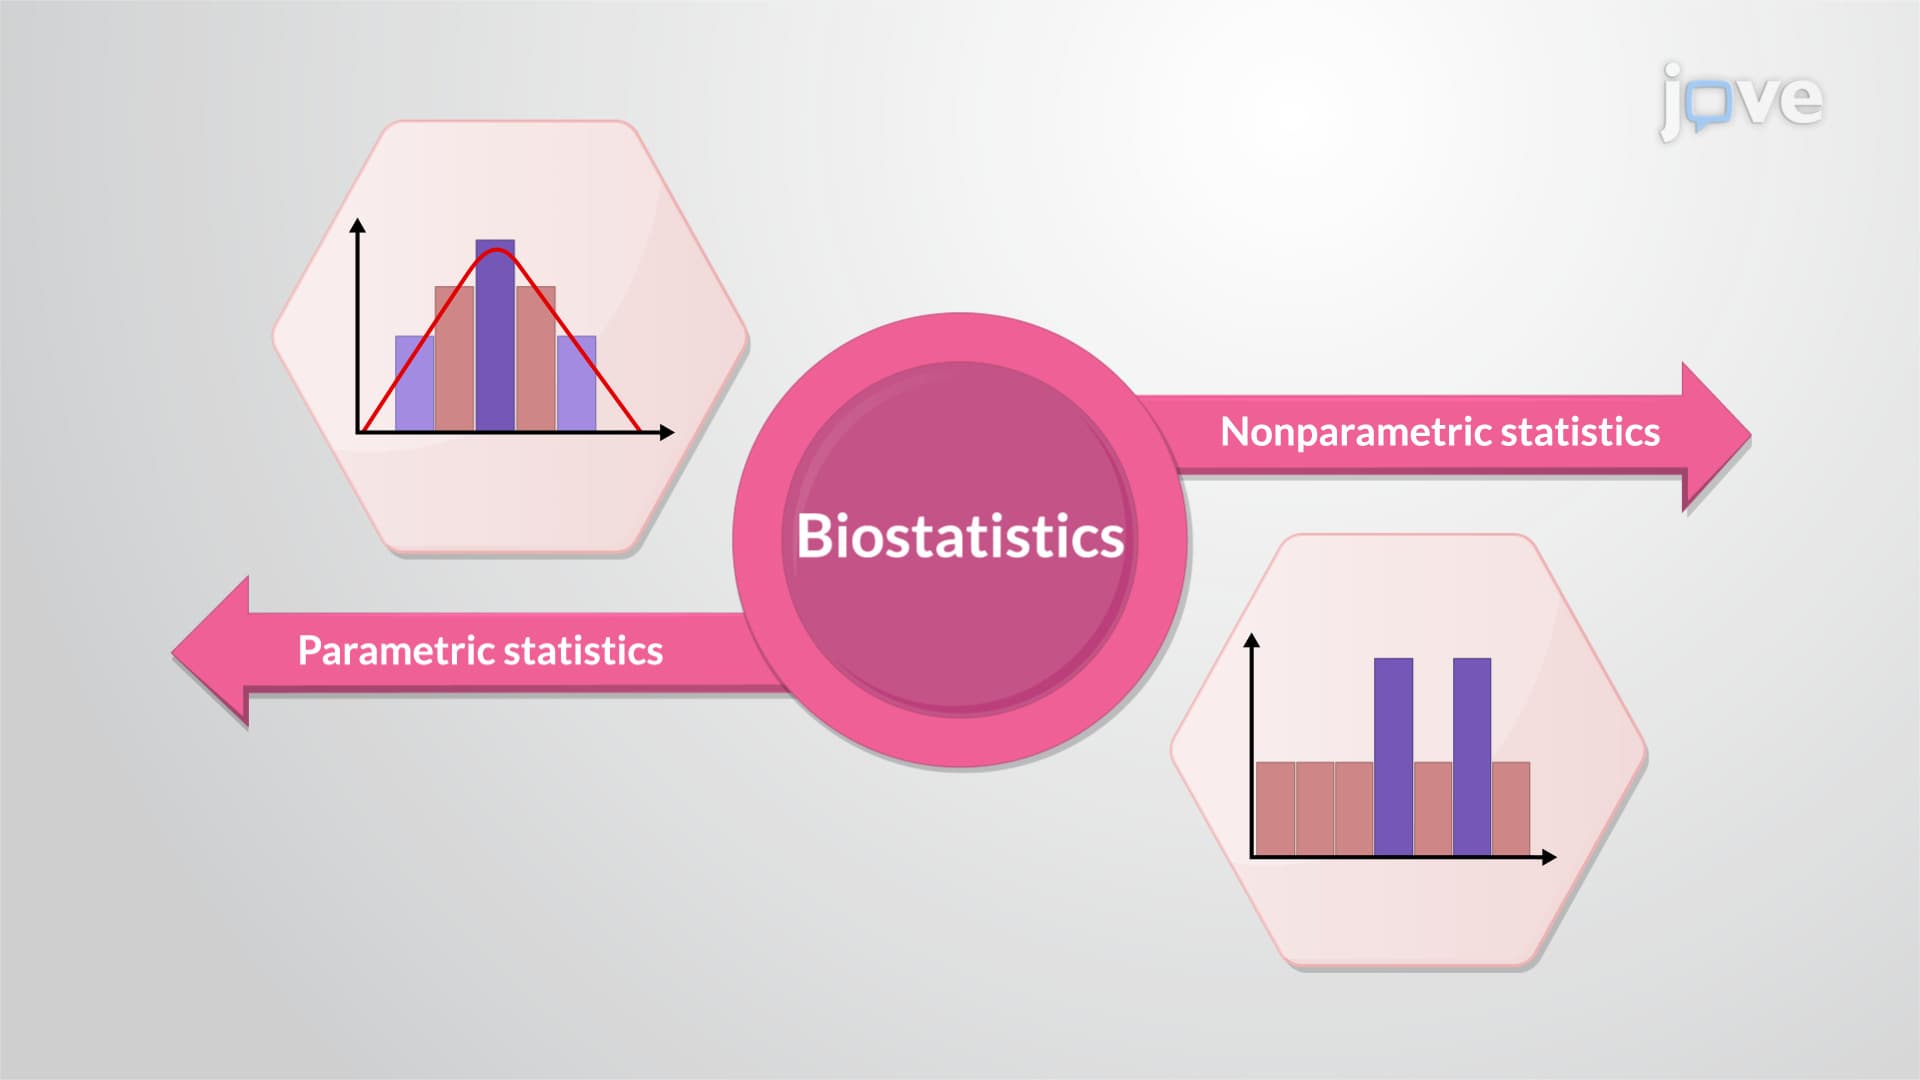
Statistical Methods for Parametric Data: Student's t-Test and Goodness-of-Fit Tests represent fundamental analytical approaches that assume data follows specific probability distributions, most commonly the normal distribution. These methods differ from non-parametric alternatives because they rely on population parameters like mean and standard deviation, making them particularly powerful when their assumptions are met.
Parametric methods excel in situations where data meets certain criteria: normal distribution, adequate sample sizes, and independence of observations. Students preparing for AP Statistics, college statistics courses, or pre-med requirements encounter these concepts as foundational tools for scientific inquiry and research methodology.
The Student's t-test, developed by William Sealy Gosset in the early 1900s, addresses the critical research question: "Are two groups significantly different from each other?" This test comes in three main forms: one-sample t-test (comparing a sample mean to a known population mean), independent samples t-test (comparing means from two separate groups), and paired samples t-test (comparing before-and-after measurements from the same subjects).
Consider a practical example from US healthcare: researchers at the CDC might use an independent samples t-test to compare average cholesterol levels between participants who received a new dietary intervention versus those who maintained their regular eating habits. The test calculates a t-statistic by dividing the difference between group means by the standard error, then compares this value to critical values from the t-distribution to determine statistical significance.
Goodness-of-fit tests serve a different but equally important purpose: determining whether observed data matches expected patterns based on theoretical distributions or hypotheses. The chi-square goodness-of-fit test, the most common variant, compares observed frequencies with expected frequencies across different categories or intervals.
In genetics research at universities like Stanford or MIT, scientists might use goodness-of-fit tests to verify whether offspring ratios in breeding experiments follow predicted Mendelian inheritance patterns. For instance, if crossing two heterozygous organisms should theoretically produce a 3:1 phenotypic ratio, researchers can test whether their observed ratios (perhaps 147:53 instead of the expected 150:50) represent genuine deviations or normal sampling variation.
These statistical methods appear frequently in standardized testing scenarios. MCAT test-takers encounter questions requiring interpretation of t-test results in experimental design passages, while AP Statistics students must demonstrate understanding of both test selection criteria and result interpretation. College biology and psychology majors regularly apply these methods in laboratory courses and research projects, building skills essential for graduate school and professional careers in data-driven fields.
Related Micro-courses