Loading video…


 10 Concepts
 12K views

Video Summary: What Is Data Types and Distribution
Did you know that understanding data types distribution can predict everything from election outcomes to drug effectiveness? When researchers at Johns Hopkins analyze COVID-19 vaccine trials or CDC scientists track disease patterns, they rely on understanding What is Data Types And Distribution to make life-saving decisions. This fundamental biostatistics concept determines how we interpret medical research, from patient blood pressure readings to clinical trial results. Watch the full video on JoVE Coach to master this concept with expert-led visuals and step-by-step explanations.
What is Data Types And Distribution forms the foundation of biostatistical analysis, determining how medical researchers interpret everything from clinical trials to public health surveys. In biostatistics, data represents collected observations ready for analysis, and understanding their types and distributions directly impacts research validity and clinical decision-making.
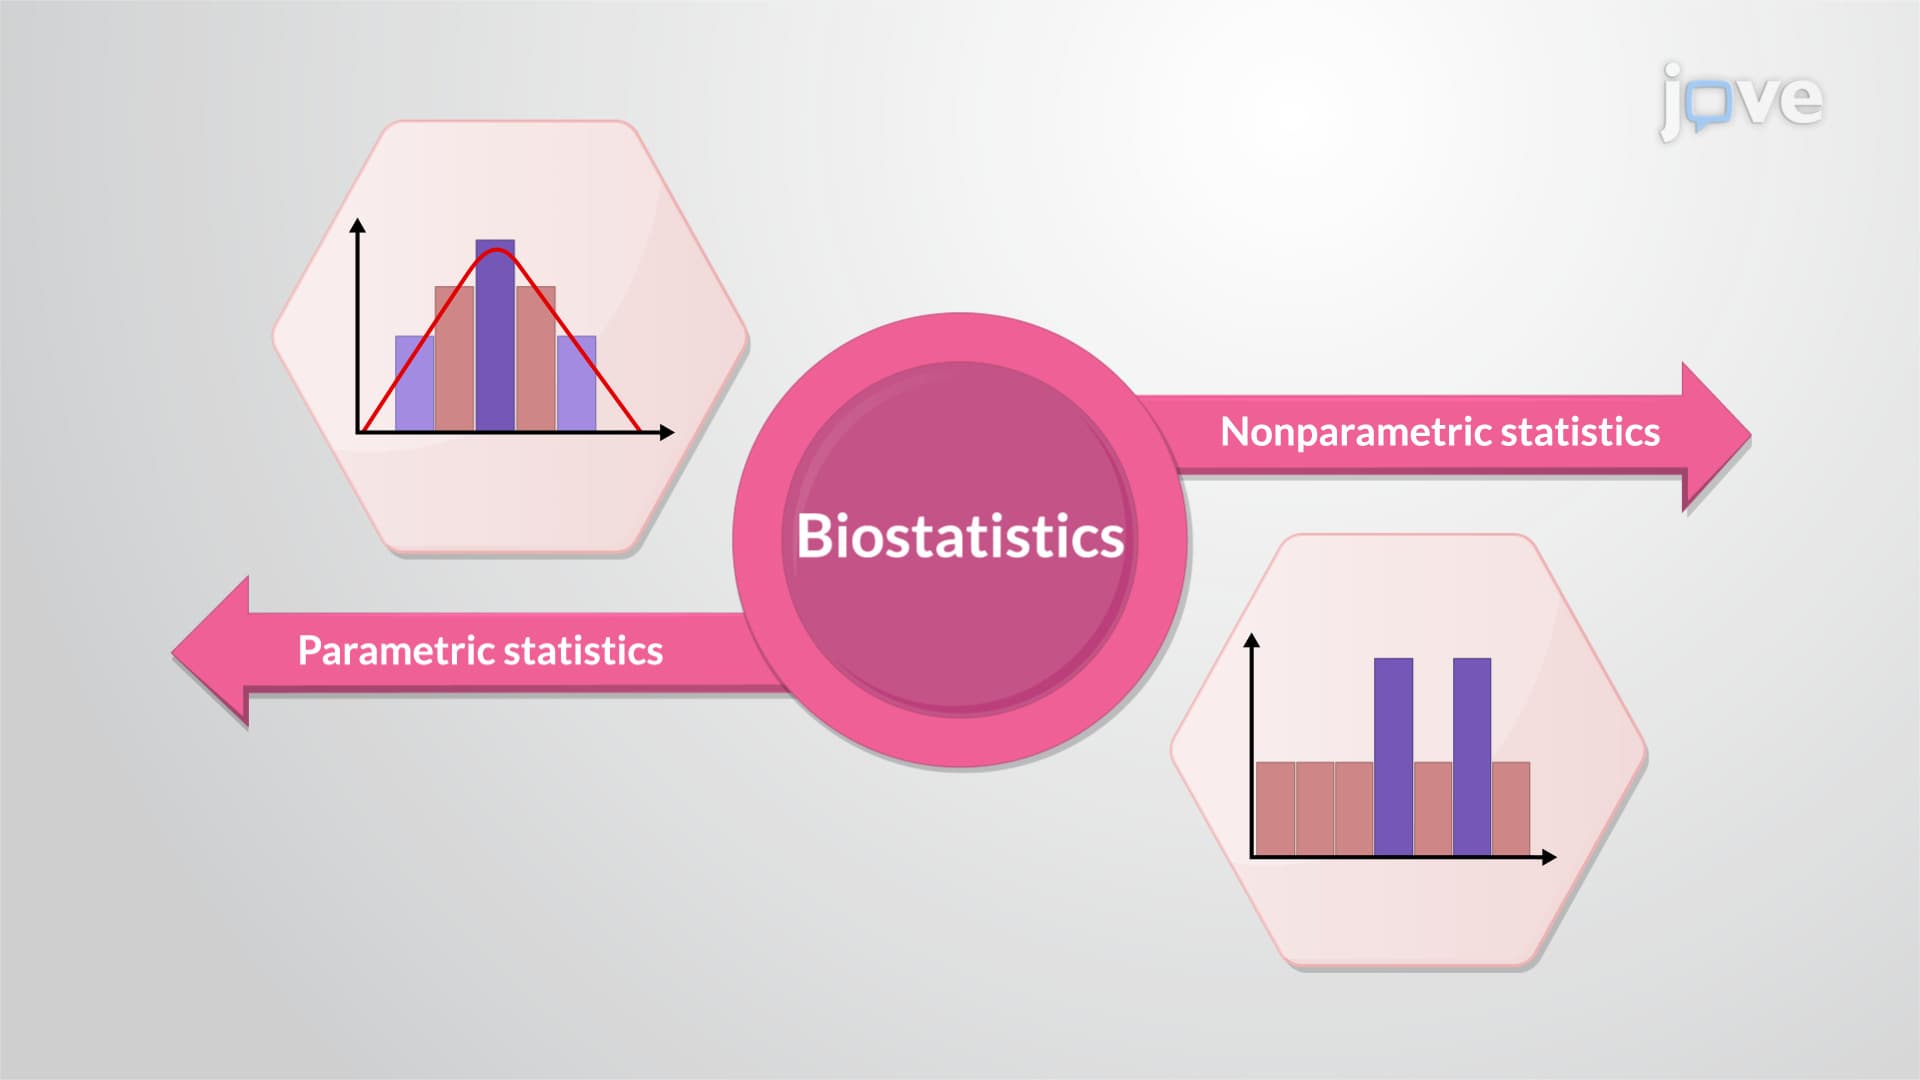
Biostatistical data falls into two primary categories. Nonparametric data doesn't follow specific distribution patterns and includes categorical information. Nominal data represents categories without inherent order-like blood types (A, B, AB, O) or patient gender classifications used in FDA clinical trials. Ordinal data maintains meaningful order, such as pain scale ratings from 1-10 used in hospital patient assessments or cancer staging systems (Stage I through IV).
Parametric or quantitative data assumes specific distribution patterns and includes numerical measurements. Continuous data can take any value within a range-like patient weight measurements in pounds or blood glucose levels in mg/dL used by diabetes researchers at the American Diabetes Association. Discrete data represents countable whole numbers, such as the number of prescribed medications per patient or hospital readmission counts tracked by Medicare.
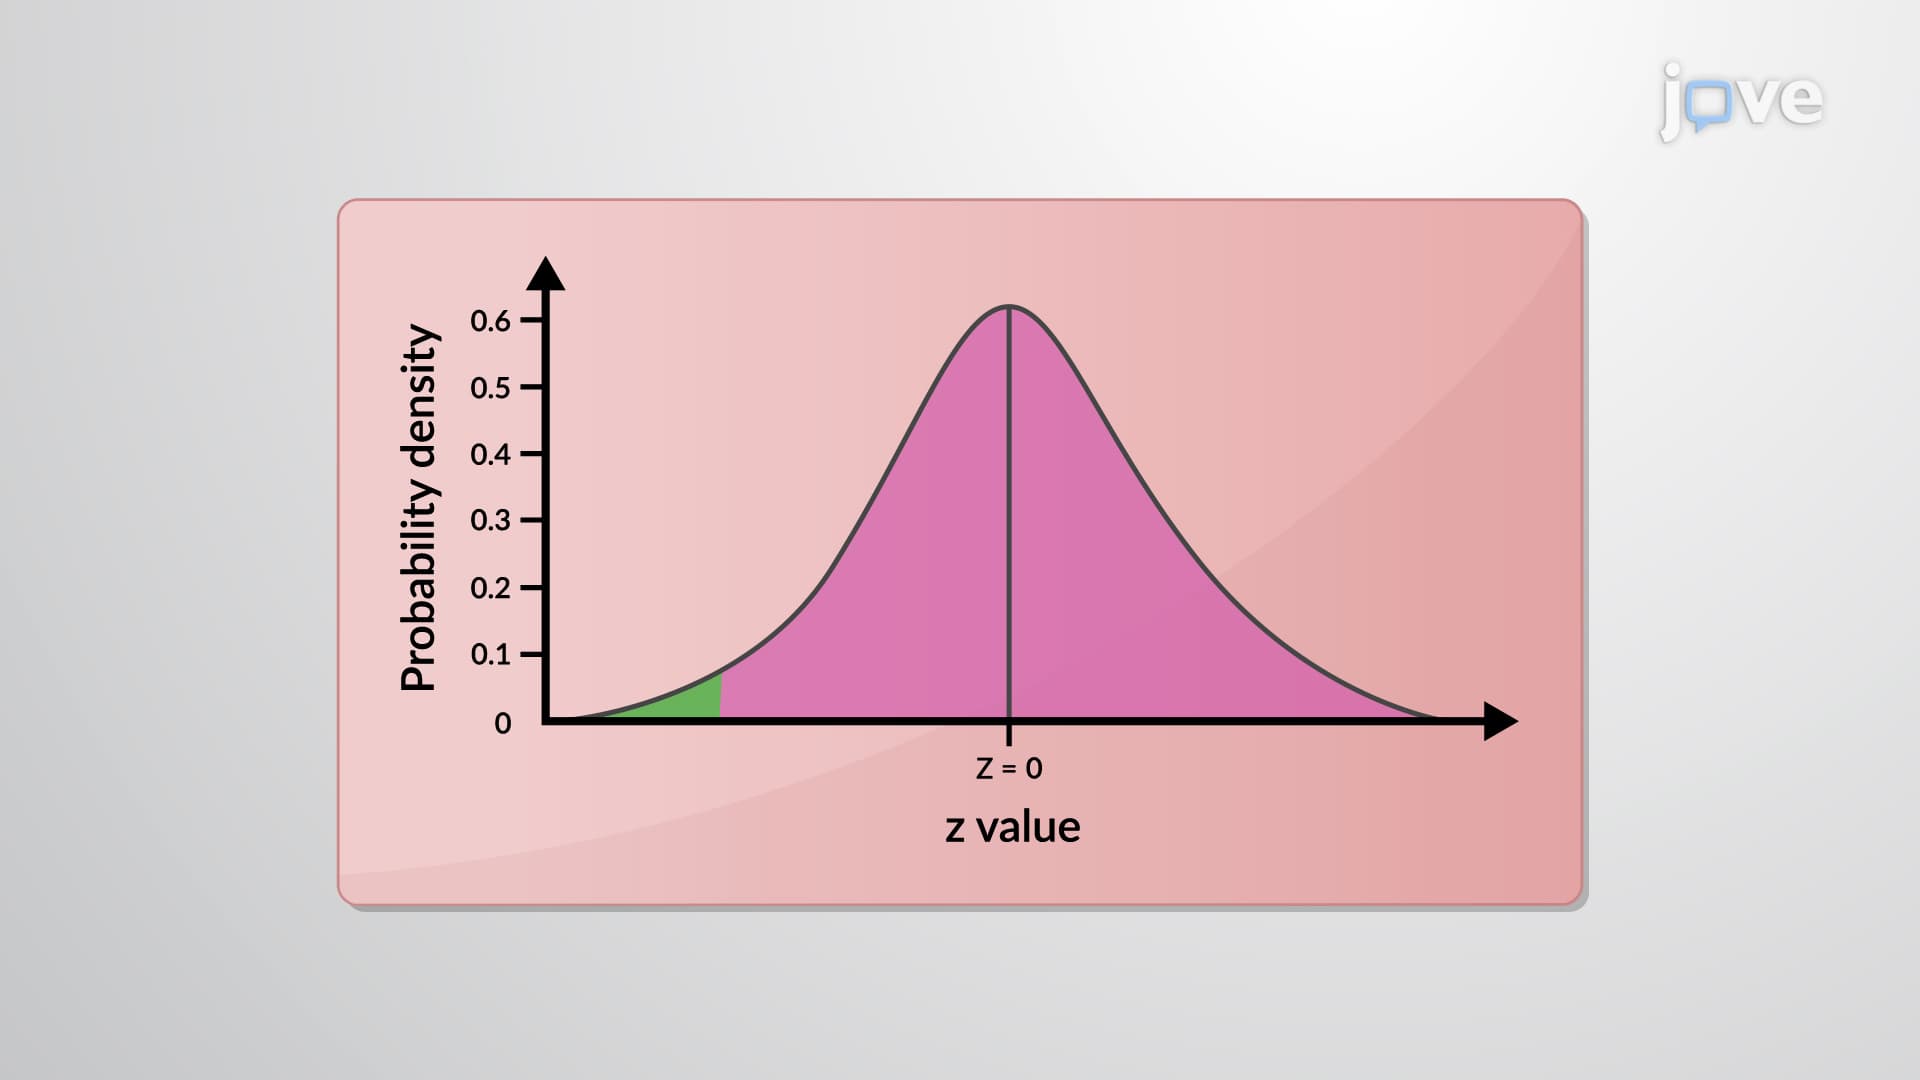
Data types distribution patterns reveal how data points arrange themselves graphically, providing crucial insights for medical analysis. The normal or Gaussian distribution creates a symmetrical bell curve where mean, median, and mode align perfectly. Newborn birth weights in the United States typically follow this pattern, with most babies weighing around 7.5 pounds, and fewer babies at extremely high or low weights. This distribution appears frequently in biological measurements and forms the basis for many statistical tests used in MCAT preparation and medical research.
Skewed distributions show asymmetrical data arrangement around the mean, common in medical and pharmaceutical research. Positive skew creates a long tail extending right, exemplified by drug metabolite concentrations in patient blood-most patients show low concentrations, while few show extremely high levels. This pattern appears in pharmacokinetic studies conducted by companies like Pfizer and Merck.
Negative skew produces a long left tail, demonstrated by branded drug costs in the US healthcare system. Most branded medications cluster at higher price points, with fewer drugs at extremely low costs. Understanding these patterns helps pre-med students excel on the MCAT's data interpretation sections and prepares nursing students for NCLEX questions involving statistical analysis.
Mastering data types and distribution definition explained concepts proves essential for success in AP Statistics, college biostatistics courses, and health science programs across American universities.
Related Micro-courses