Loading concepts…


12 Concepts
10 Concepts
29 Concepts
14 Concepts
15 Concepts
25 Concepts
30 Concepts
12 Concepts
17 Concepts
9 Concepts
7 Concepts
18 Concepts
26 Concepts
9 Concepts
16 Concepts
17 Concepts
17 Concepts
 10 Concepts
 12K Views
 Popular topics




Biostatistics applies statistical methods to analyze healthcare and life science data through rigorous experimental design and analysis. This JoVE Coach micro-course covers essential biostatistics basics healthcare professionals need, from understanding data types and distributions to conducting hypothesis testing and analyzing clinical trial results. Students explore descriptive and inferential statistics, probability distributions, and statistical methods used in US healthcare settings and pharmaceutical research.
1. Variables and Data Classification: Variables form the foundation of biostatistical analysis in healthcare research. Discrete variables include countable medical measurements like number of hospital admissions or presence of genetic markers. Continuous variables encompass measurable ranges such as patient blood pressure, cholesterol levels, or medication dosages. Understanding dependent variables (patient outcomes affected by treatments) versus independent variables (treatment types or patient demographics) helps researchers establish cause-and-effect relationships in clinical studies. Random variables introduce uncertainty elements, such as disease occurrence probability or treatment response rates in diverse patient populations.
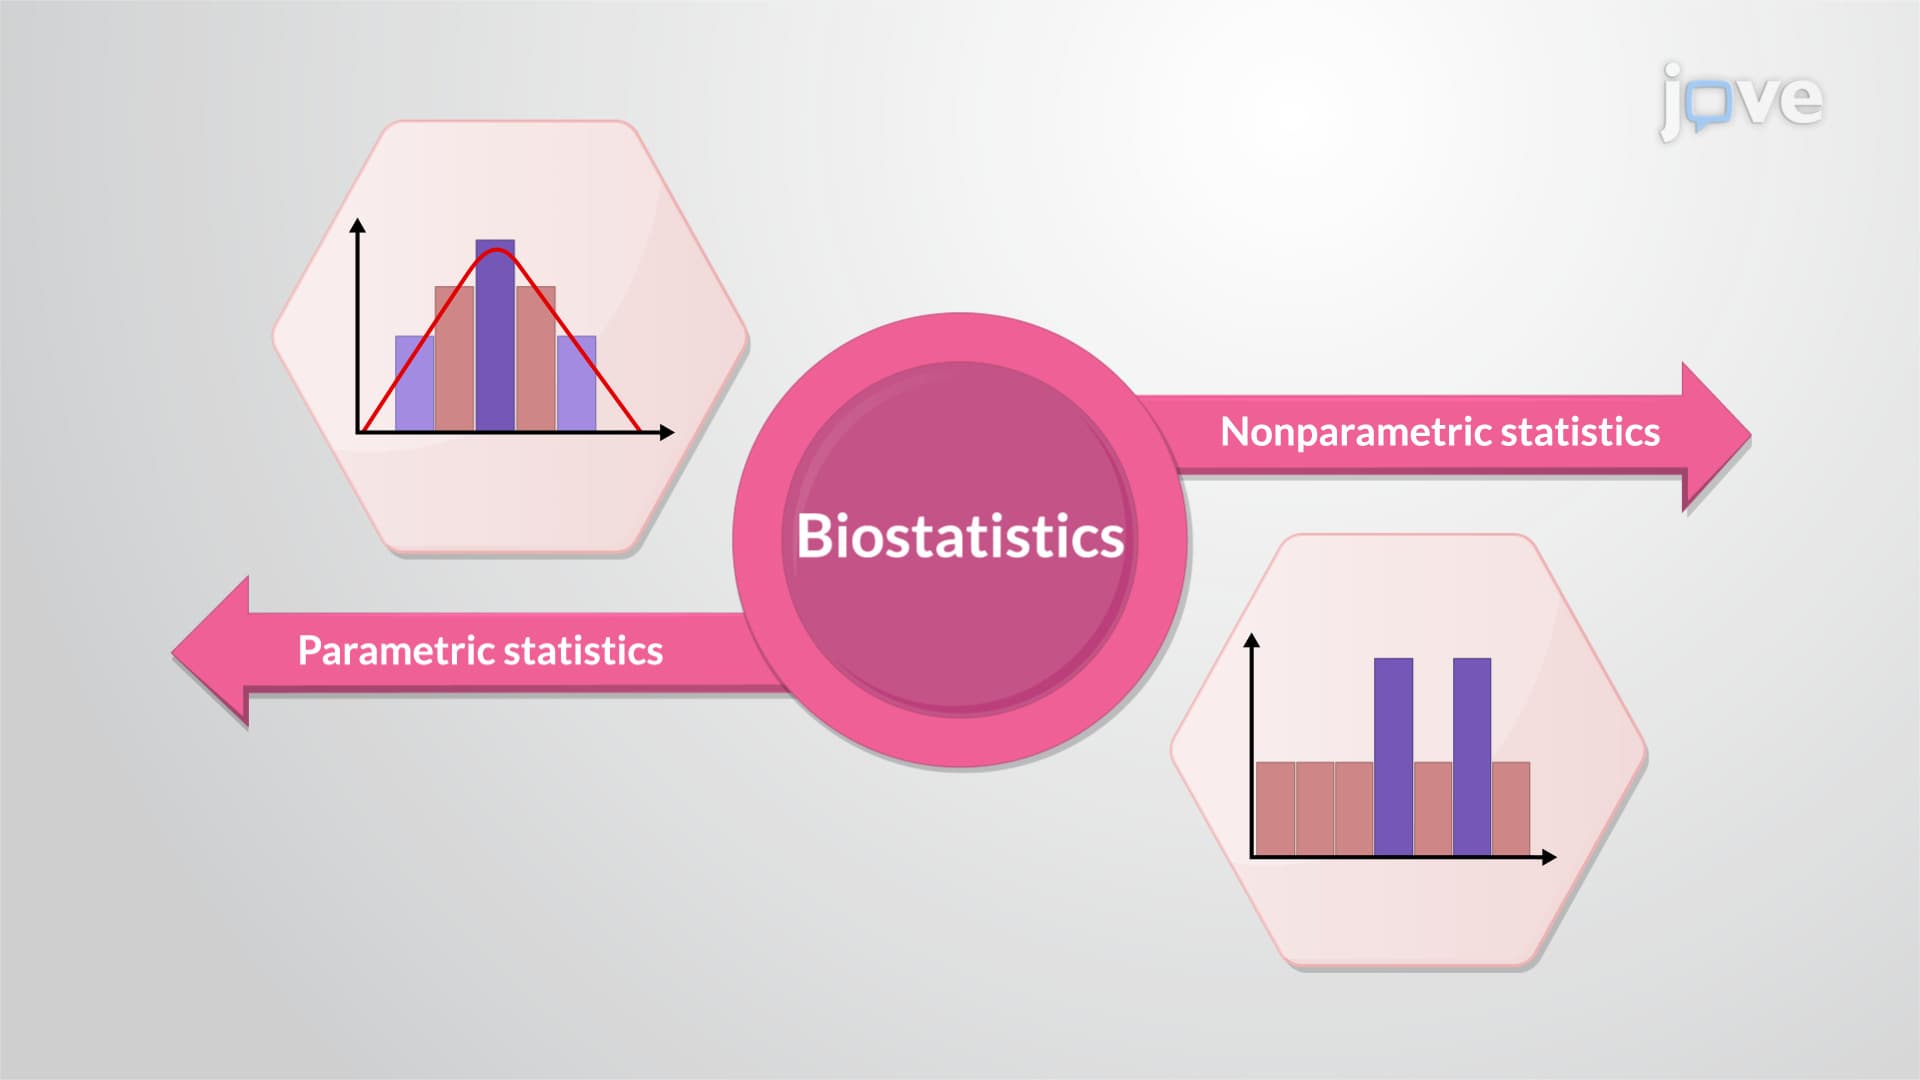
2. Data Types and Distributions: Healthcare data falls into parametric and nonparametric categories, each requiring different analytical approaches. Parametric data follows specific distribution patterns, including continuous measurements like patient weight or discrete counts like pill quantities. Nonparametric data includes categorical information such as patient gender (nominal) or pain severity ratings (ordinal). Normal distributions appear frequently in biological measurements like birth weights, while skewed distributions characterize medication concentrations or healthcare costs. Recognizing distribution patterns helps healthcare researchers choose appropriate statistical tests for accurate clinical decision-making.
3. Measures of Central Tendency: Central tendency measures describe typical values in healthcare datasets, providing essential insights for clinical practice. The arithmetic mean calculates average values like patient ages or treatment response times, though extreme outliers can skew results. Median values prove more reliable for skewed datasets, such as hospital length-of-stay data. Mode identifies the most frequently occurring values, useful for categorical medical data like most common symptoms. Midrange calculations help establish normal parameter ranges for diagnostic tests, supporting evidence-based medical decisions in diverse clinical settings.
4. Measures of Variability: Variability measures quantify data spread and uncertainty in medical research, crucial for understanding treatment effectiveness and patient diversity. Range calculations show the span between minimum and maximum values in clinical measurements. Standard deviation and variance measure how individual patient responses differ from average treatment outcomes. Confidence intervals provide probability ranges for population parameters, such as estimating true mean blood pressure from sample data. Coefficient of variation allows comparison between different measurement scales, helping clinicians compare variability across diverse patient groups or treatment protocols.
5. Statistical Hypothesis Testing: Hypothesis testing provides systematic frameworks for evaluating medical claims and treatment effectiveness. Null hypotheses assume no significant differences between treatment groups, while alternative hypotheses propose meaningful clinical effects. Statistical significance testing helps determine whether observed differences in patient outcomes represent real treatment effects or random variation. Applications include comparing new drug effectiveness against existing treatments, examining relationships between lifestyle factors and disease outcomes, and evaluating diagnostic test accuracy. Proper hypothesis testing ensures evidence-based medical decisions and validates clinical research findings.
6. Statistical Errors and Study Accuracy: Understanding statistical errors prevents misinterpretation of medical research and diagnostic test results. Type I errors involve incorrectly concluding a treatment works when it doesn't, potentially leading to ineffective therapies. Type II errors miss real treatment effects, possibly overlooking beneficial interventions. Alpha levels (typically 0.05) control Type I error probability, while beta levels and statistical power (usually 80% minimum) manage Type II error risks. Study accuracy measures how closely results match true population values, while precision indicates result reproducibility. Recognizing systematic errors and bias sources helps healthcare professionals critically evaluate research quality.
7. Parametric Statistical Methods: Parametric methods assume data follows specific distributions, enabling powerful statistical analyses in clinical research. ANOVA compares means across multiple treatment groups, using F-statistics to identify significant differences in patient outcomes. One-way ANOVA examines single factors like comparing three different medications, while two-way ANOVA evaluates multiple variables simultaneously, such as treatment effects across different age groups and genders. Student t-tests compare means between two groups, commonly used in clinical trials comparing treatment versus control groups. Goodness-of-fit tests verify whether observed data matches expected theoretical distributions, validating genetic inheritance patterns or diagnostic test performance.
8. Biopharmaceutical Study Design: Study design quality directly impacts the reliability and applicability of medical research findings. Controlled studies use comparison groups with techniques like placebo controls, historical controls, or crossover designs to minimize bias and external influences. Blinding procedures, including single-blind, double-blind, and double-dummy methods, prevent participant and investigator bias from affecting results. Internal validity ensures study execution quality, while external validity determines whether findings apply to broader populations. Risk calculations, including absolute and relative risk measures, odds ratios, and hazard ratios, quantify exposure-outcome relationships essential for clinical decision-making and public health policy development.