Loading subject page…


12 Concepts
10 Concepts
29 Concepts
14 Concepts
15 Concepts
25 Concepts
30 Concepts
12 Concepts
17 Concepts
9 Concepts
7 Concepts
18 Concepts
26 Concepts
9 Concepts
16 Concepts
17 Concepts
17 Concepts
 16 Concepts
 3.5K Views
 Popular topics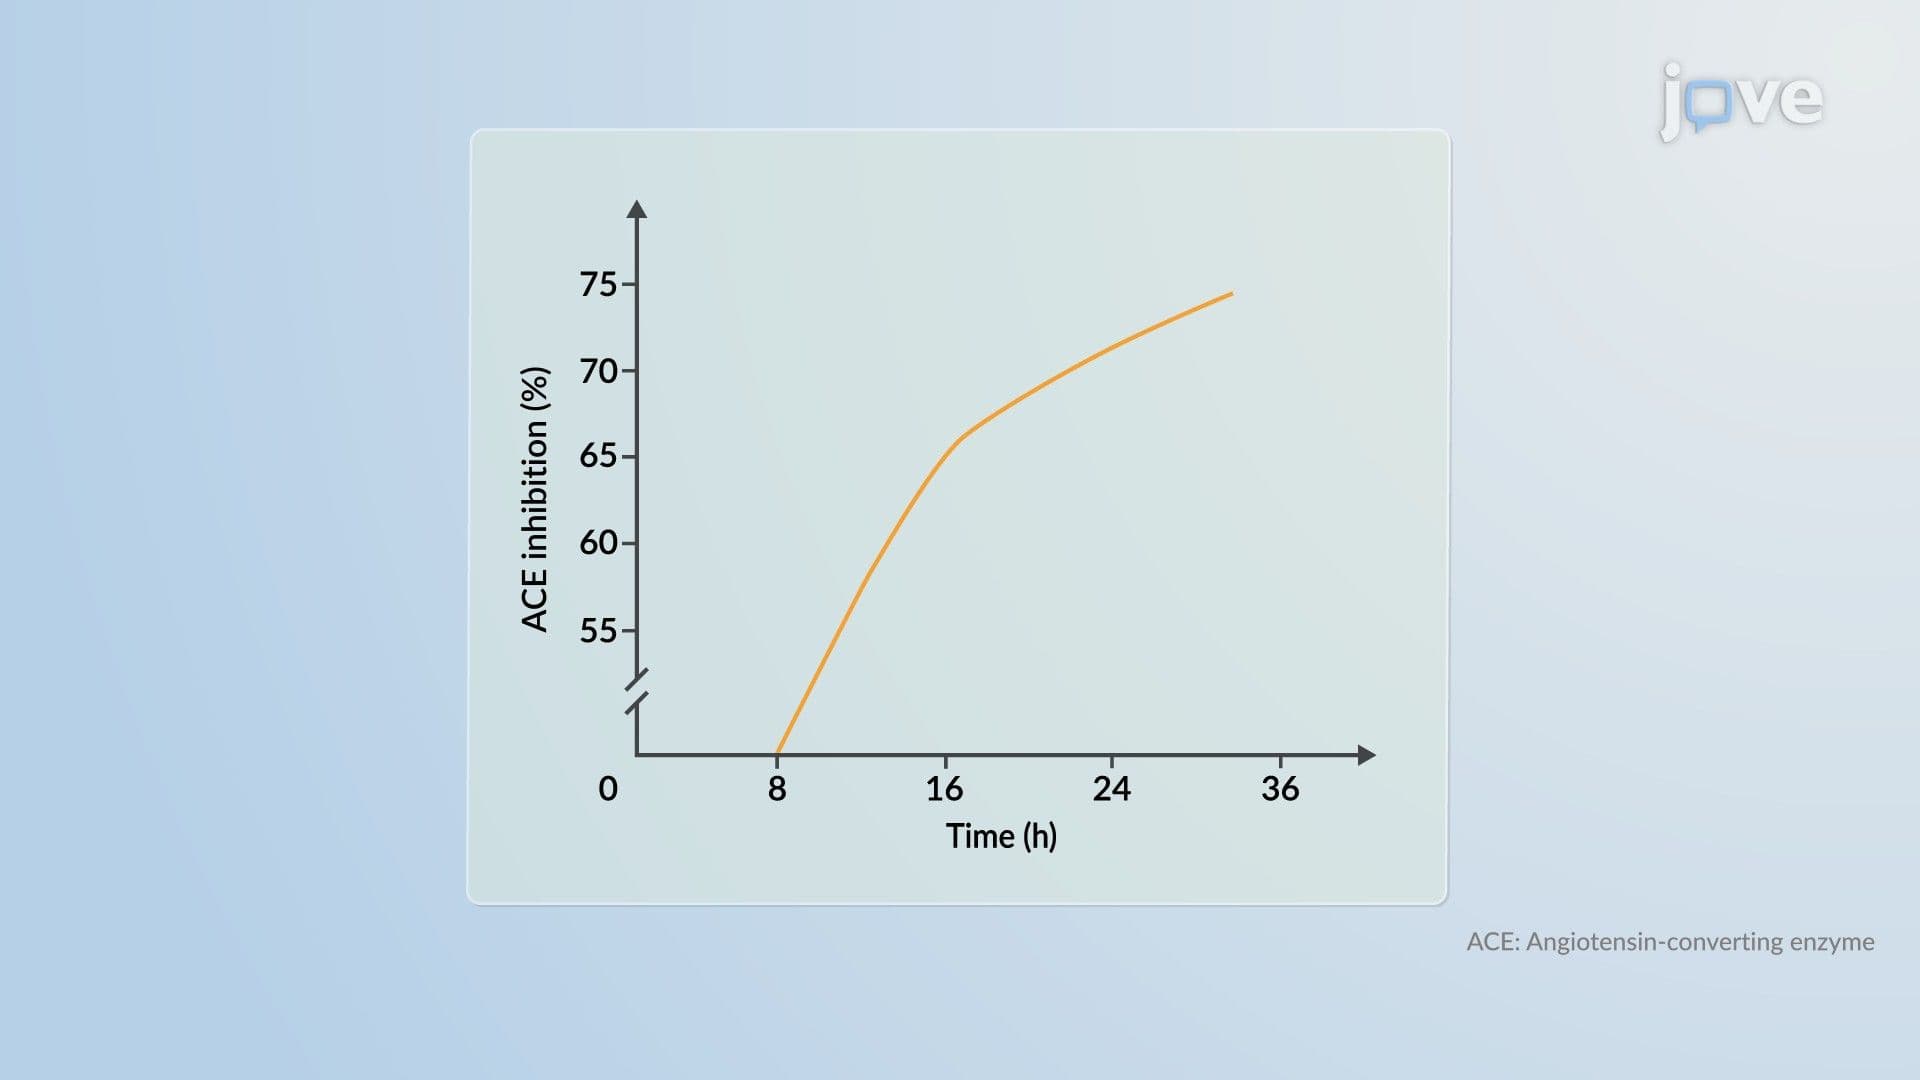
The PK/PD relationship is the scientific foundation connecting how a drug moves through the body to the effects it produces, knowledge that directly informs smarter dosing decisions and safer patient outcomes. For professionals overseeing clinical or pharmaceutical teams, understanding this relationship prevents costly misjudgments in drug development and regulatory strategy. JoVE Coach delivers this through clear, application-focused instruction built for busy practitioners.
1. Exposure, Response, and Effect in the PK/PD Relationship
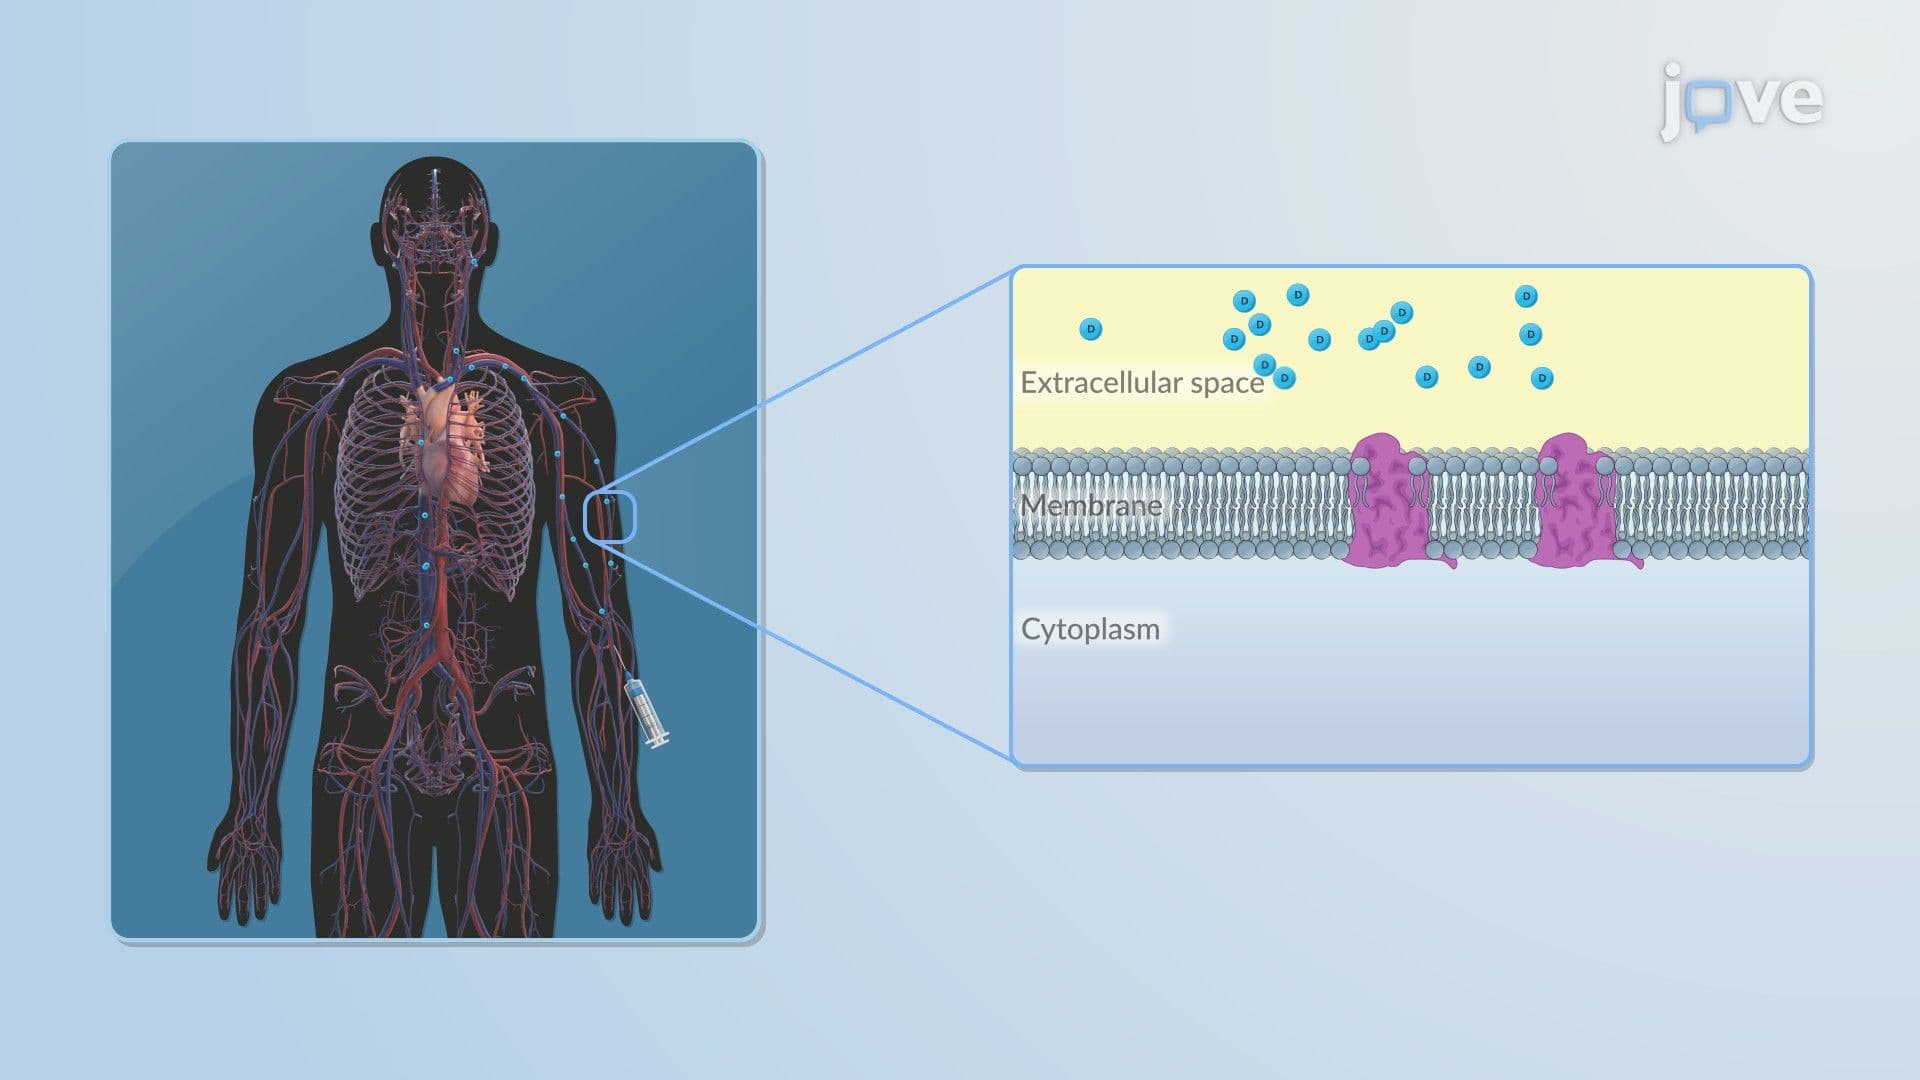
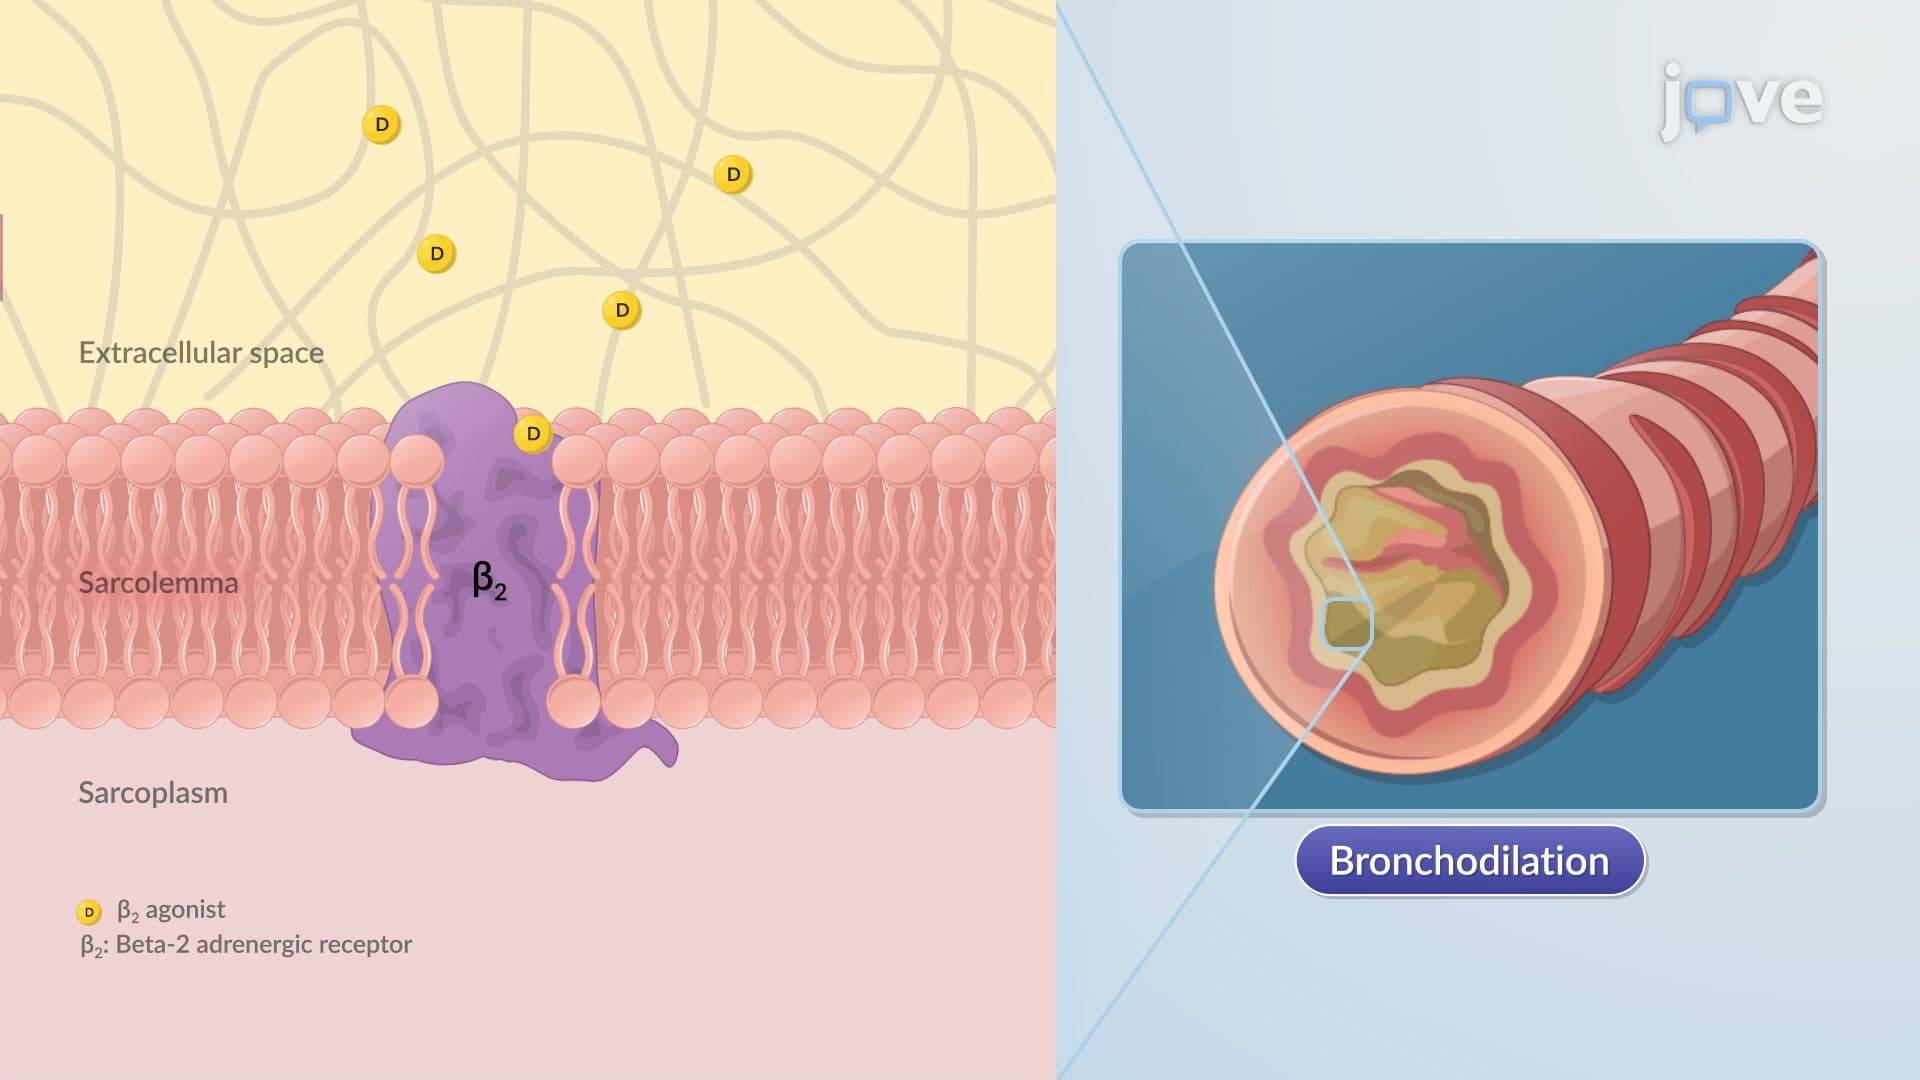
The PK/PD relationship bridges drug exposure, a pharmacokinetic property, with measurable pharmacological outcomes. Exposure quantifies how much drug the body encounters, whether through administered dose or plasma concentration. Response describes the observable pharmacological outcome, which may be therapeutic or adverse. Effect captures the quantifiable biological change over time, measured through biomarkers such as receptor occupancy, enzyme inhibition percentages, or physiological parameters like blood pressure. For a regulatory scientist reviewing antihypertensive data, understanding that a 10 mmHg reduction in diastolic blood pressure represents the effect, not simply the drug's presence, sharpens how evidence is framed, interpreted, and communicated to decision-making stakeholders.
2. From Dose to Pharmacological Effect
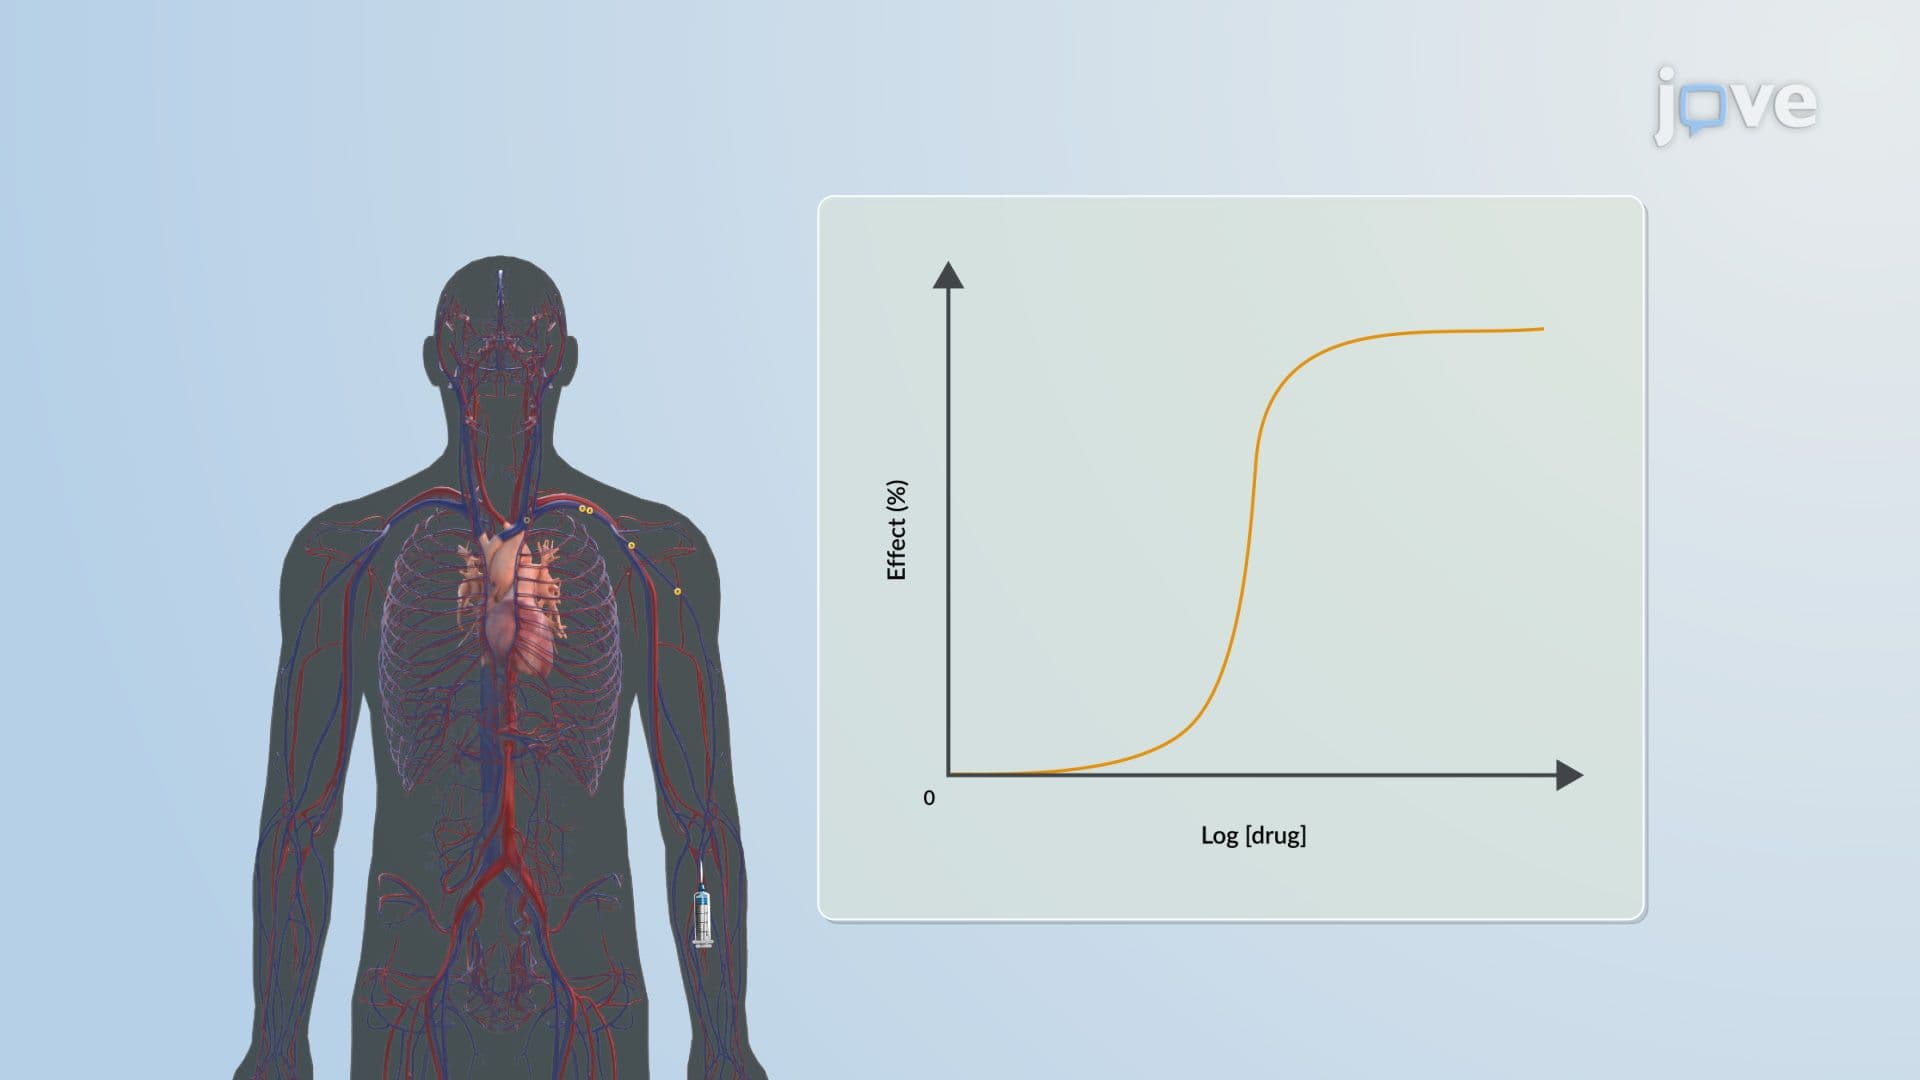
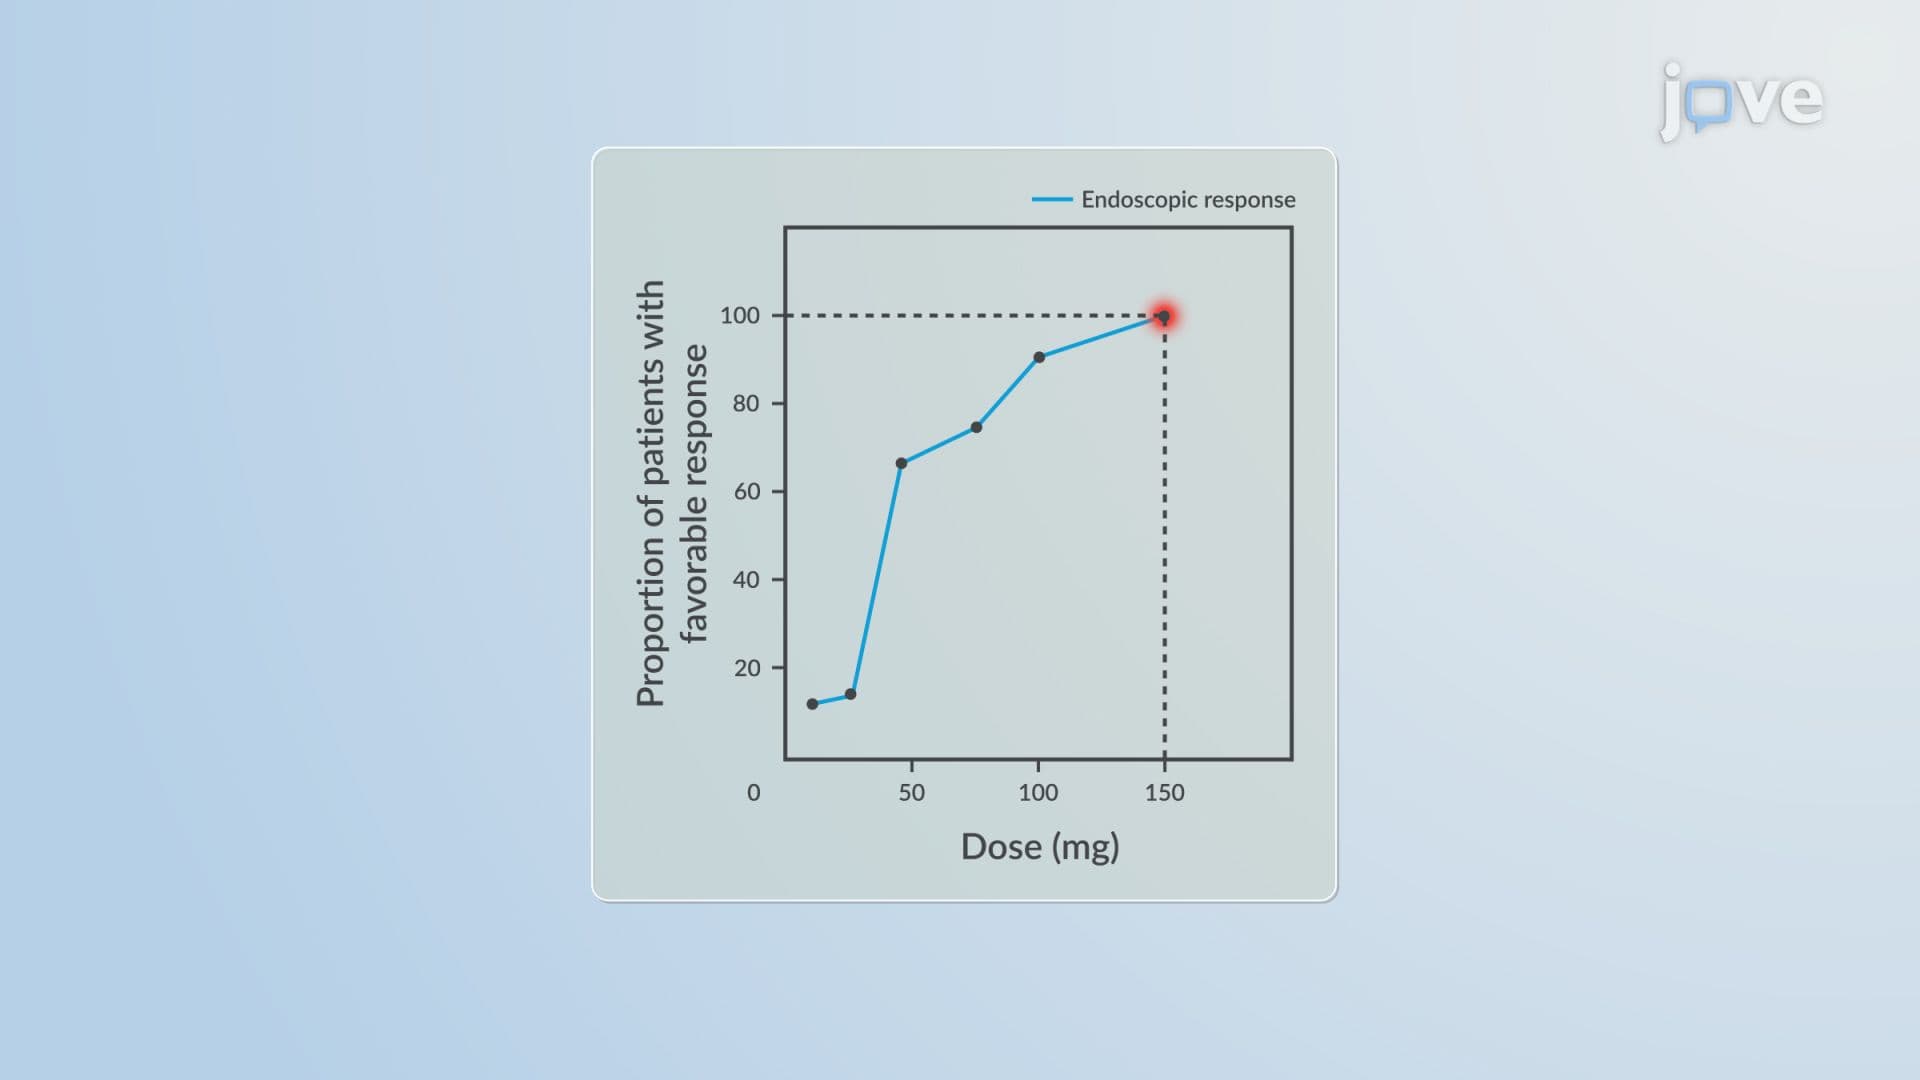
A drug's dosage and pharmacokinetic properties jointly govern the onset, intensity, and duration of pharmacological action. Higher doses increase receptor site concentration, producing hyperbolic dose-response curves that become sigmoidal on a log-linear scale. For one-compartment drugs, pharmacological response tracks proportionally with the log of plasma concentration, declining linearly over time. The slope of this decline reflects how quickly a drug loses effect, a steeper slope demands more frequent dosing. A development team evaluating dosing frequency must grasp this relationship to avoid under-dosing, where patients fall below effective concentrations, or over-dosing, where toxicity risk escalates unnecessarily.
3. Duration and Intensity of the Dose-Effect Relationship
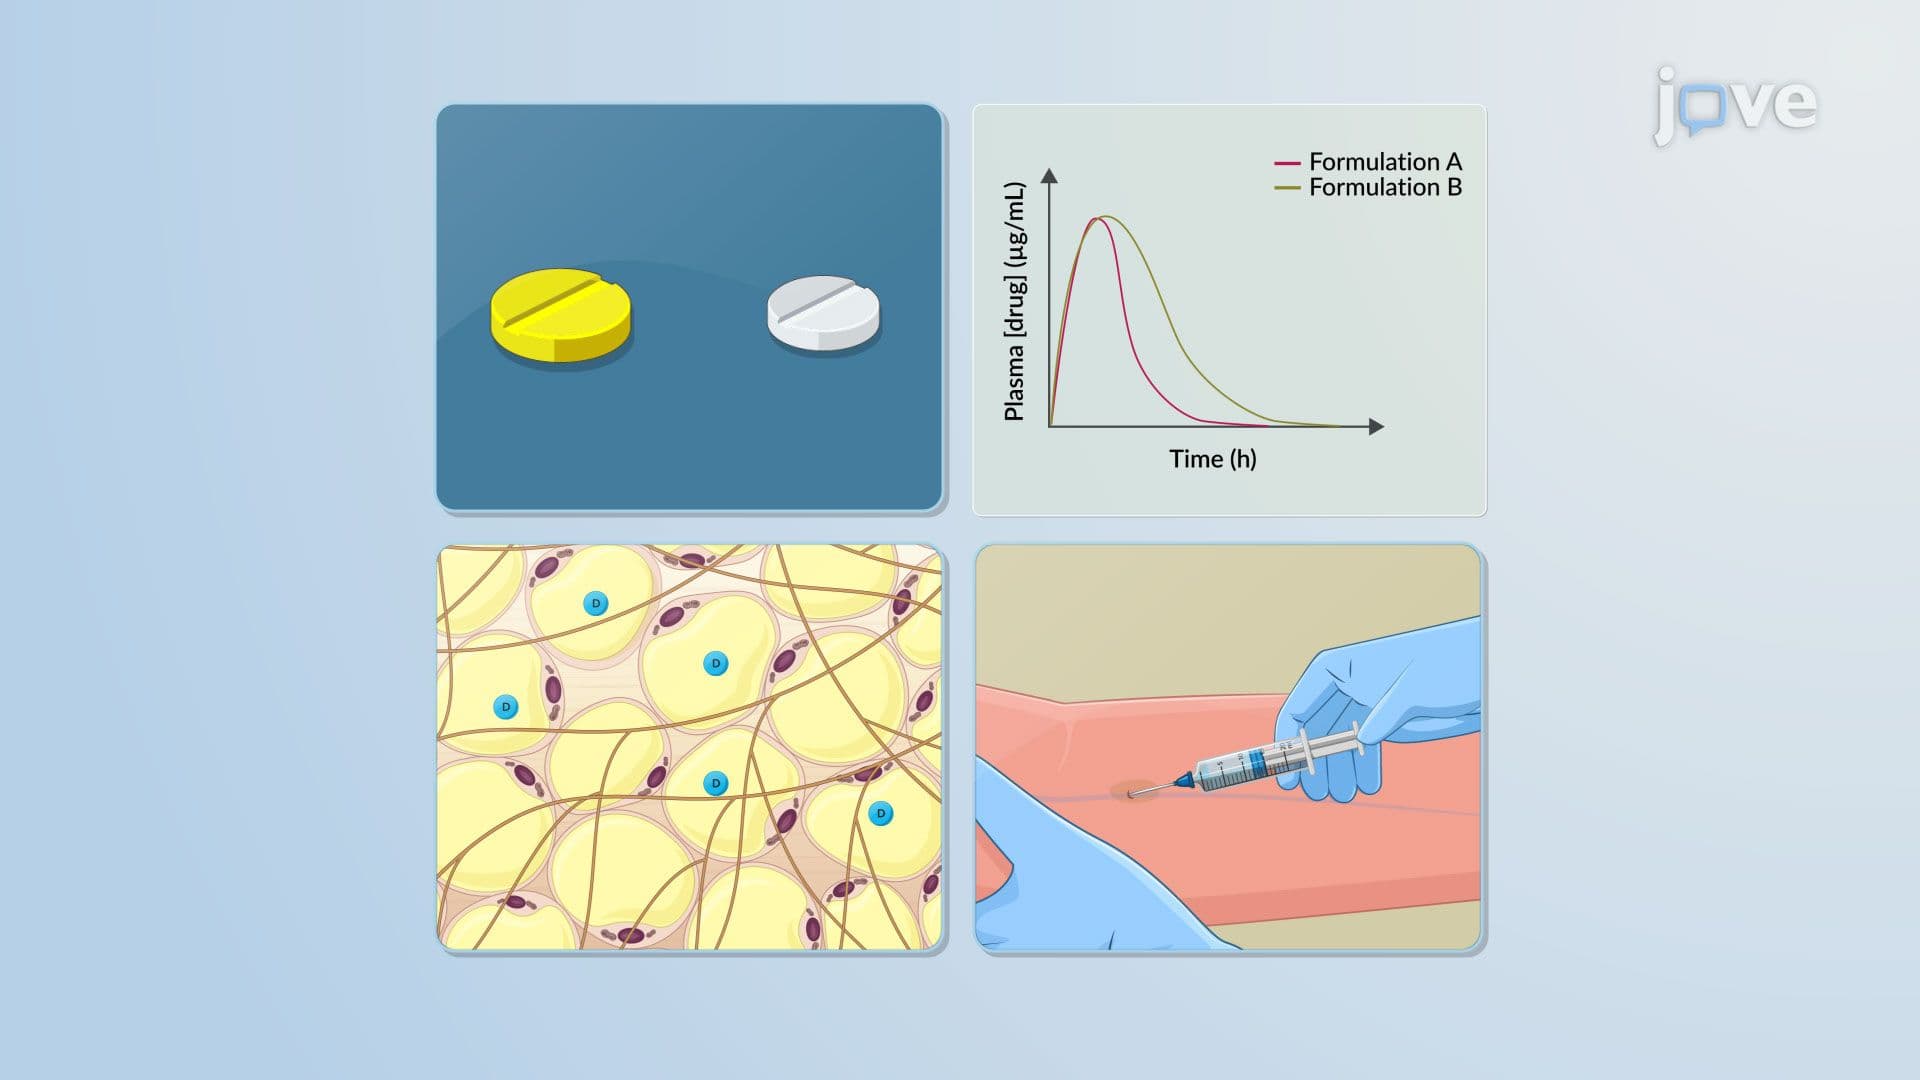
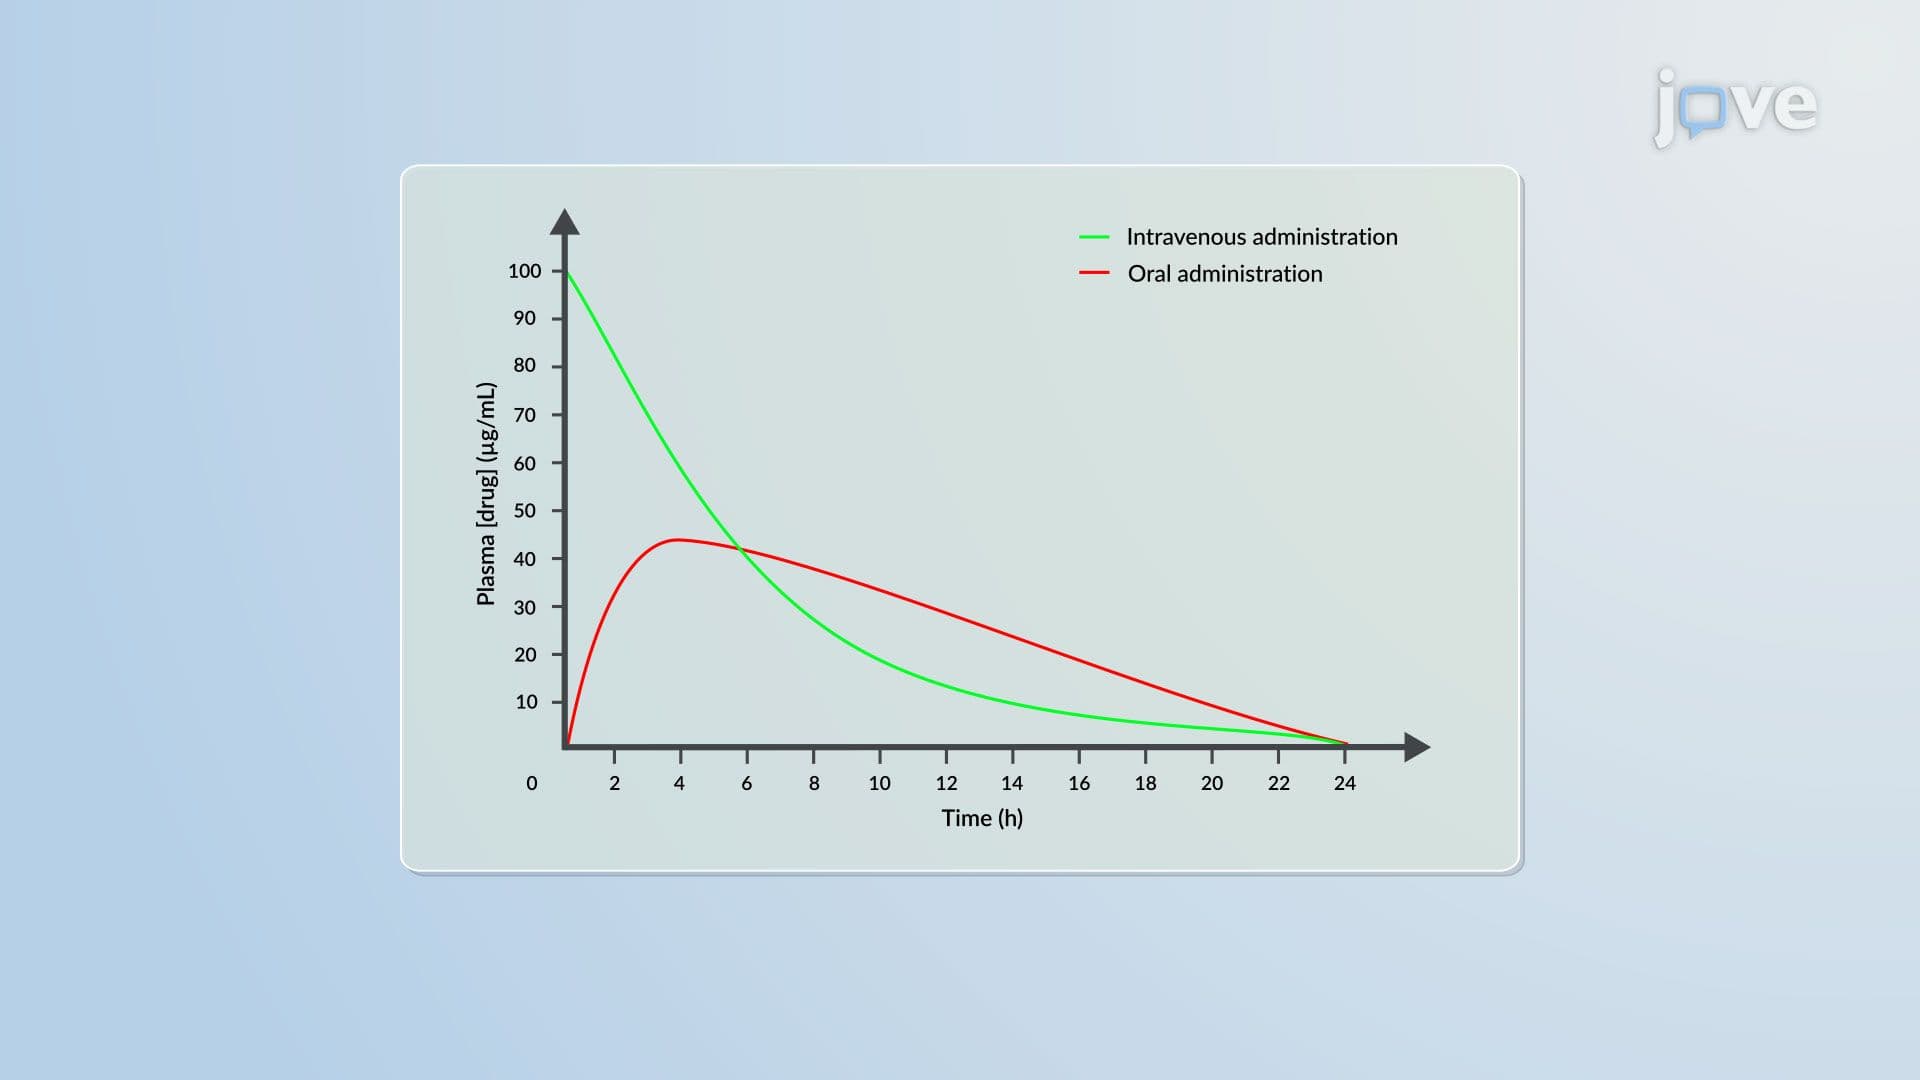
Drug action begins when plasma concentration exceeds the minimum effective level and persists only while that threshold is maintained. Duration depends on dose size, elimination rate, tissue binding, and administration route. Doubling a dose extends effect duration by one half-life, a precise, predictable relationship. However, for drugs with narrow therapeutic indices, this strategy introduces toxicity risk, making repeat dosing at the original level a safer clinical strategy. Effect intensity behaves differently across three response regions: near-maximum response, where intensity remains constant despite falling concentration; proportional response, where intensity tracks with log concentration; and low-response, where intensity and concentration decline together exponentially.
4. Influence of Elimination Half-Life on Effect Duration
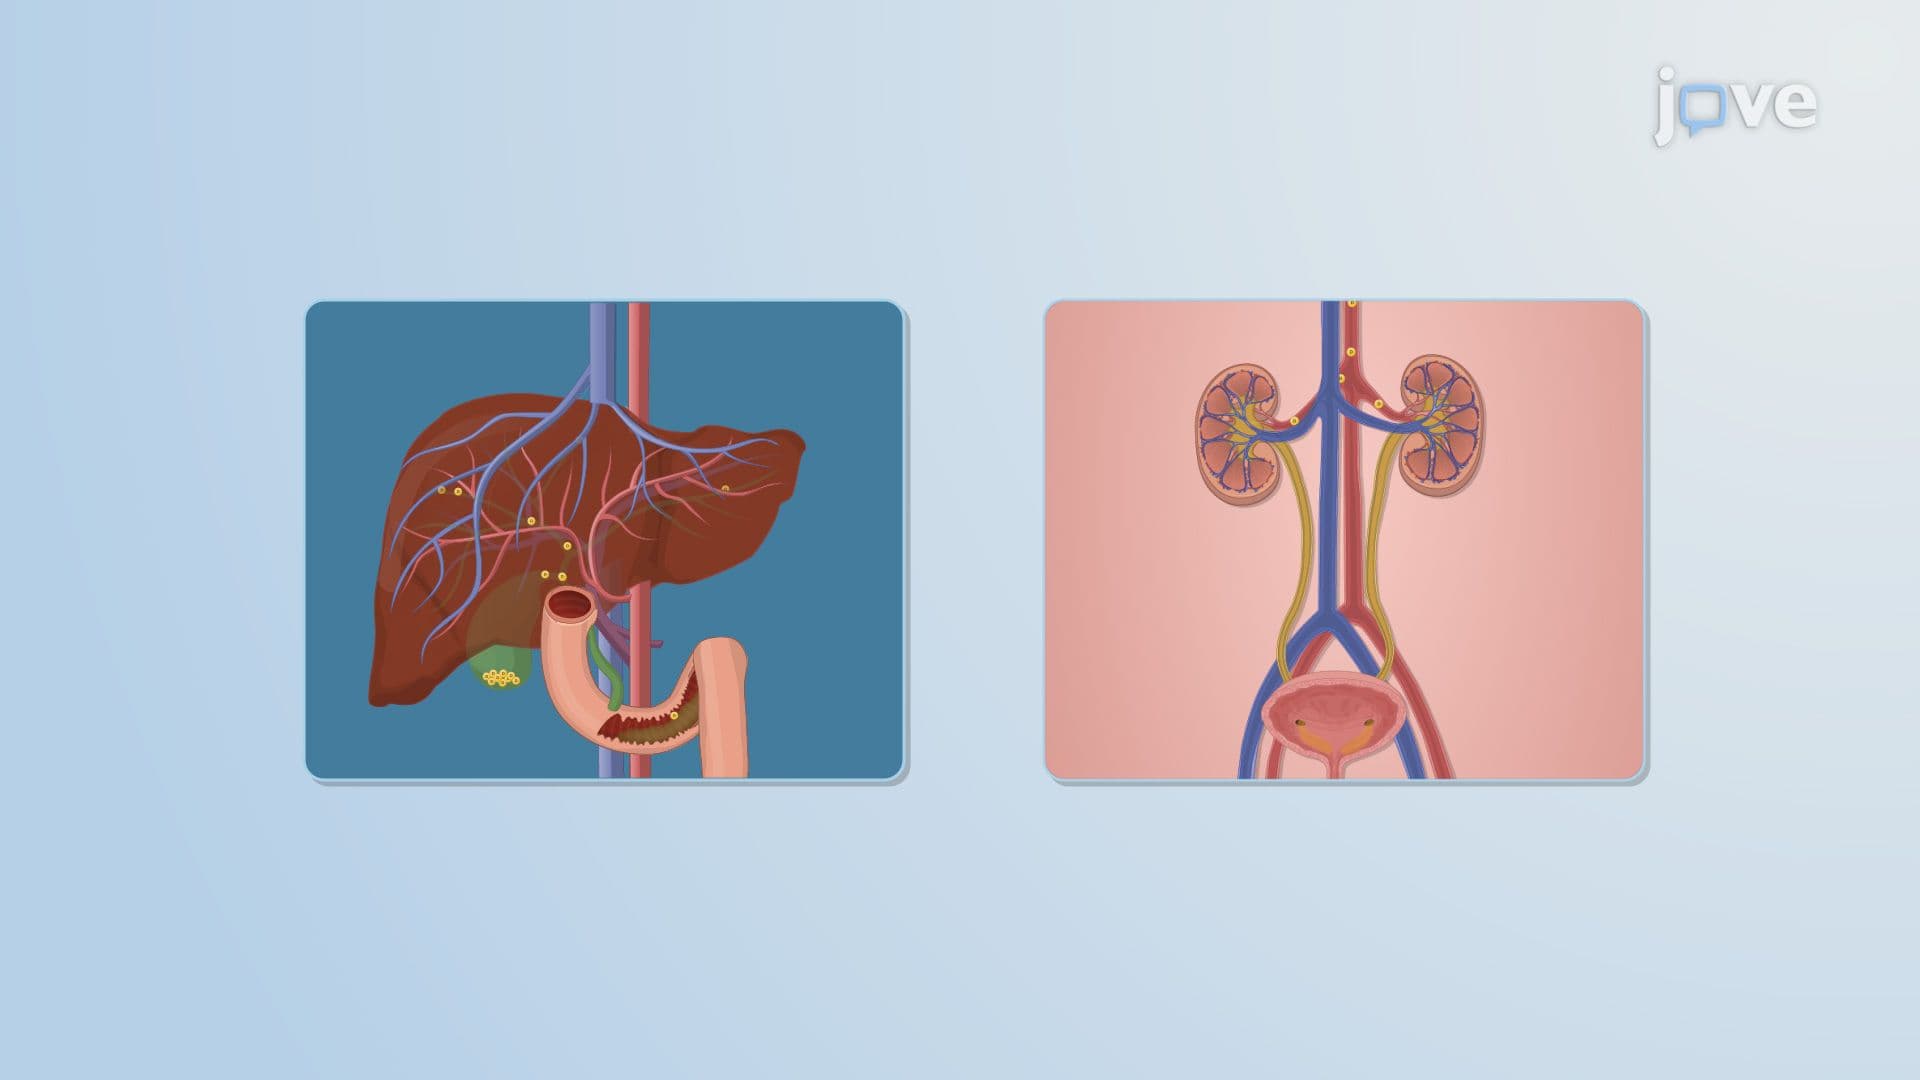
Hepatic or renal impairment slows drug elimination, extending half-life and prolonging therapeutic duration, but also amplifying toxicity risk. Conversely, patients with high metabolic clearance rates may eliminate drugs too rapidly for effective plasma concentrations to be sustained, even with dose increases. Chemical modification of a drug or co-administration of an inhibiting agent can extend half-life strategically. A clinical pharmacologist designing a dosing protocol for a renally impaired patient population must account directly for how altered elimination half-life reshapes the therapeutic window, since what works in a healthy cohort may produce dangerous accumulation or subtherapeutic exposure in compromised patients.
5. PK/PD Modeling Problems and Model Components
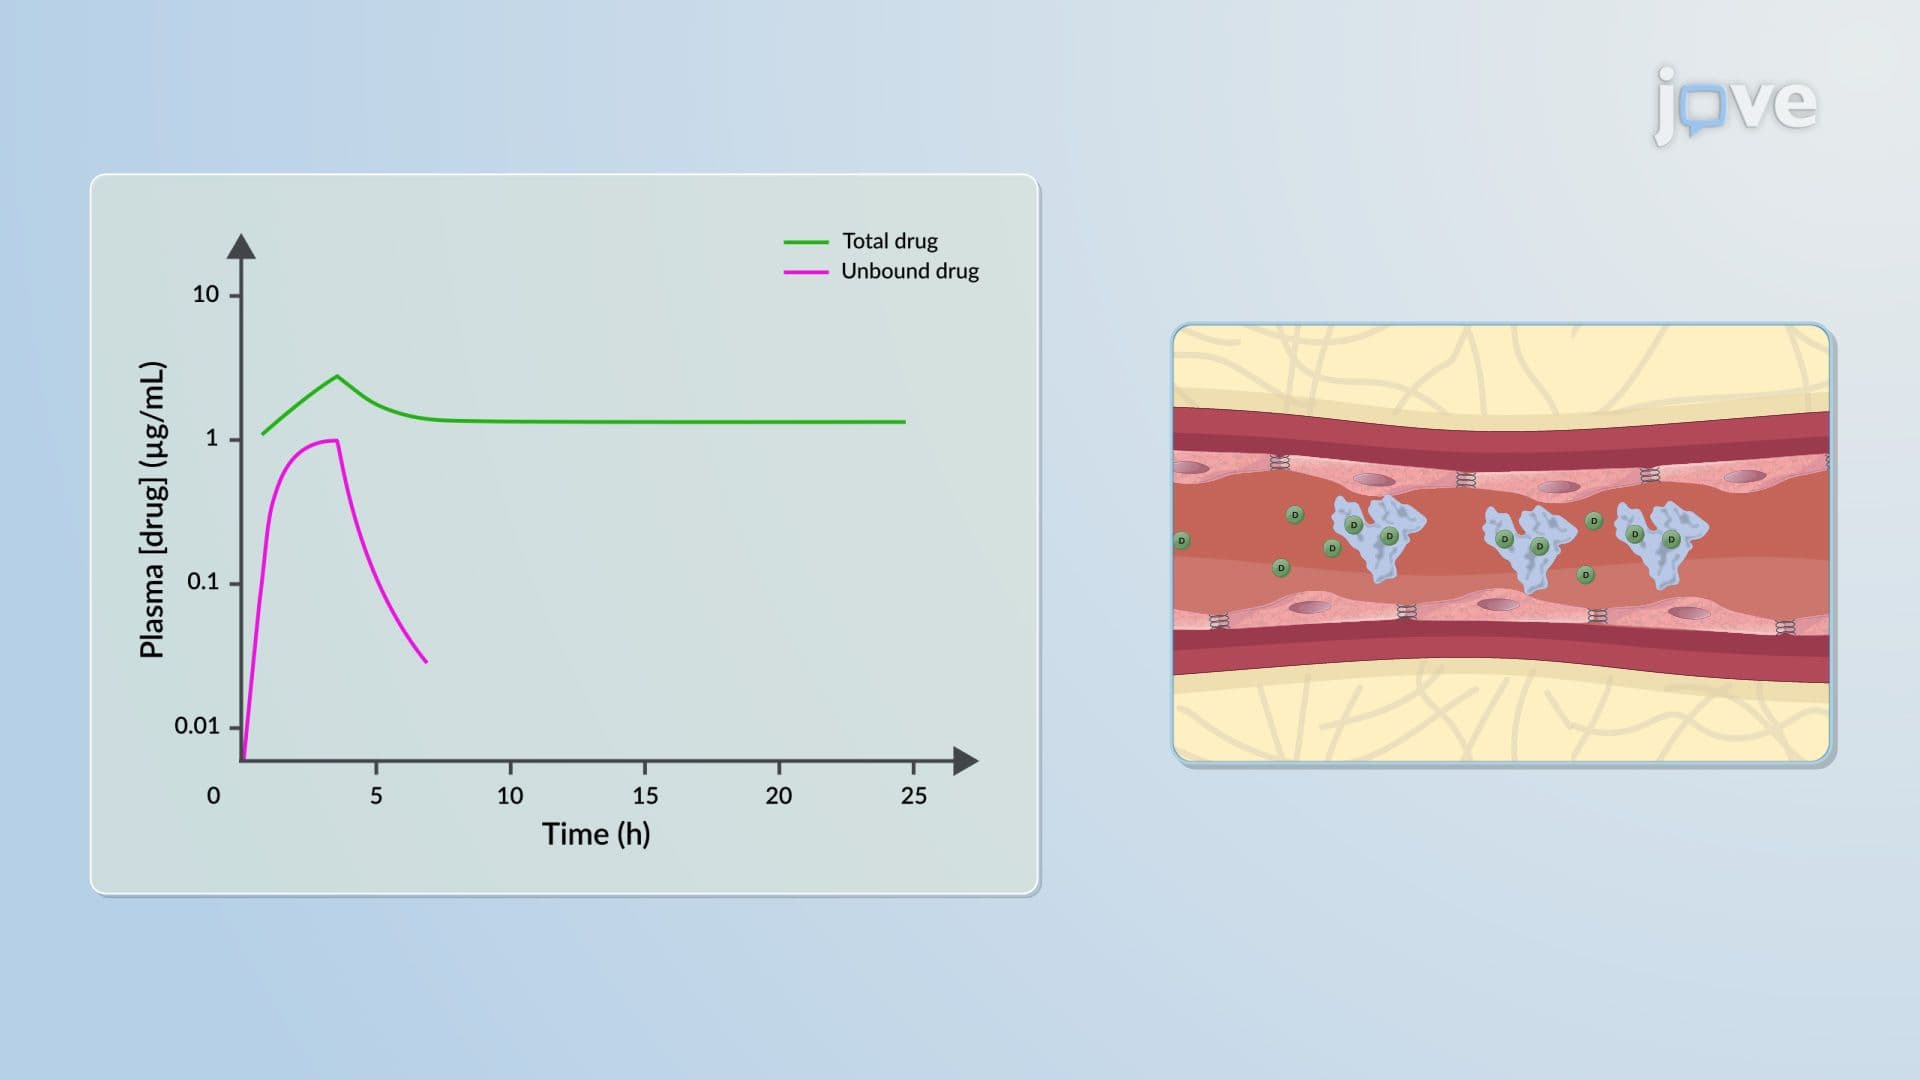
Pharmacokinetic pharmacodynamic modeling grows complex when real-world drug properties challenge clean mathematical assumptions. Racemic drug mixtures, where only one isomer drives pharmacological response, introduce efficacy variability that plasma concentration alone cannot explain. Protein binding shifts free drug availability, complicating the concentration-effect relationship. Delayed tissue distribution, active metabolite formation, and the development of acquired tolerance over chronic use each alter how modeled predictions align with observed responses. The modeling framework itself comprises four components: disposition kinetics governing plasma concentration over time, biophase distribution to the effect site, biosignal formation and degradation, and the resulting measurable response driven by parameters like Emax and EC50.
6. Pharmacodynamic Response Types
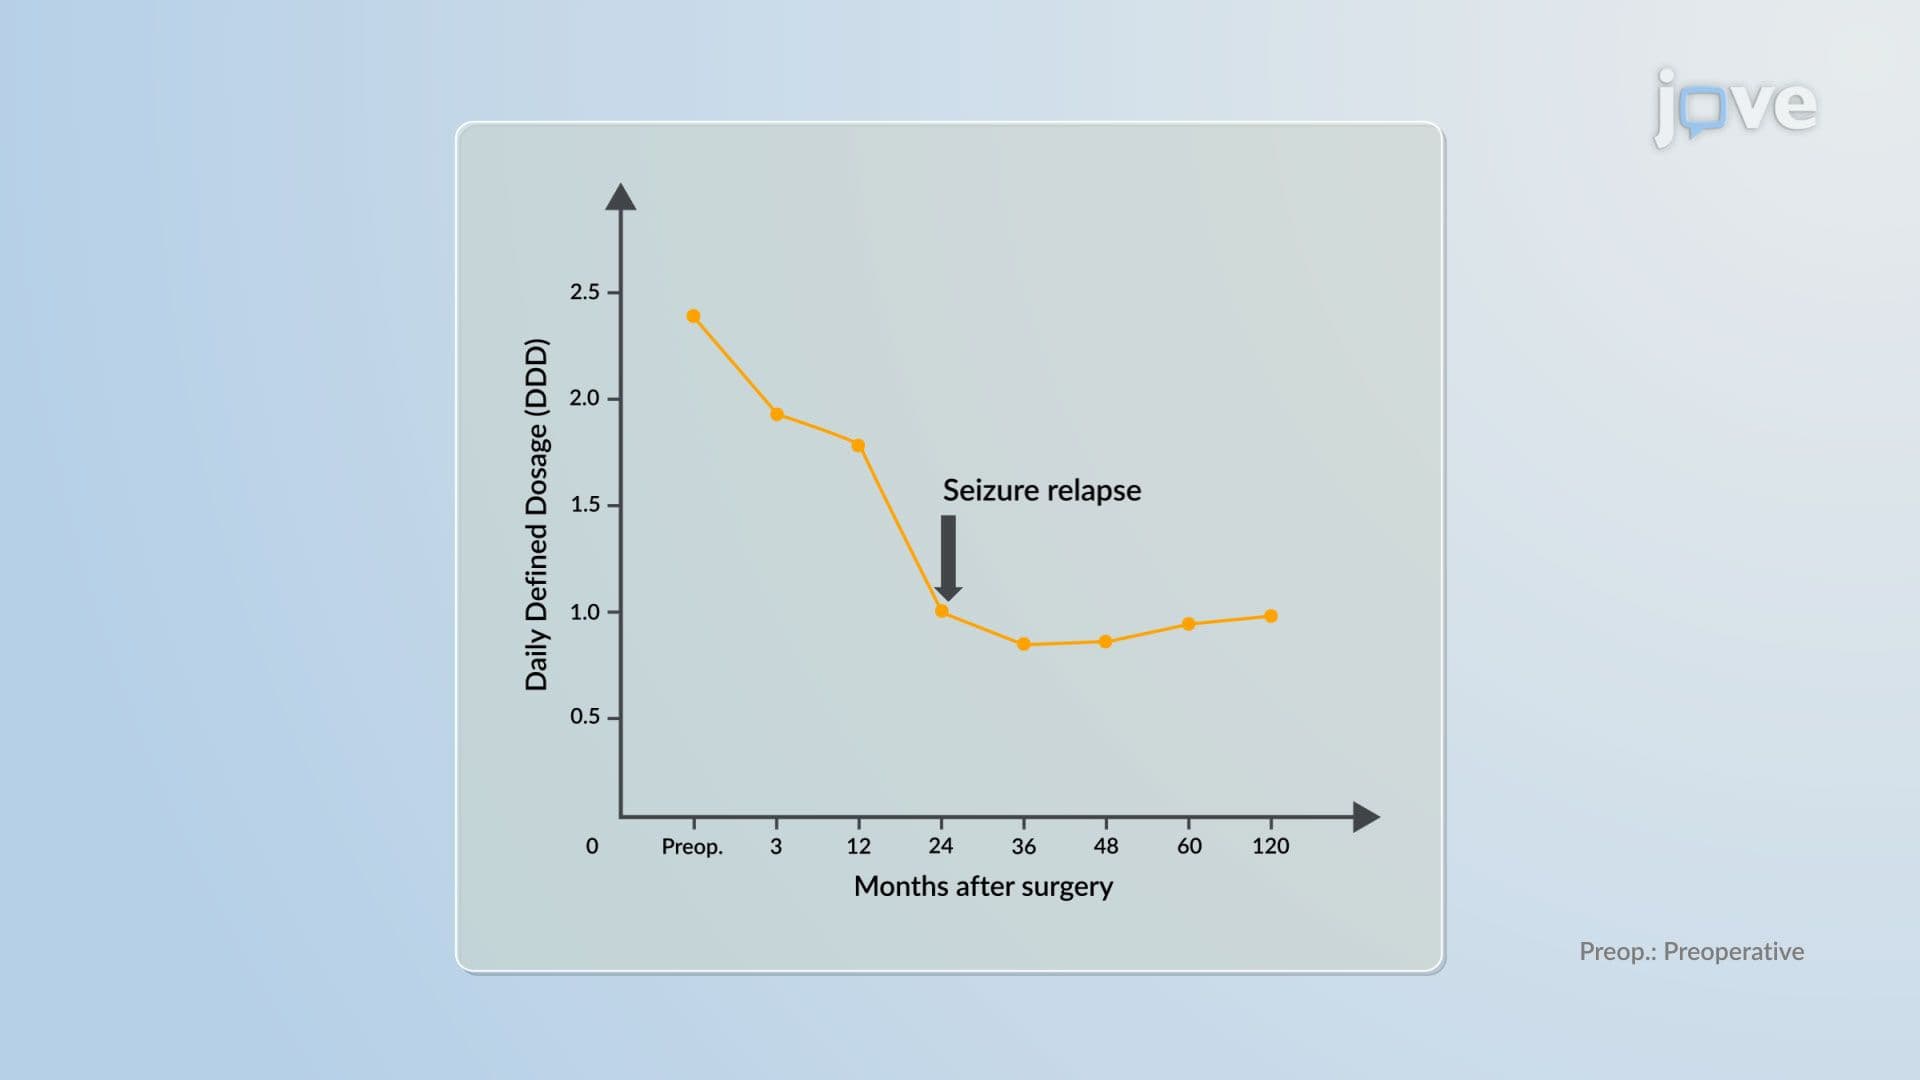
Pharmacodynamic responses fall into three categories, each requiring a distinct measurement and analytical approach. Continuous responses yield numerical values within a defined range, blood pressure readings in antihypertensive therapy are a standard example. Discrete or categorical responses are either binary, capturing whether an effect occurred or not, or ordinal, reflecting graded changes such as monthly seizure frequency. Time-to-event outcomes measure the duration until a specific clinical event occurs, such as seizure relapse following dose reduction. A clinical trial manager selecting endpoints for a phase two study must match the response type to the appropriate statistical model to ensure the trial produces interpretable, regulatory-grade evidence of drug effect.
7. Pharmacodynamic Models, Overview and Emax Model
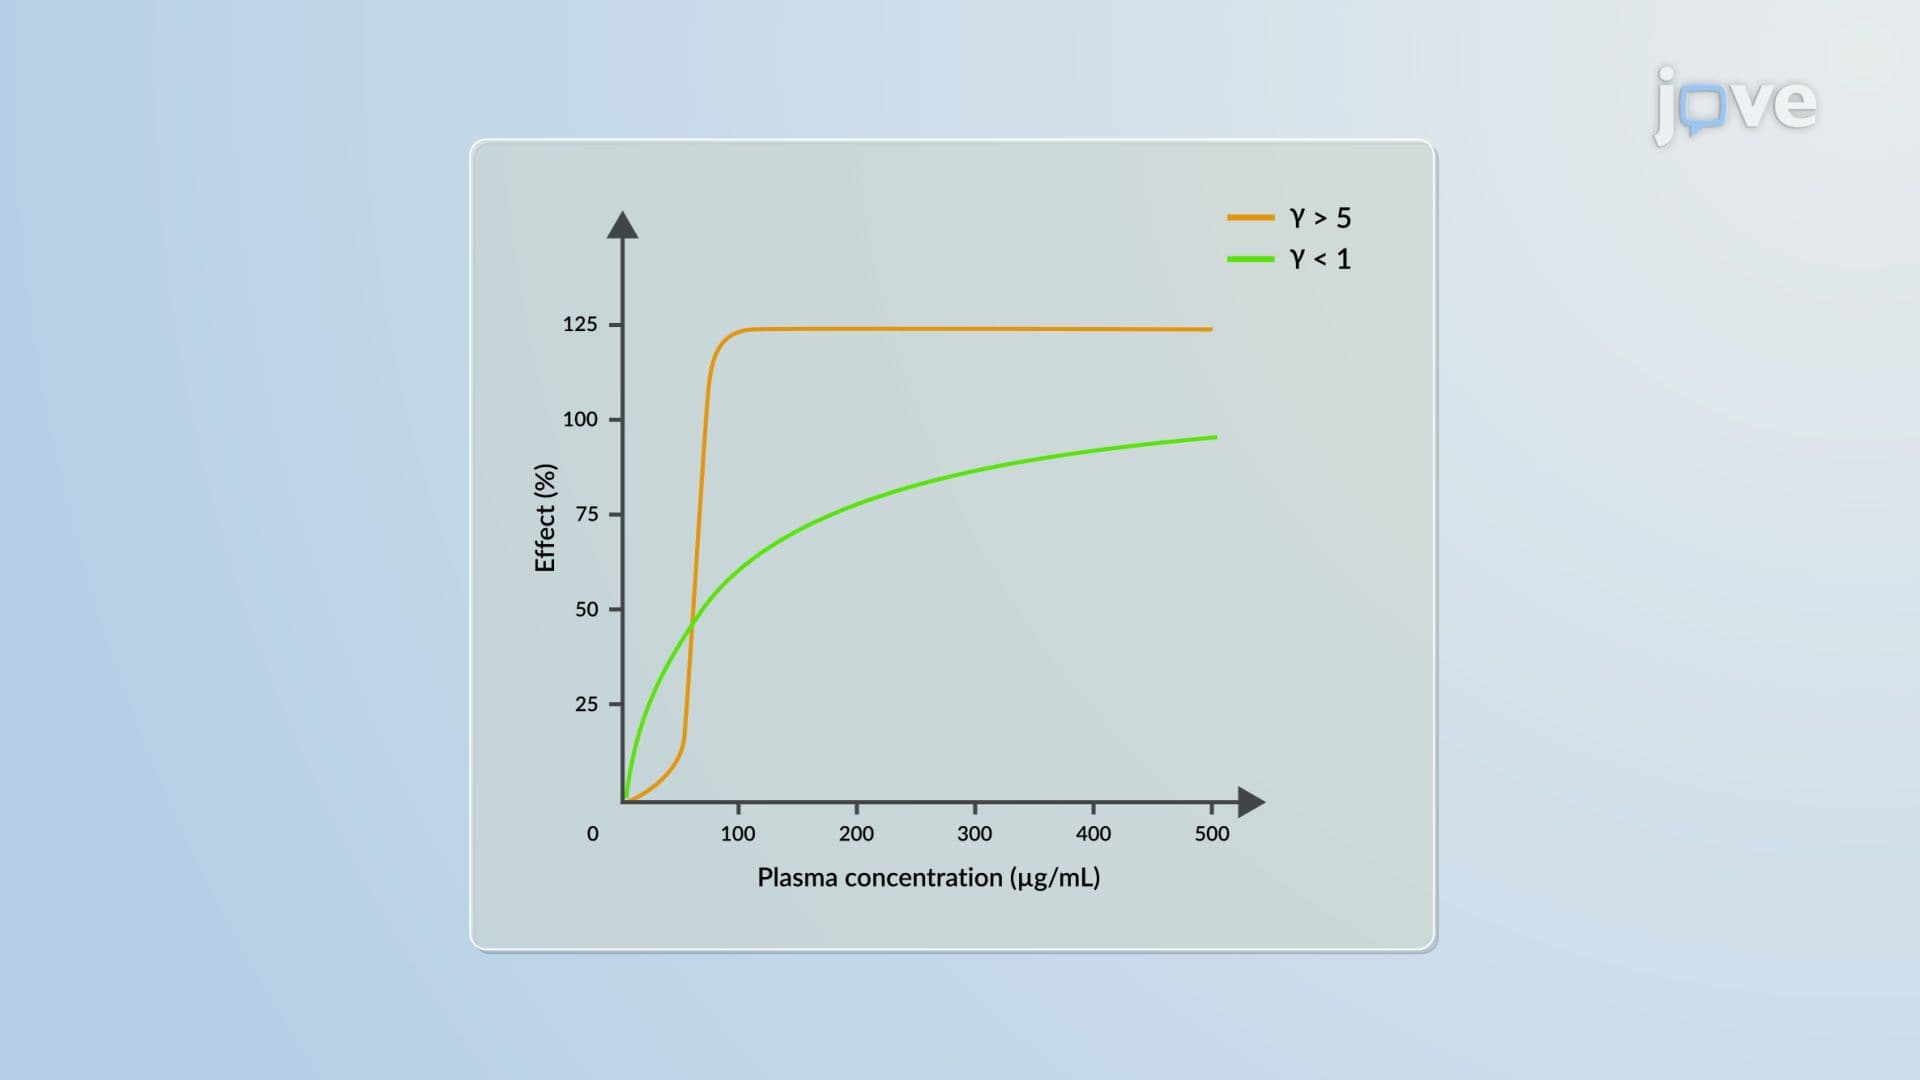
Pharmacodynamic models define the mathematical relationship between drug concentration and biological effect, enabling efficacy prediction, dose optimization, and safety assessment. Three broad categories exist: empirical models, relying on mathematical description alone; semi-mechanistic models, incorporating partial physiological context; and mechanistic models, explicitly describing biological interactions. The Emax model, derived from receptor occupancy theory, is the most widely applied, describing the saturable relationship between drug-receptor complex formation and effect magnitude. The Hill coefficient determines the steepness of the concentration-effect curve; values above five produce steep responses where missed doses sharply reduce therapeutic benefit, while values below one indicate gradual, broad dose-response relationships. Selecting the wrong model for a drug's mechanism can misrepresent its true efficacy profile.
8. Linear and Logarithmic Concentration-Effect Models
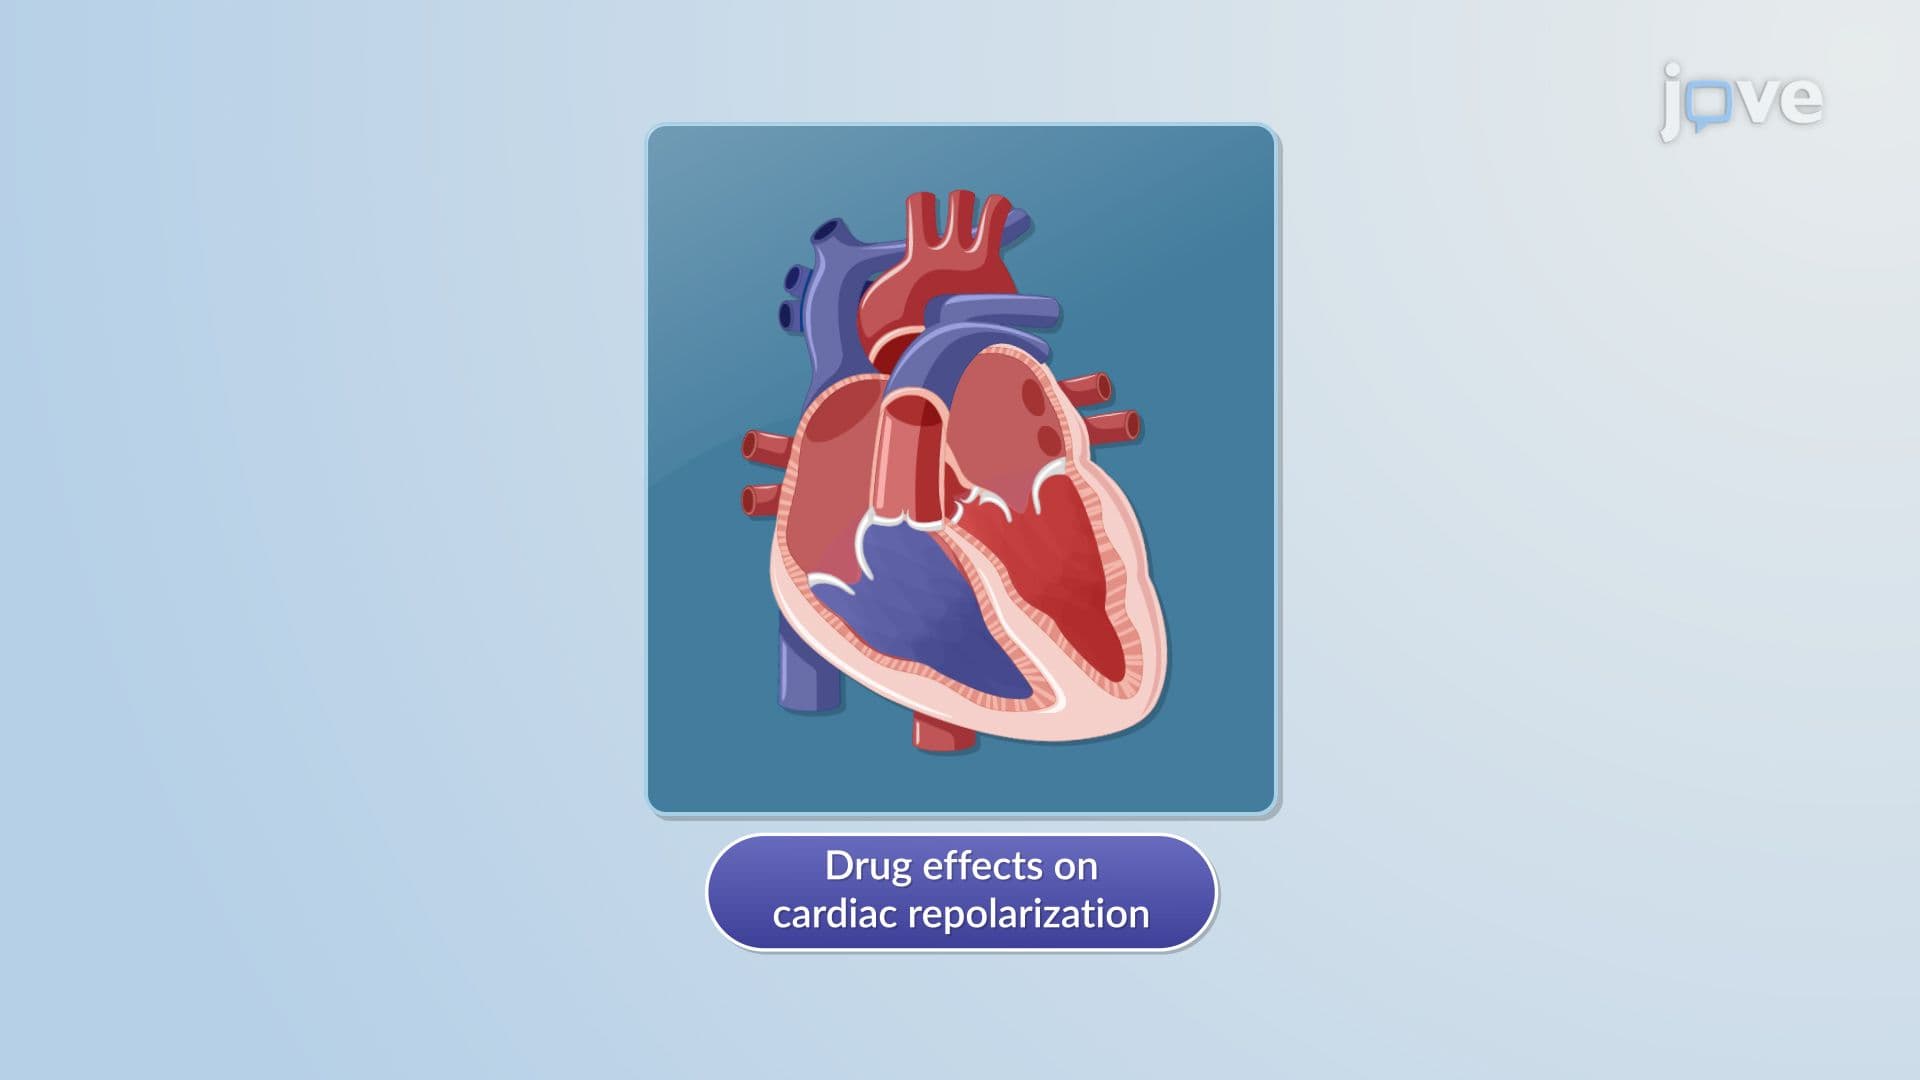
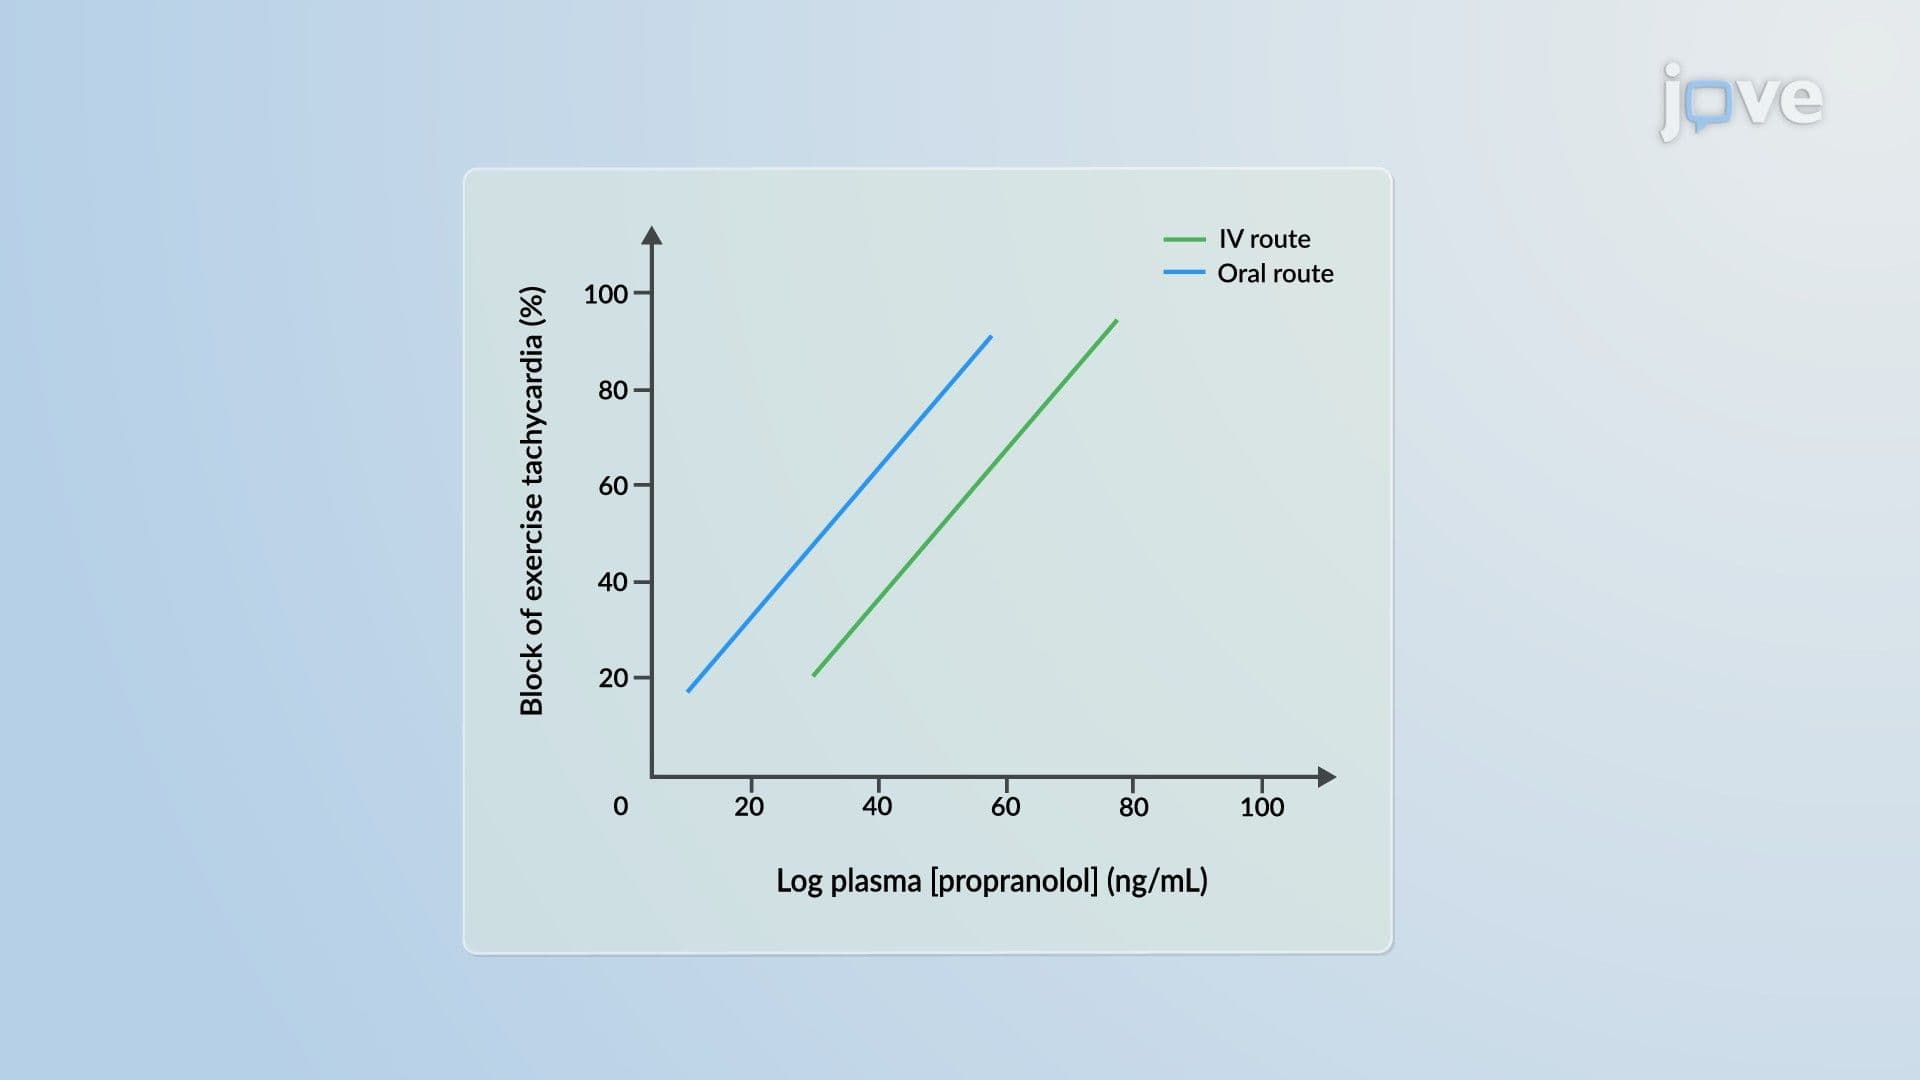
The linear model assumes pharmacological effect is directly proportional to plasma drug concentration, an approximation that holds reasonably well below EC50 but fails across wider concentration ranges. Despite this limitation, it remains a standard tool for evaluating cardiac repolarization effects, particularly QTc interval prolongation assessed by electrocardiogram, a critical safety measurement in regulatory evaluations of proarrhythmic risk. The log-linear model improves upon this by relating effect to the logarithm of concentration, performing well when maximum effect falls between 20 and 80%. It cannot predict effect at zero concentration or define a true maximum, but it reliably characterizes concentration-effect relationships for drugs with well-characterized plasma behavior and established clinical pharmacology data.
9. Additive, Proportional, Direct Effect, and Indirect Response Models
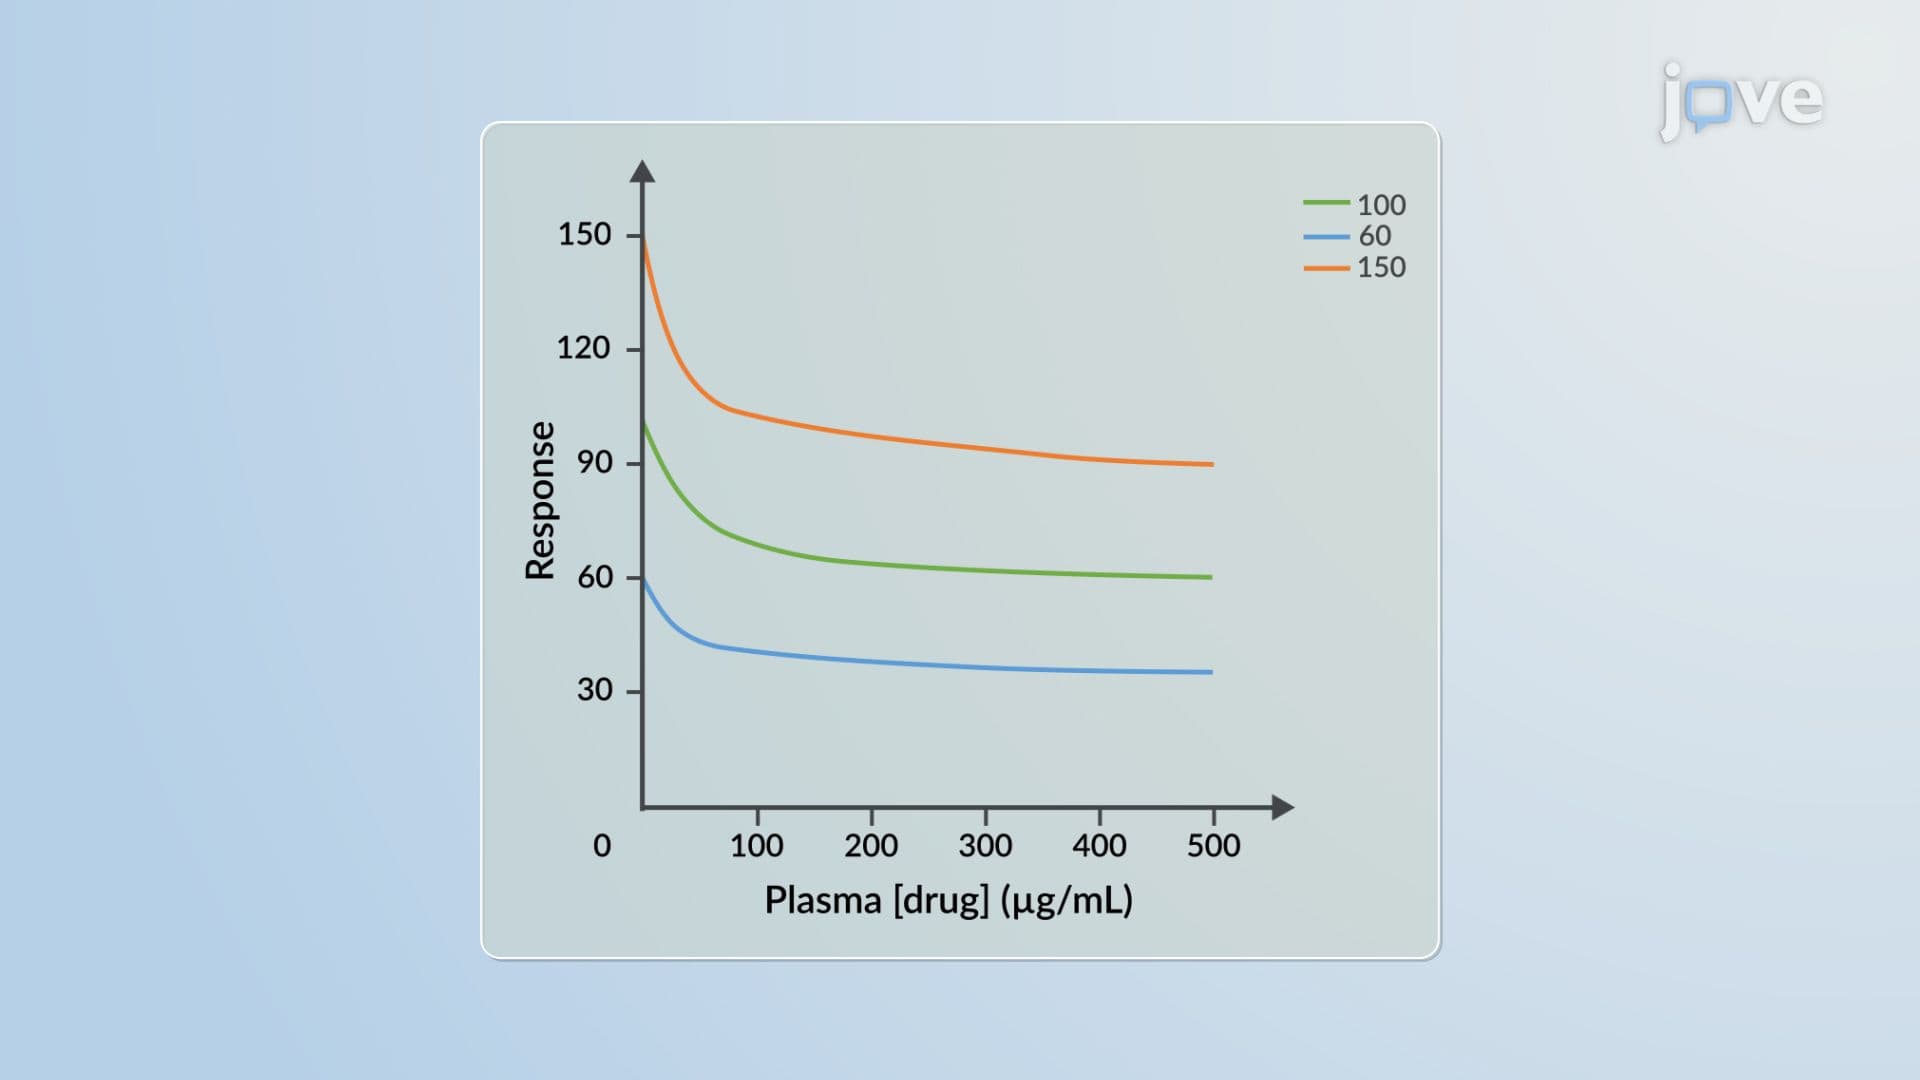
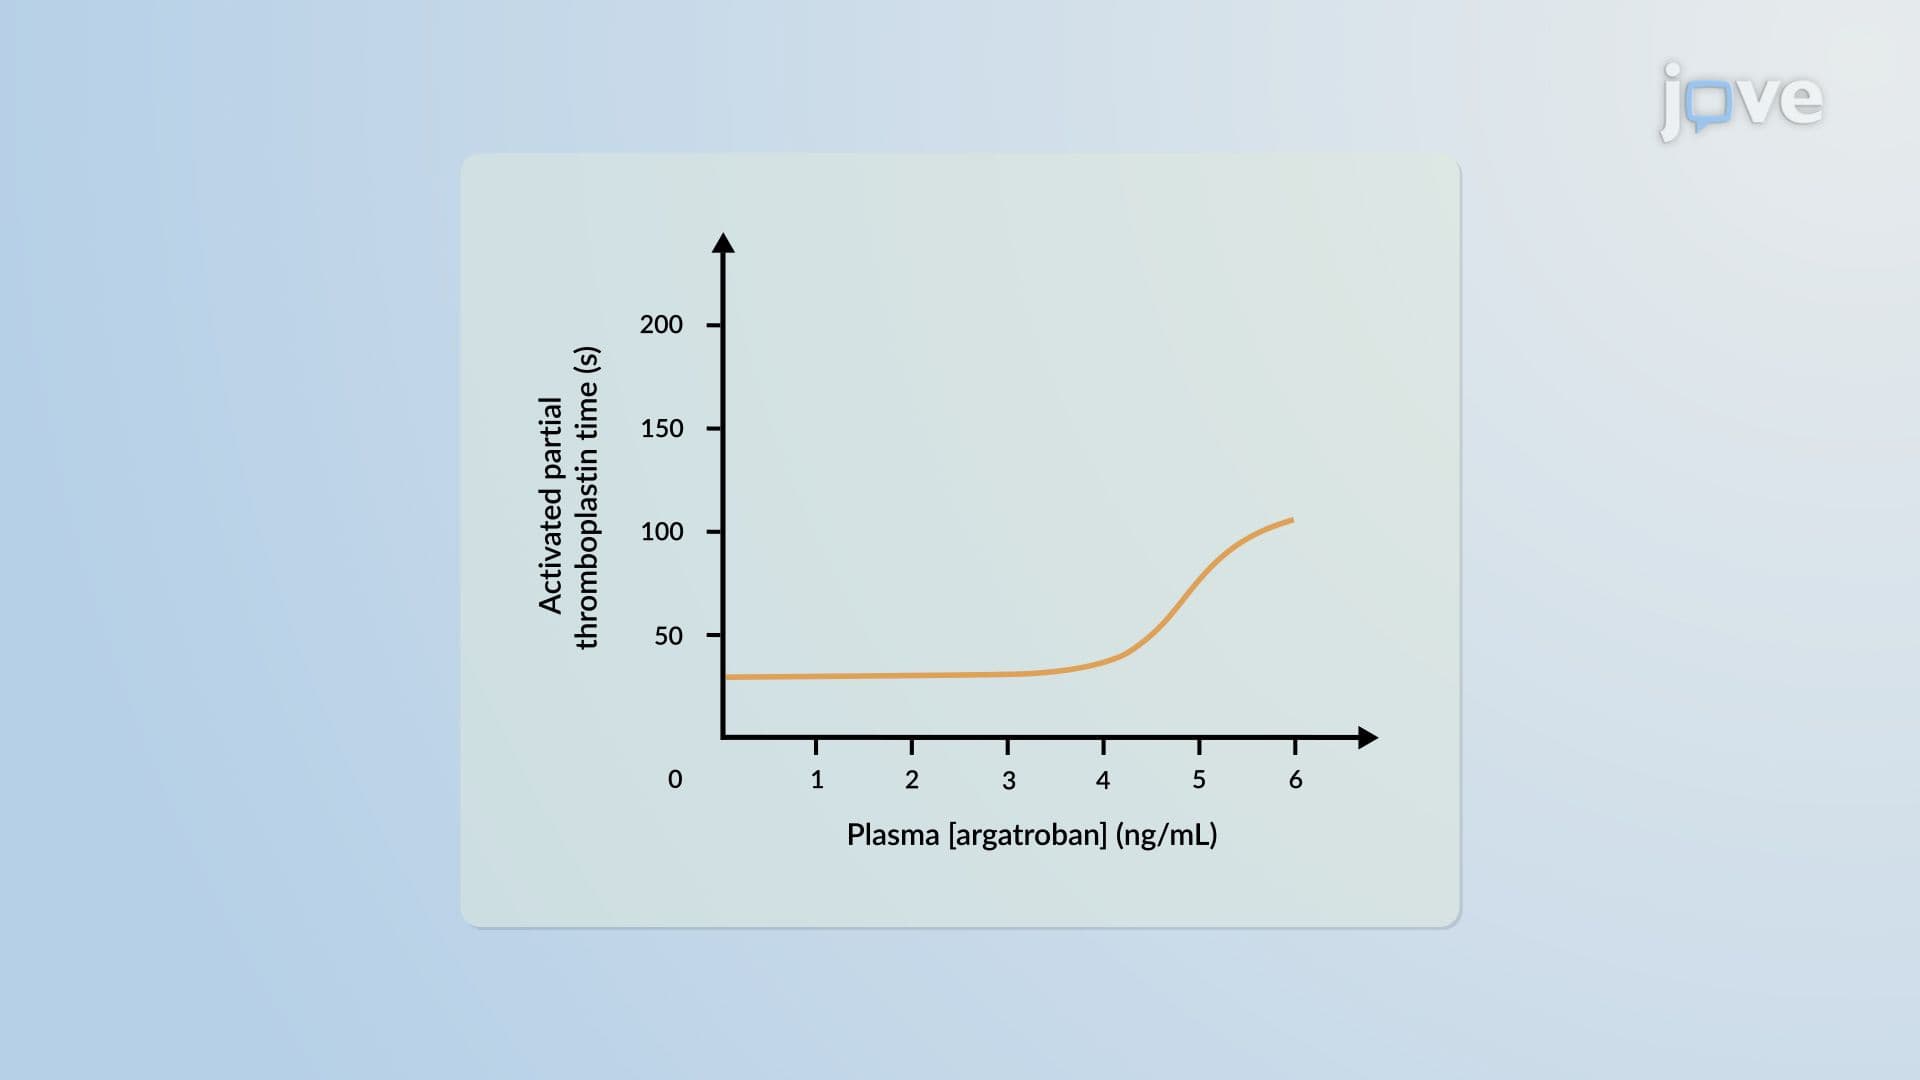
Baseline pharmacological activity exists even before drug administration. Additive models treat the observed response as the sum of baseline and drug effect, while proportional models describe how a drug amplifies or diminishes the existing baseline, producing steeper declines from larger baselines. Direct effect models apply when drug concentration immediately governs response, as in anticoagulant therapy where plasma levels directly track with clotting suppression. Indirect response models describe how a drug modulates the production or elimination of endogenous biological compounds, often producing delayed peak responses and prolonged time-to-maximum effect at higher doses. Distinguishing which model applies to a given drug mechanism prevents misinterpretation of clinical trial data and supports more accurate dose selection during development.
10. Link Model, Systems Pharmacodynamic Models, and Regulatory Impact
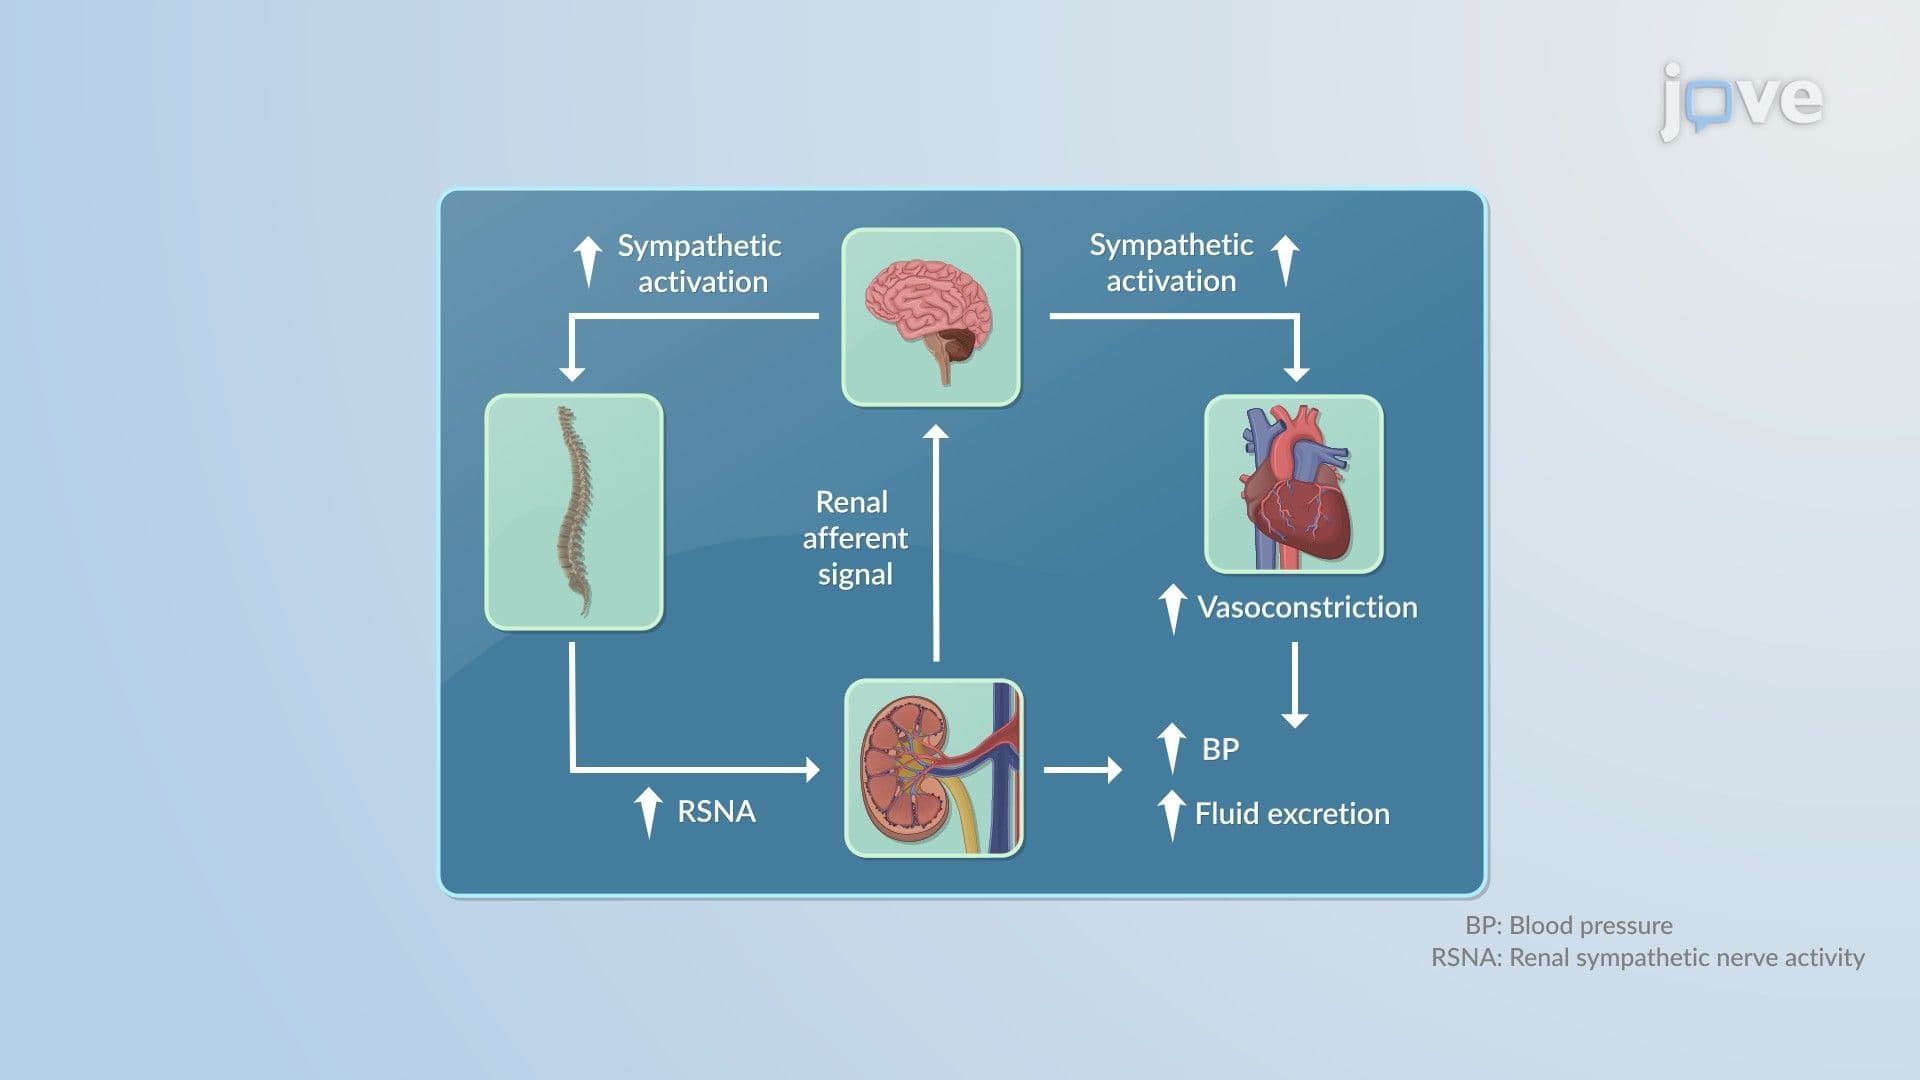
When peak drug effect does not coincide with peak plasma concentration, the link model introduces an effect compartment, characterizing the equilibration rate between plasma and the target site through the rate constant ke0. A counterclockwise hysteresis loop in the concentration-response plot signals this delay. Systems pharmacodynamic models extend further, integrating homeostasis and feedback mechanisms to assess how altering one biological process cascades through an entire physiological system. In regulatory contexts, PK/PD modeling has directly shaped approval decisions and dosing label recommendations, guiding optimal bolus and maintenance infusion regimens to balance efficacy against adverse event risk. Professionals who can construct, interpret, and communicate these models contribute meaningfully to both drug development strategy and regulatory submission outcomes.