Loading video…

 16 Concepts
 3.5K views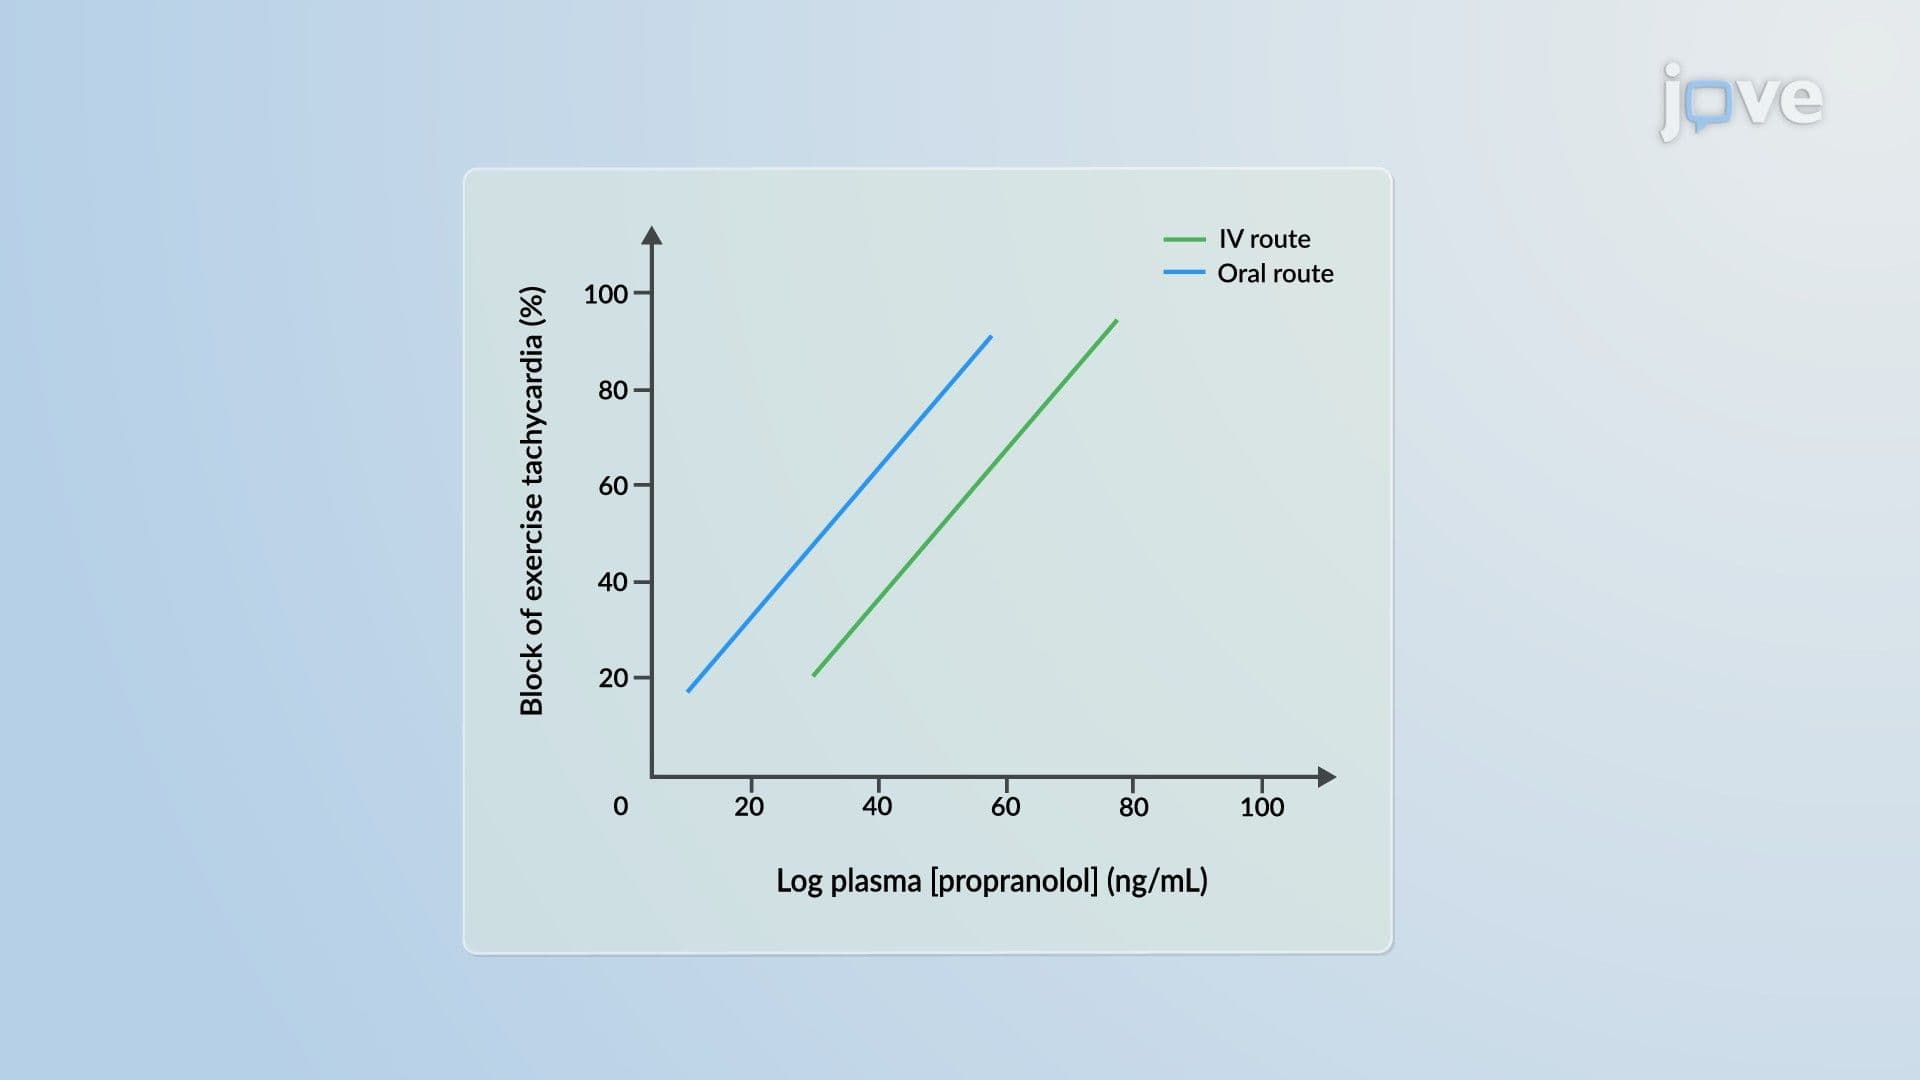

Video Summary: Logarithmic Concentration Effect Model in Pharmacodynamic Models
The logarithmic concentration-effect model in pharmacodynamic models basics offers a precise framework for understanding how drug effects scale with concentration, critical when clinical decisions depend on predicting response within a narrow therapeutic range. When effect magnitude falls between 20-80% of maximum, the log-linear relationship becomes a reliable, practical predictor. Watch the full video on JoVE Coach to master this concept with expert-led visuals and step-by-step explanations.
Imagine a clinical pharmacologist reviewing why a patient's response to a cardiovascular drug is inconsistent, doses are adequate on paper, but outcomes vary. The missing link is often a failure to correctly model *how* drug concentration translates to measurable effect. The logarithmic concentration-effect model provides a structured, validated method for closing that gap.
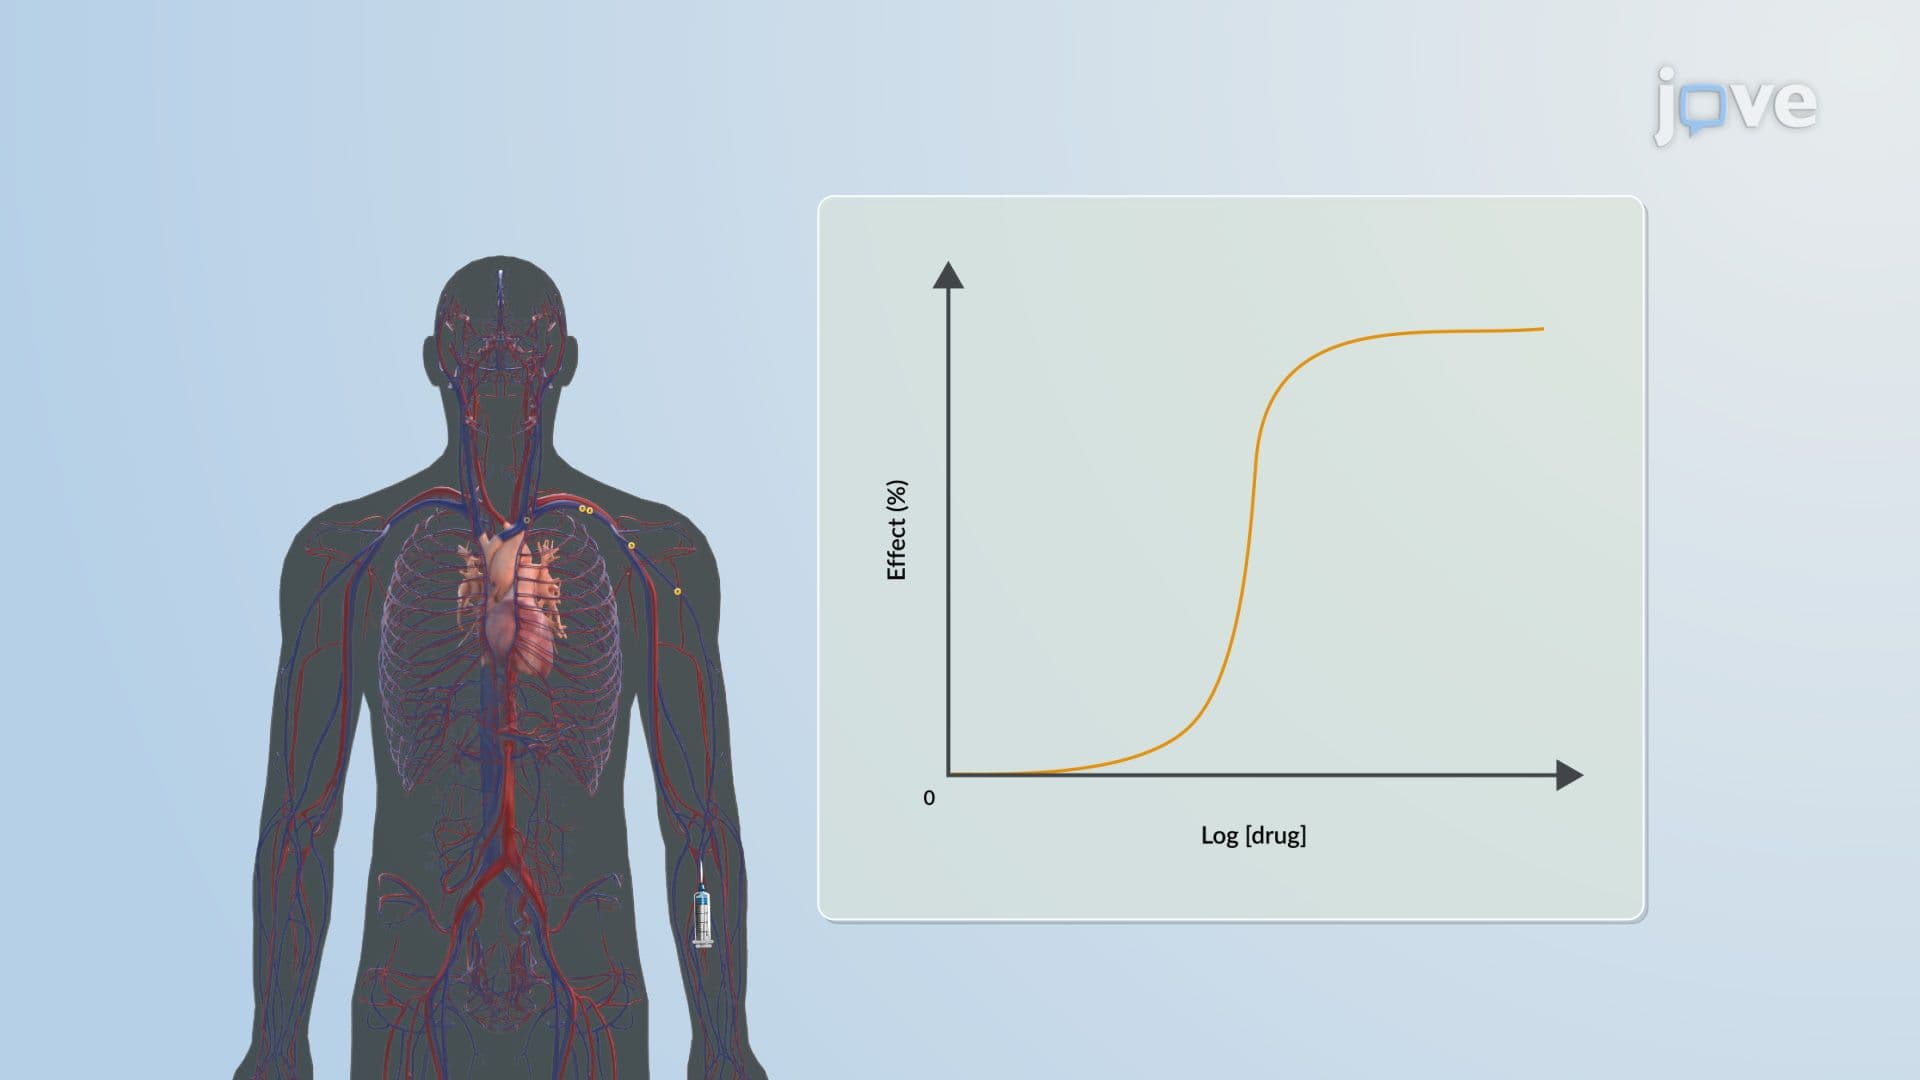
The logarithmic concentration-effect model, also called the log-linear model, is one of the foundational tools in pharmacodynamic analysis. It states that drug effect (E) is directly proportional to the logarithm of plasma drug concentration (C), expressed as:
E = S·log C + E₀
Here, S is the slope, the effect produced per unit of log concentration, and E₀ is the baseline effect in the absence of drug. This model is most reliable and clinically meaningful when the observed effect falls between 20% and 80% of maximum effect (Emax). Within that range, the relationship is essentially linear on a log scale, making it highly tractable for both prediction and dosing decisions.
This is where the model integrates naturally into PK/PD modeling, bridging what the body does to the drug (pharmacokinetics) with what the drug does to the body (pharmacodynamics).
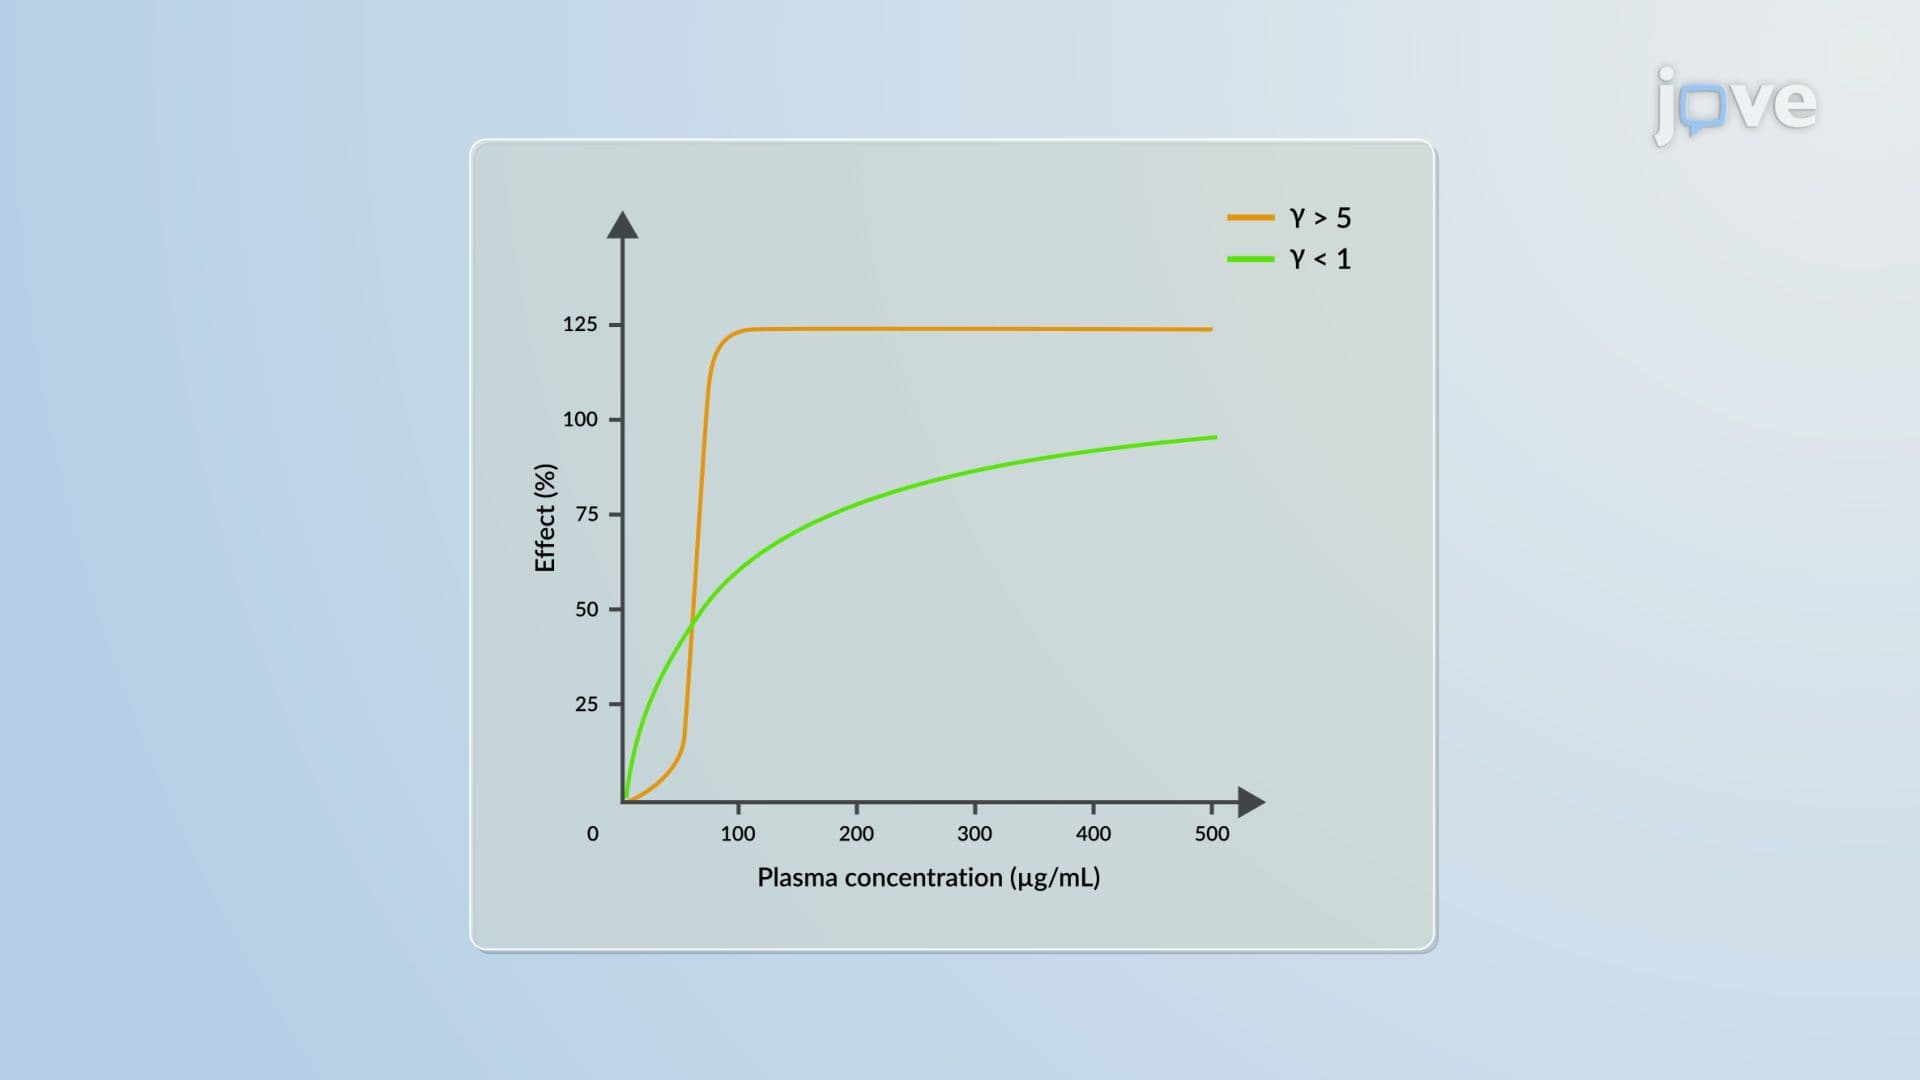
No model is universal, and understanding the boundaries of the log-linear approach is as important as applying it correctly. The model has a well-documented limitation: it cannot predict the maximum drug effect (Emax) and fails entirely at zero concentration, where the log of zero is mathematically undefined.
This is where the Emax model (Hill equation) becomes the preferred alternative, it explicitly incorporates both Emax and EC50 (the concentration producing 50% of maximum effect), making it more complete for full dose-response characterization. The log-linear model is best thought of as a *practical approximation* within a defined concentration window, not a comprehensive PK/PD descriptor.
When hysteresis in PK/PD is present, meaning there is a temporal disconnect between plasma concentration and effect, neither model should be applied without first addressing that lag through effect-compartment or indirect-response modeling.
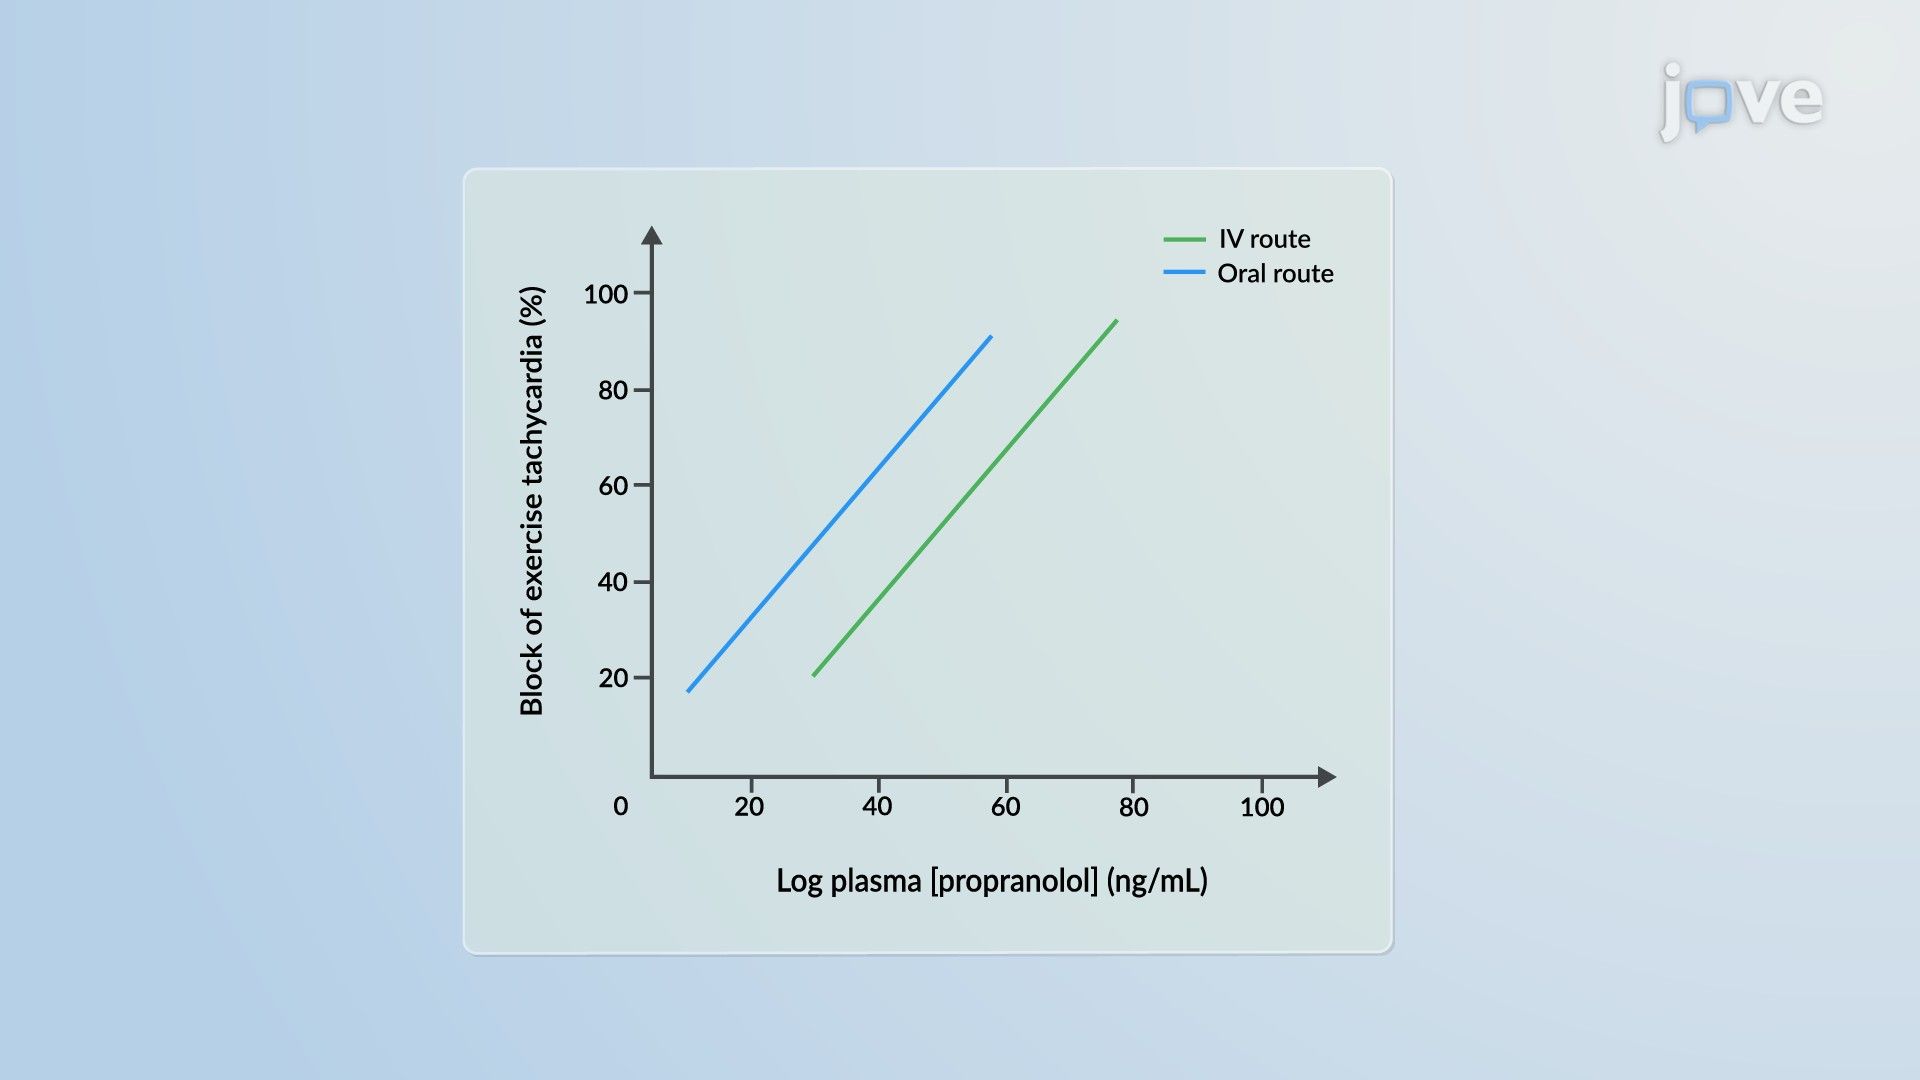
The clearest clinical illustration of this model is propranolol's effect on exercise-induced tachycardia. When log plasma propranolol concentration is plotted against the percentage block of tachycardia, the relationship is strikingly linear, and this holds across both intravenous and oral administration routes.
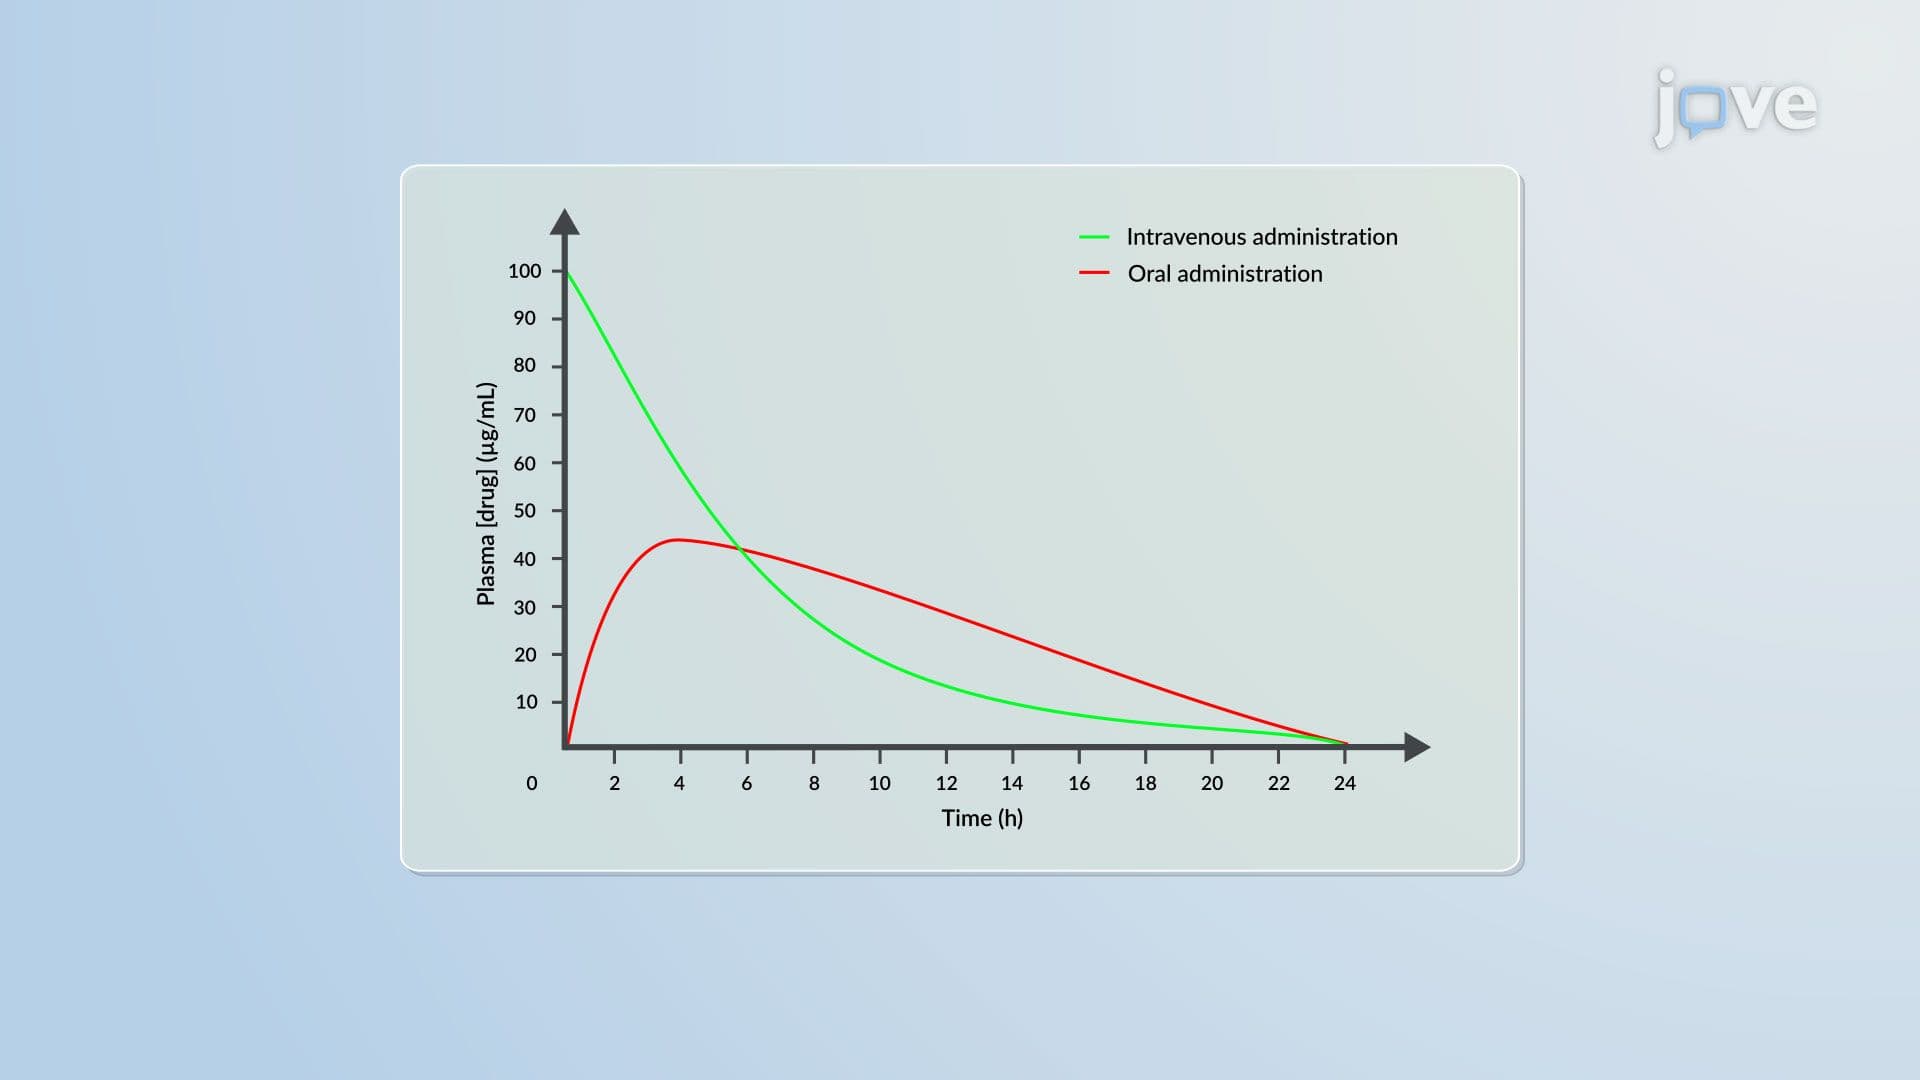
Critically, the IV route demonstrates a more pronounced and consistent response, reflecting tighter PK control and higher bioavailability compared to the oral route. This finding has direct implications for therapeutic window management: clinicians can use the log-linear plot to identify the concentration range that delivers meaningful beta-blockade without pushing into toxicity.
Warfarin is another instructive example. Its anticoagulant effect follows a similar log-linear pattern within the therapeutic range, which is why precision in concentration monitoring, and understanding how to determine PK/PD relationships, is so clinically consequential.
The most frequent error in applying this model is extrapolating beyond the 20-80% Emax window. Predictions at very low or very high concentrations lose validity quickly, and relying on log-linear assumptions outside that zone can lead to dosing errors or misinterpretation of drug response data.
A robust PK/PD workflow treats the log-linear model as one tool in a tiered analytical framework, appropriate for mid-range effect prediction, paired with Emax modeling for full characterization, and always evaluated in the context of the therapeutic index to ensure the concentration range in question is both effective and safe.
Related Micro-courses