Loading video…


 16 Concepts
 3.5K views

Video Summary: Emax Drug Concentration Effect Model in Pharmacodynamic Models
The Emax drug-concentration effect model in pharmacodynamic models basics sits at the core of understanding how drug dosing decisions translate into measurable patient outcomes. For professionals navigating PK/PD modeling, missing the relationship between drug concentration and therapeutic effect creates costly gaps in clinical decision-making. Grasping the Emax model, including EC50, the Hill coefficient, and equilibrium dynamics, sharpens your analytical edge immediately. Watch the full video on JoVE Coach to master this concept with expert-led visuals and step-by-step explanations.
Imagine a clinical pharmacology team reviewing a drug candidate that shows strong receptor binding in early studies, yet patients in Phase II trials are reporting inconsistent therapeutic outcomes. The data exists. The gap is in how the team is interpreting the relationship between drug concentration and effect. This is precisely where the Emax drug-concentration effect model in pharmacodynamic models becomes indispensable.
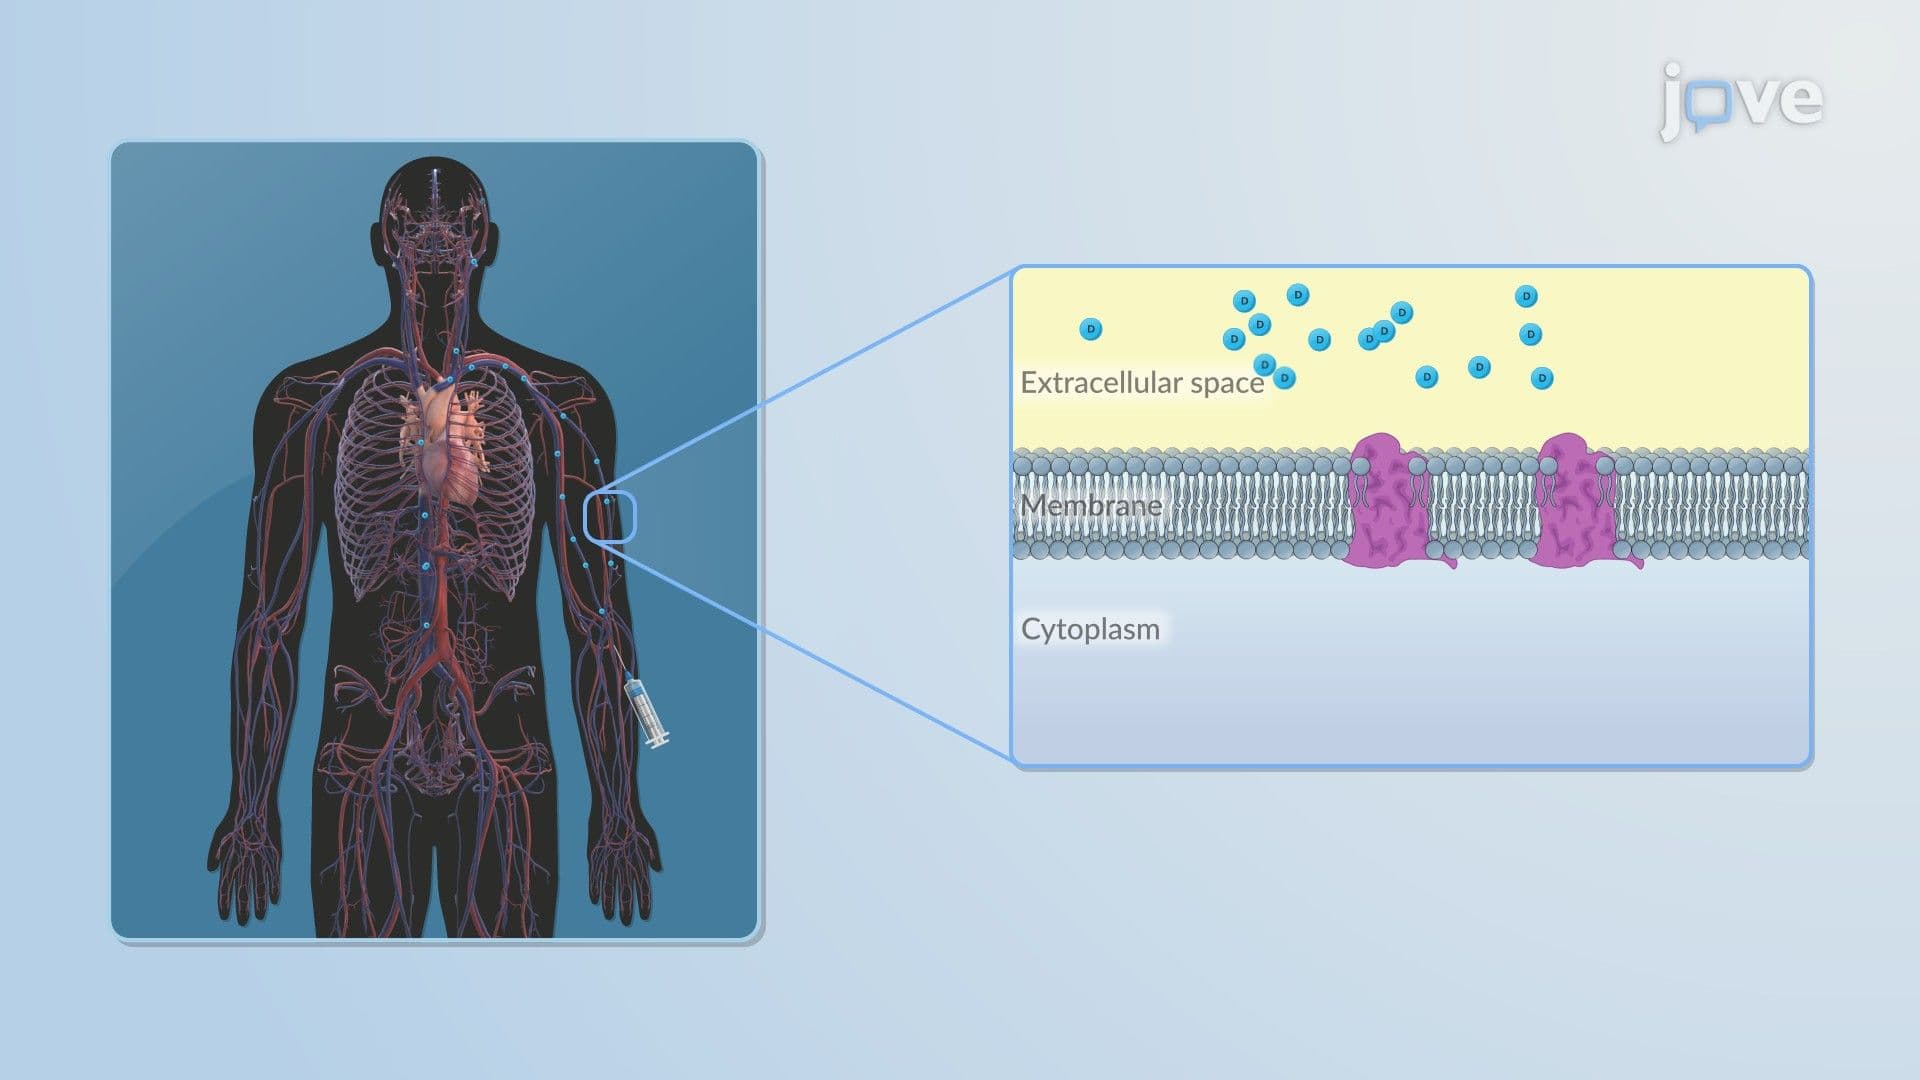
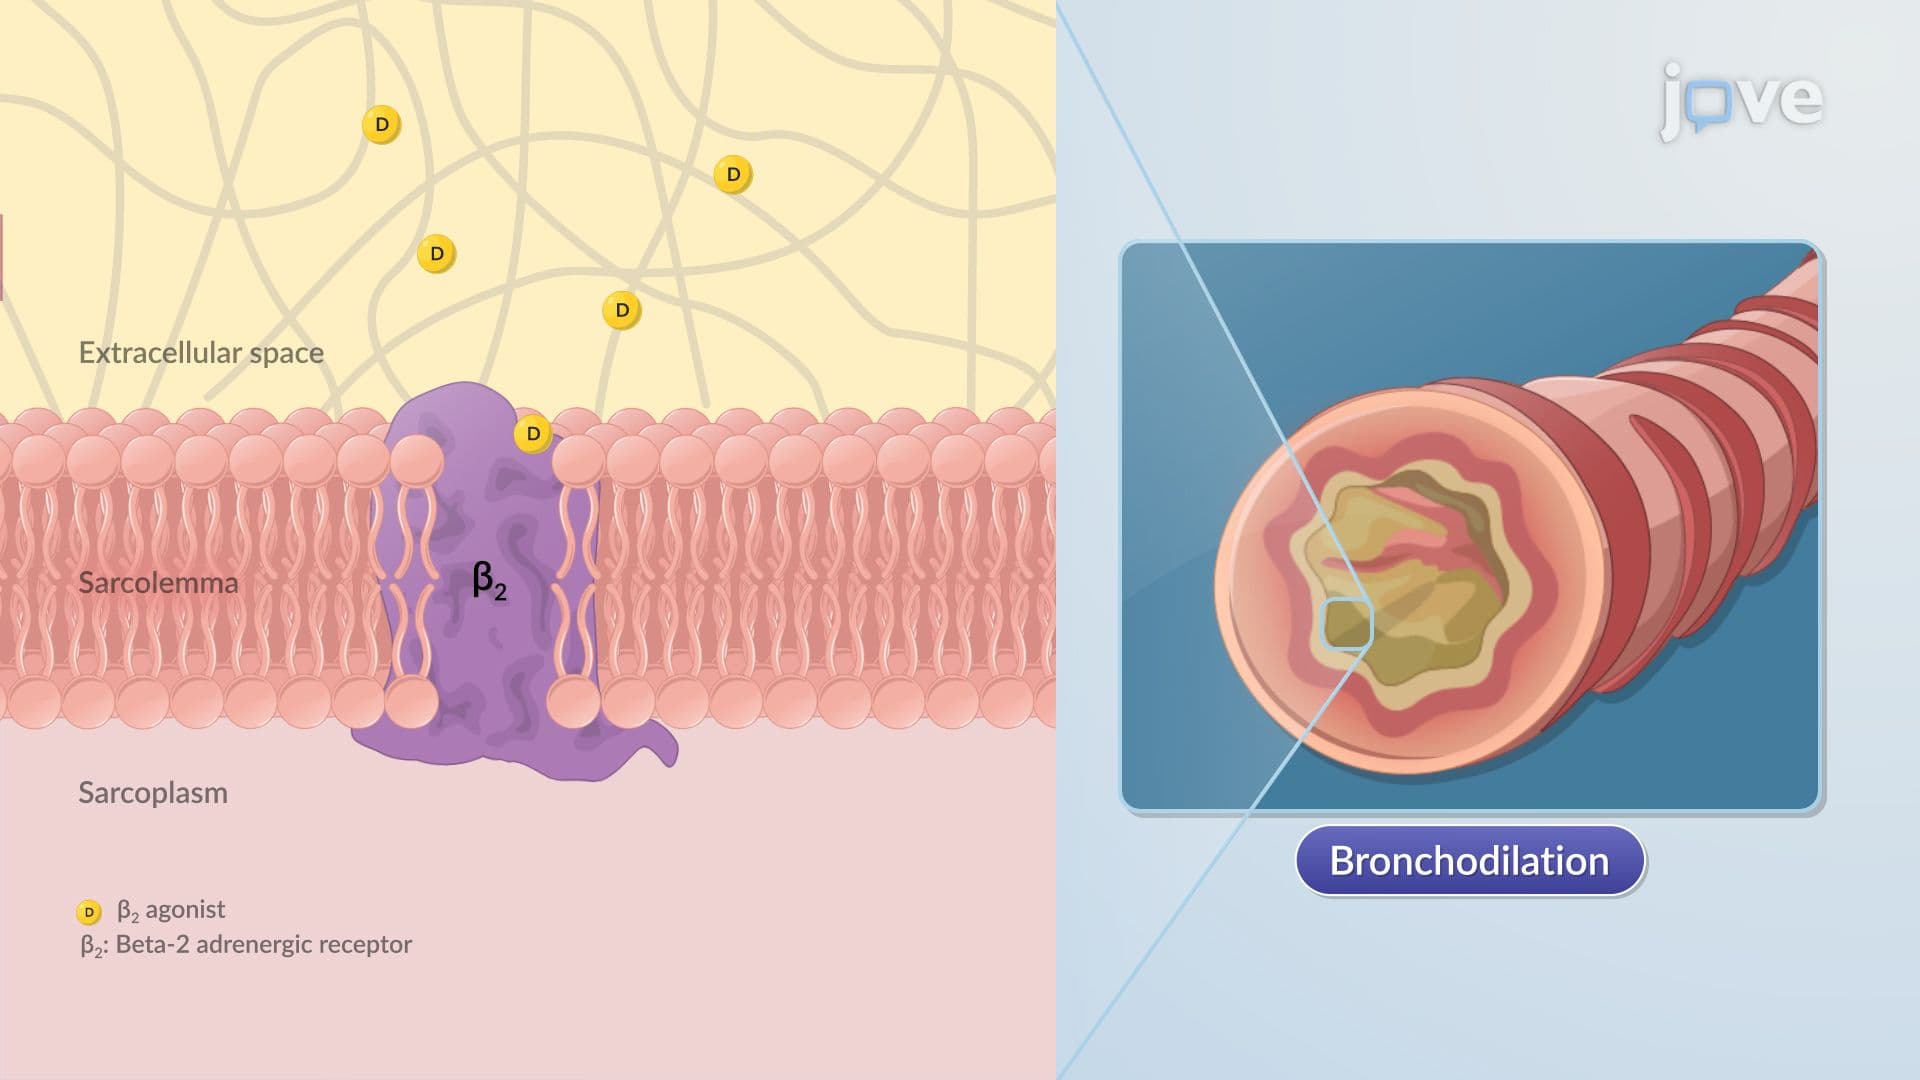
Most practitioners understand that more drug generally means more effect, up to a point. But the Emax model formalizes this intuition into a quantitative framework that drives real decisions. At its core, the model begins with drug-receptor binding: once a drug is administered, it binds to its receptor, forming a complex that triggers a measurable pharmacodynamic response.
The rate at which this complex forms and dissolves depends on two critical rate constants, the association constant (k_on) and the dissociation constant (k_off), as well as the maximum receptor density and drug concentration. At equilibrium, the net rate of change in the drug-receptor complex reaches zero. This equilibrium state is where the model's predictive power lives.
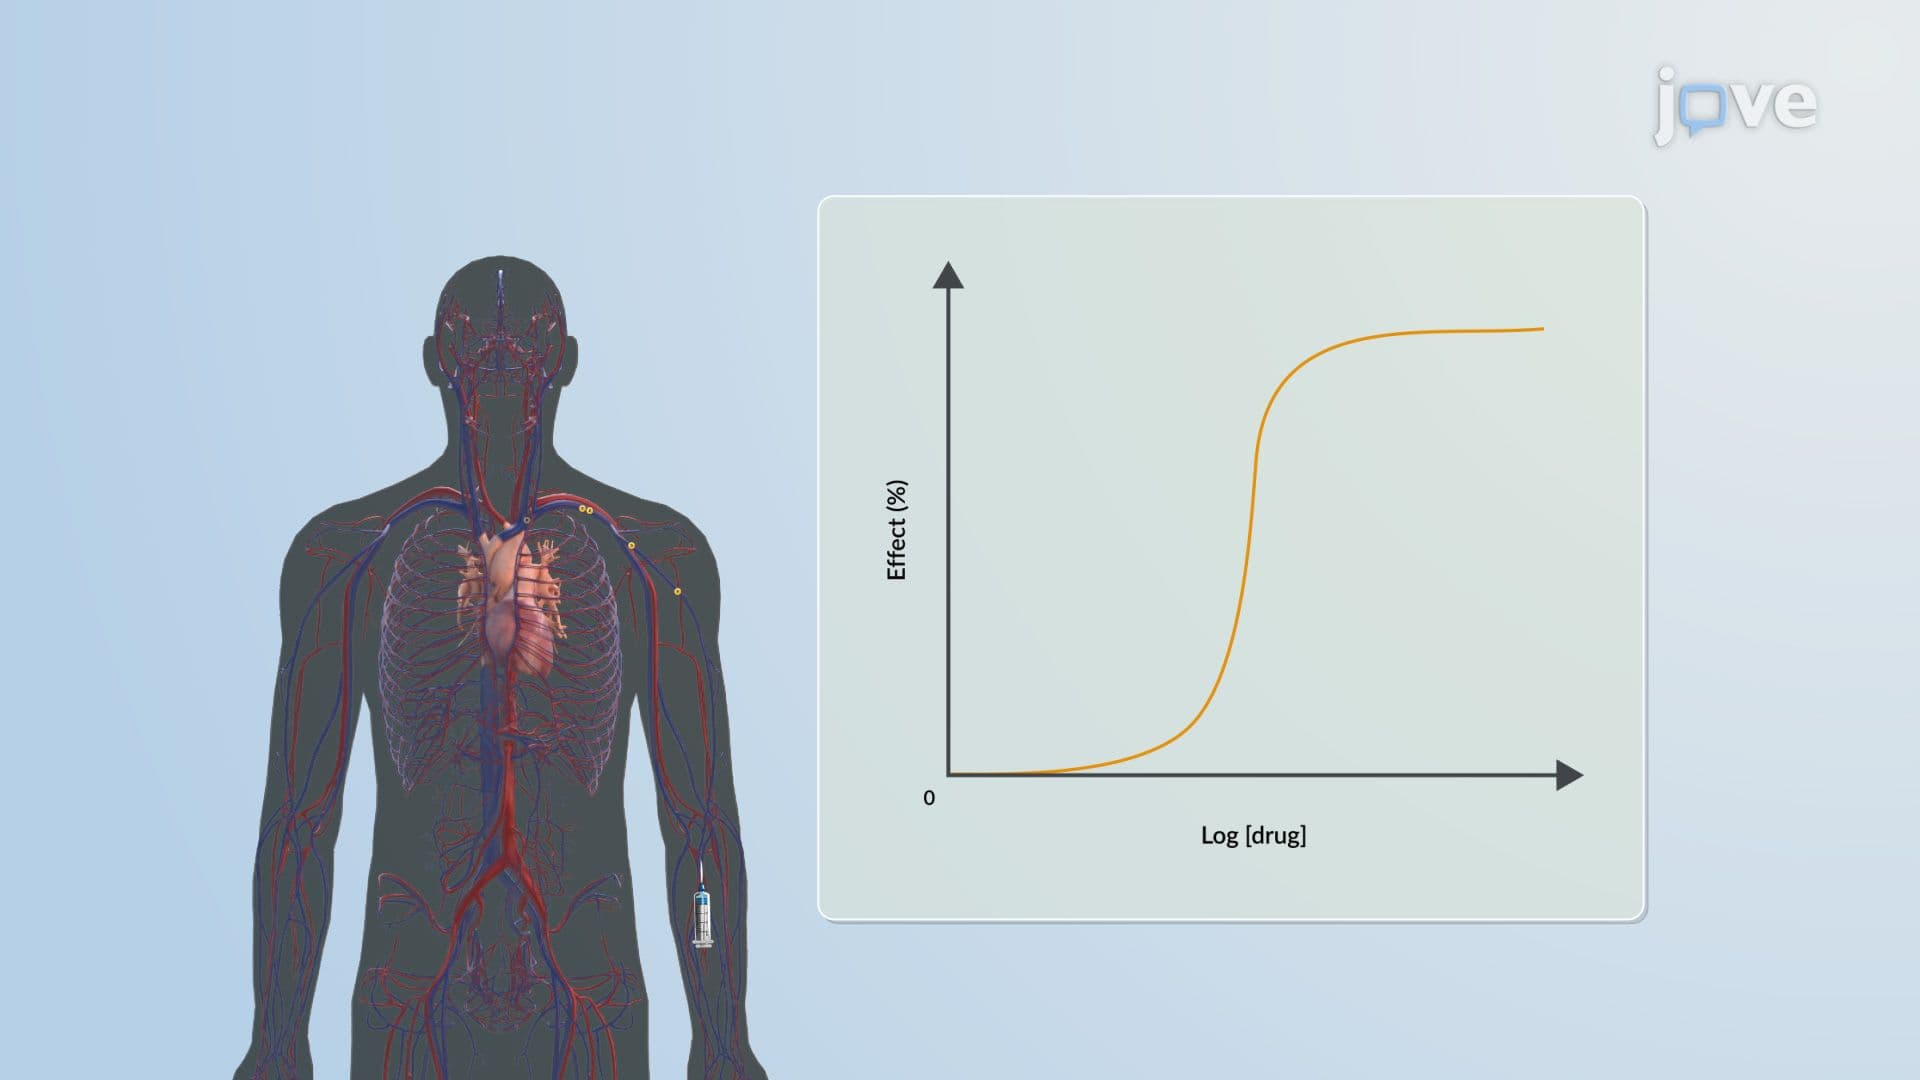
The resulting Emax formula, where the drug effect is proportional to the drug-receptor complex concentration, gives professionals a mathematically grounded tool for predicting therapeutic response across a range of concentrations. Replacing the dissociation constant (K_D) with EC50 yields the clinically familiar Emax concentration-effect equation.
Effective application of the Emax model rests on fluency with three parameters:
1. Emax (Maximum Effect): This is the ceiling of the drug's pharmacodynamic response, the theoretical maximum effect achievable regardless of how much drug concentration increases. It defines the upper boundary of the therapeutic window and sets expectations for what a drug can and cannot deliver.
2. EC50 (Half-Maximal Effective Concentration): EC50 is the plasma concentration at which 50% of the maximum effect is achieved. In practice, this parameter is pivotal for dosing regimen design. A drug with a low EC50 achieves meaningful effect at lower concentrations, a significant advantage in minimizing toxicity risk. Comparing EC50 values across drug candidates is a standard step in PK/PD modeling during drug development.
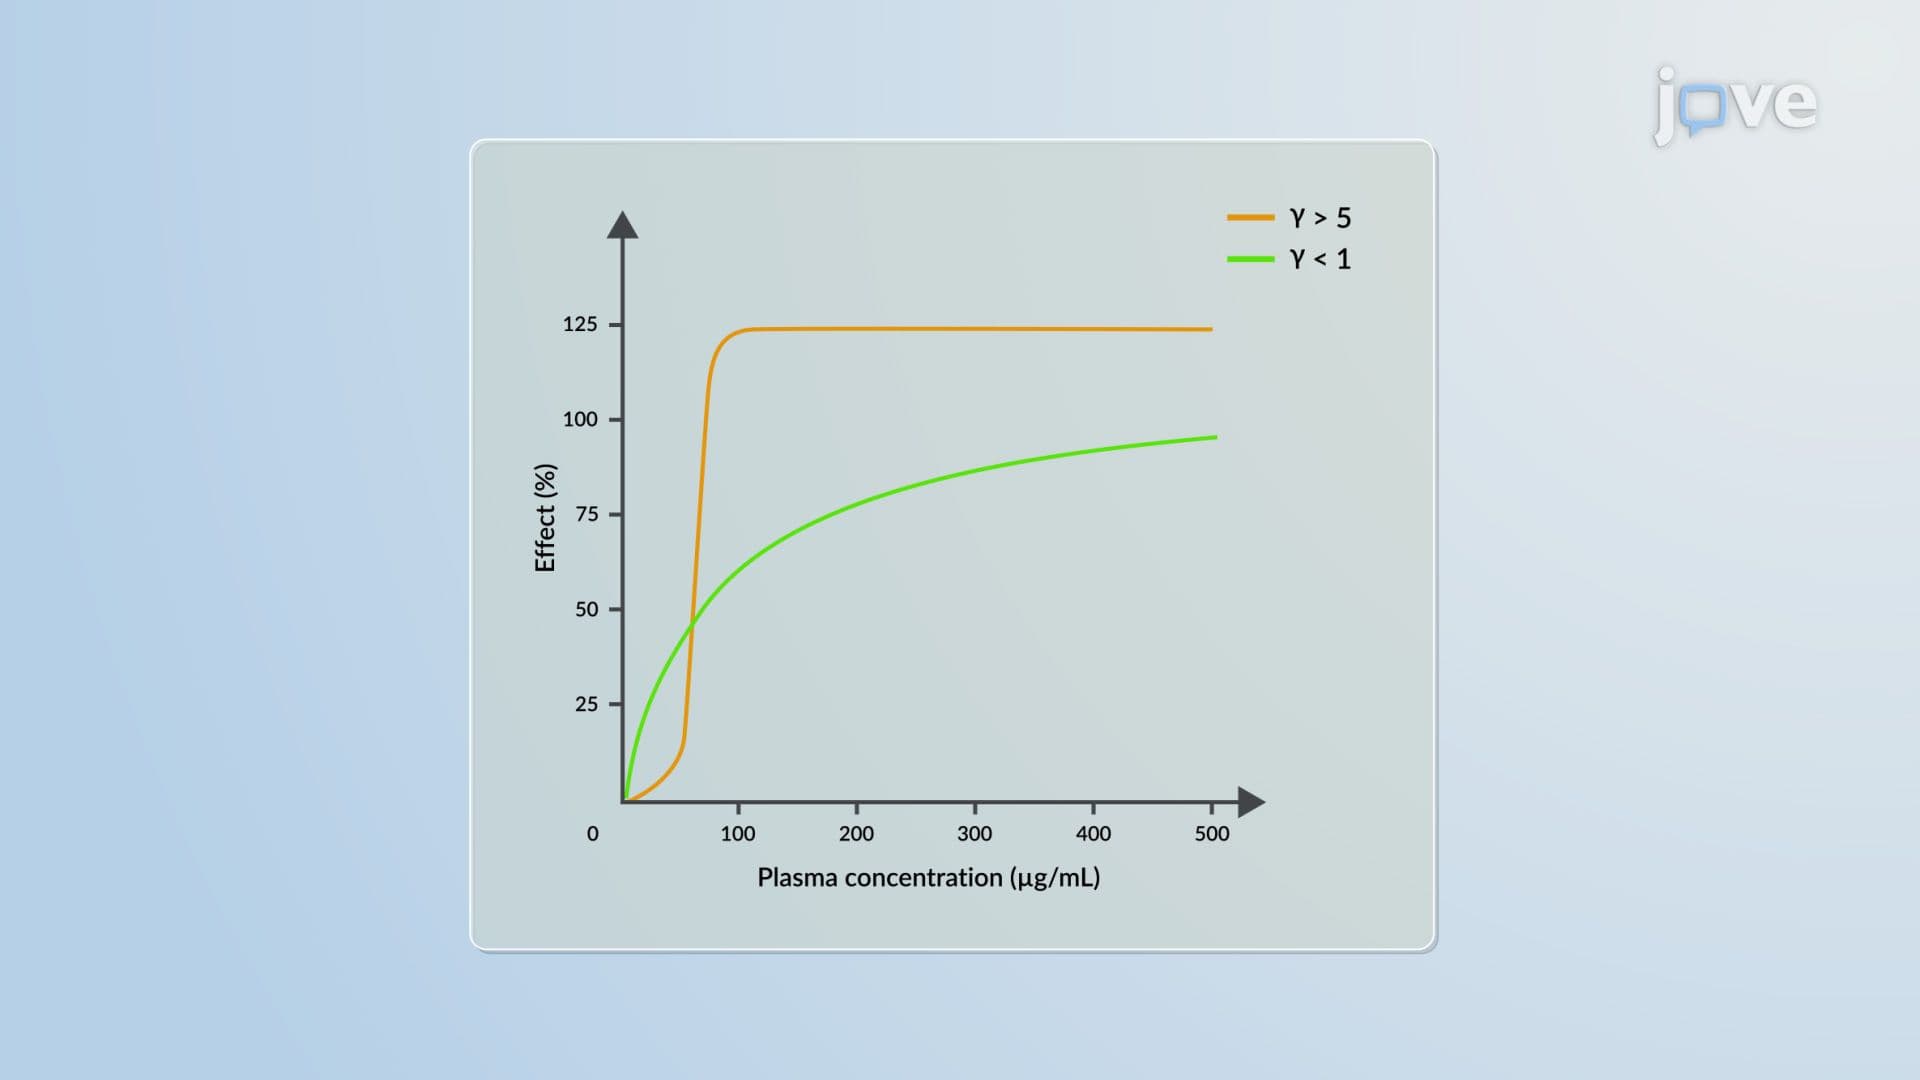
3. The Hill Coefficient (n): This is the parameter most frequently underappreciated by non-specialists. The Hill coefficient governs the steepness of the concentration-effect curve. When n exceeds five, the curve becomes nearly switch-like, small changes in concentration produce dramatic shifts in effect. In clinical terms, this means a missed dose or a modest reduction in plasma concentration can rapidly push a patient below the therapeutic threshold. Conversely, when n is less than one, the curve is broad and shallow, meaning the drug maintains relatively consistent effect across a wider concentration range, a more forgiving pharmacodynamic profile.
For professionals working at the intersection of pharmacology, clinical operations, and regulatory affairs, the Emax model provides a shared quantitative language. Here is how to operationalize it:
Treating EC50 as a fixed constant: EC50 can shift based on patient population, disease state, or drug interactions. Assuming a single EC50 value applies universally is a frequent source of Phase III surprises.
Ignoring the shape of the curve: Two drugs can share the same Emax and EC50 but have entirely different Hill coefficients, meaning their real-world dosing flexibility differs enormously. Always examine the full concentration-effect curve, not just point estimates.
Conflating PK and PD endpoints: PK tells you what the body does to the drug. PD tells you what the drug does to the body. The Emax model is a PD tool. Its value is unlocked only when it is properly linked to validated PK data, which is the essence of integrated PK/PD modeling.
Related Micro-courses