Loading subject page…

- Pharmacokinetics and Pharmacodynamics
- Biostatistics: Introduction
- Statistical Methods to Analyze Parametric Data: ANOVA
Micro-course: Biostatistics: Introduction
11,950 views
Learn key concepts and earn your certificate.






Statistical Methods to Analyze Parametric Data: ANOVA


00:00
01:12
Video Summary: Statistical Methods to Analyze Parametric Guide
Did you know that the FDA uses statistical methods to analyze parametric data when determining whether new medications are significantly more effective than placebos? This Statistical Methods To Analyze Parametric Guide explores ANOVA (Analysis of Variance), a powerful technique that compares means across multiple groups by calculating F-statistics to measure variability. For instance, researchers might use one-way ANOVA to compare recovery times among patients receiving three different COVID-19 treatments at Johns Hopkins Hospital. Watch the full video on JoVE Coach to master this concept with expert-led visuals and step-by-step explanations.
- Understand the fundamental principles of the Statistical Methods To Analyze Parametric Guide, including how ANOVA compares group means using F-statistics
- Identify the key components of ANOVA analysis: between-group variability, within-group variability, and the F-statistic calculation
- Analyze when to apply one-way ANOVA versus two-way ANOVA based on the number of independent variables in your research design
- Compare different experimental scenarios to determine appropriate ANOVA applications, such as drug efficacy studies or educational intervention research
- Evaluate F-statistic results to determine statistical significance and interpret what this means for group differences
- Apply ANOVA methodology to real-world research questions in fields like medicine, psychology, and business analytics
- Recognize the assumptions underlying parametric statistical analysis and when ANOVA is the appropriate choice
- Explore how ANOVA results inform decision-making in clinical trials, quality control, and academic research
Understanding Statistical Methods To Analyze Parametric Data
The Statistical Methods To Analyze Parametric Guide centers on ANOVA, a cornerstone technique in inferential statistics that addresses a fundamental research question: "Are the differences we observe between groups real, or could they be due to random chance?" Unlike t-tests that compare only two groups, ANOVA efficiently analyzes multiple groups simultaneously while controlling for Type I error-the probability of incorrectly concluding that differences exist when they don't.
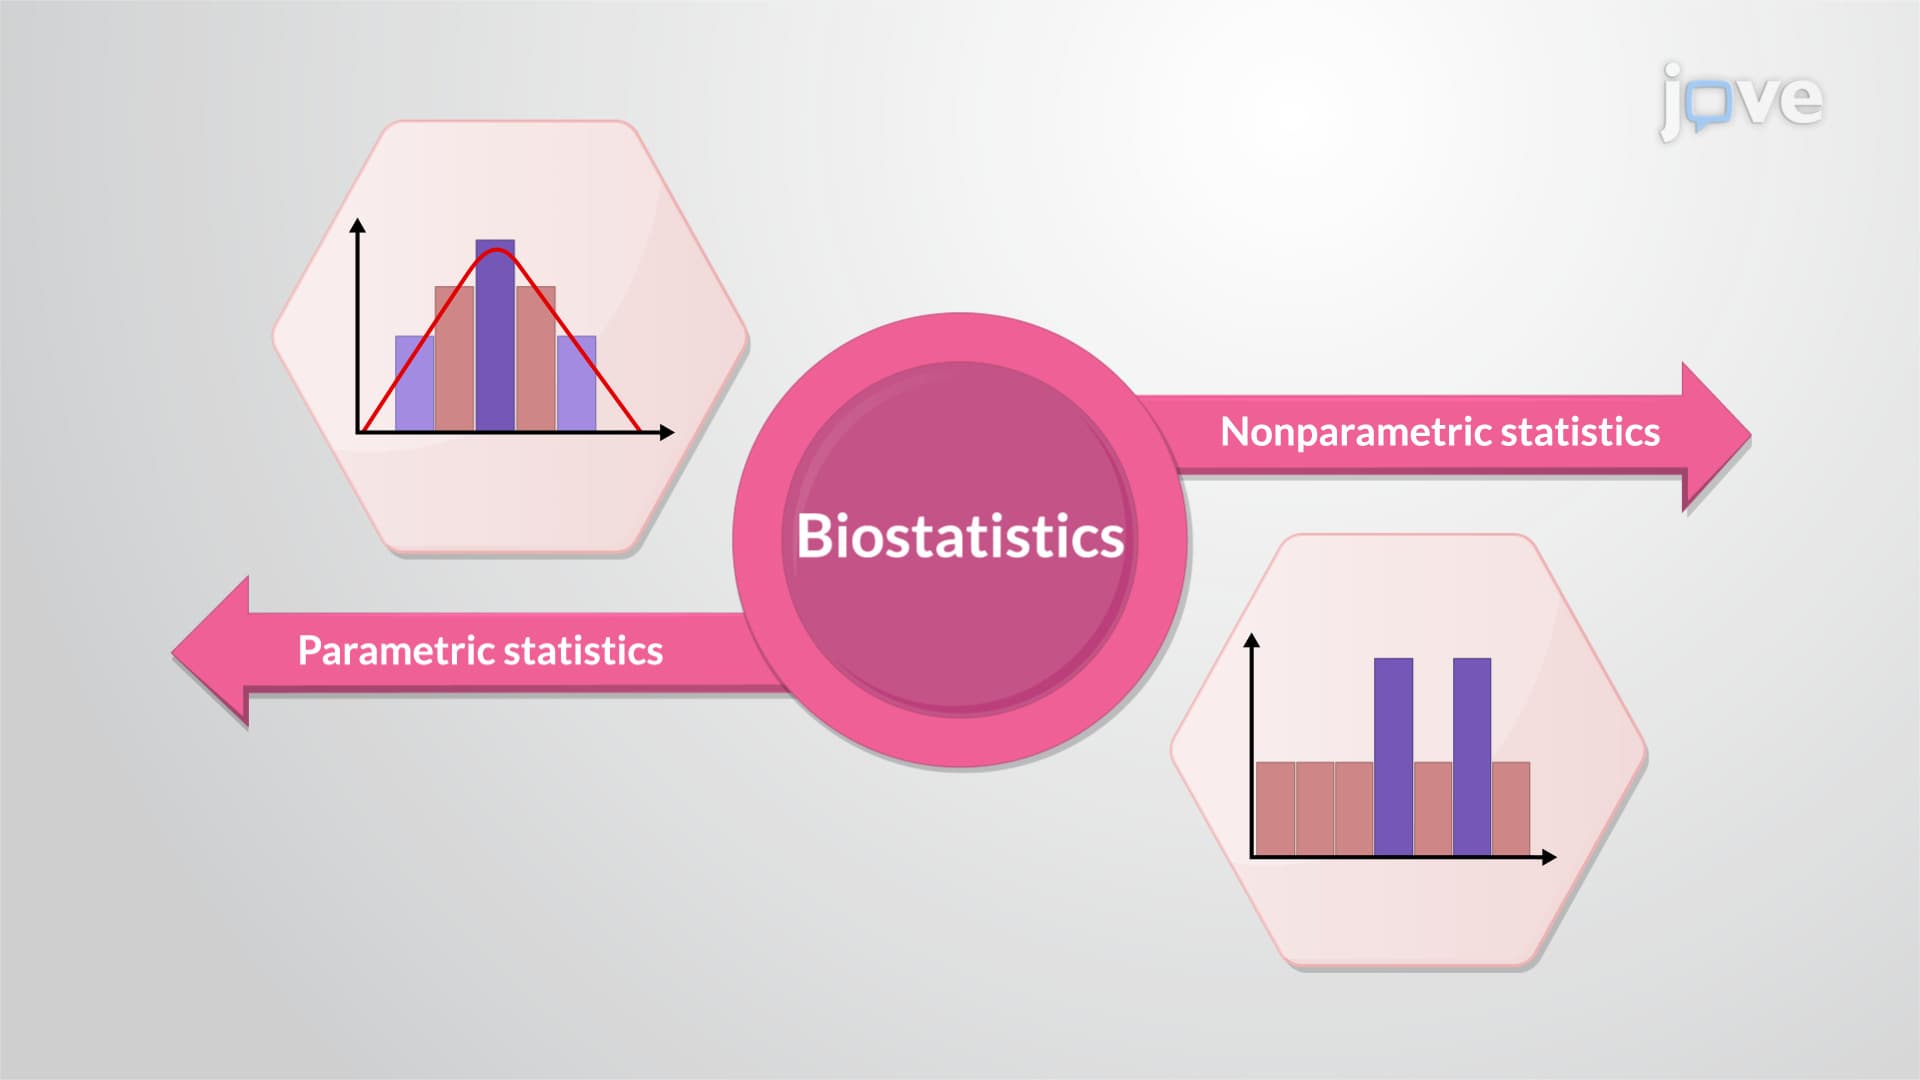
ANOVA operates on several key assumptions: data must be normally distributed, groups should have roughly equal variances (homoscedasticity), and observations must be independent. When these conditions are met, ANOVA provides robust results that guide critical decisions in research and industry.
One-Way ANOVA: Single Factor Analysis
One-way ANOVA examines how a single independent variable affects a dependent variable across multiple groups. The method calculates an F-statistic using the formula: F = Mean Square Between / Mean Square Within. This ratio compares variability between groups to variability within groups.
Consider a practical example: Stanford Medical Center researchers testing three hypertension medications might measure blood pressure reduction in 150 patients (50 per group). If the F-statistic exceeds the critical value at α = 0.05, researchers can conclude that at least one medication differs significantly from the others. This application appears frequently on AP Statistics exams and college-level biostatistics courses, where students must interpret ANOVA tables and draw appropriate conclusions.
Two-Way ANOVA: Multi-Factor Complexity
Two-way ANOVA introduces sophistication by examining two independent variables simultaneously, plus their interaction effect. This design answers three questions: Does Factor A have a main effect? Does Factor B have a main effect? Do Factors A and B interact?
For instance, UCLA researchers studying academic performance might analyze both teaching method (lecture vs. interactive) and class size (small vs. large) effects on test scores. The interaction term reveals whether teaching method effectiveness depends on class size-crucial information for educational policy decisions.
Real-World Applications and Exam Preparation
ANOVA appears across diverse fields: pharmaceutical companies use it for drug trials, manufacturing firms apply it for quality control, and social scientists employ it for behavioral research. On the MCAT, students encounter ANOVA in psychological and sociological passages. College statistics courses emphasize interpreting ANOVA output, understanding degrees of freedom calculations, and recognizing when assumptions are violated.
Success with ANOVA requires understanding both computational aspects and practical interpretation-skills that transfer directly to graduate-level research and professional data analysis roles.
Frequently Asked Questions
The Statistical Methods To Analyze Parametric Guide focuses on ANOVA, which compares means across multiple groups by calculating F-statistics. ANOVA works by measuring how much groups differ from each other relative to how much individuals within groups vary. When between-group differences are large compared to within-group variation, we conclude that group differences are statistically significant rather than due to random chance.
ANOVA frequently appears on AP Statistics free-response questions, typically worth 12-15 points. You'll analyze ANOVA tables, interpret F-statistics and p-values, check assumptions, and draw conclusions about group differences. The College Board often uses scenarios like comparing teaching methods or testing product quality across multiple conditions.
MCAT questions focus on interpreting ANOVA results rather than calculations. You'll encounter passages about psychological experiments or social research where ANOVA was used to analyze group differences. Questions test your ability to understand what significant F-statistics mean for research conclusions and study validity.
The Mayo Clinic uses ANOVA to compare treatment outcomes across multiple therapy groups. For example, researchers might compare pain reduction scores among arthritis patients receiving physical therapy, medication, or combined treatment. ANOVA helps determine if treatments differ significantly, informing evidence-based treatment guidelines.
ANOVA builds naturally on concepts you already know like means and standard deviations. While the F-statistic formula looks complex, the underlying logic is intuitive: comparing how different groups are from each other versus how variable individuals are within groups. Most students grasp the concept once they work through a few practice problems.
Focus on interpreting ANOVA tables rather than memorizing formulas-most exams provide the calculations. Practice identifying when to use one-way versus two-way ANOVA, checking assumptions like normality and equal variances, and translating statistical results into plain English conclusions. Work through problems using real data from your textbook.
Progress to post-hoc tests (like Tukey's HSD) that identify which specific groups differ after finding a significant ANOVA result. Then explore regression analysis, which examines relationships between continuous variables rather than group comparisons. Advanced students can study ANCOVA (Analysis of Covariance), which combines ANOVA and regression techniques.
Related Micro-courses

29 Concepts


15 Concepts