Loading subject page…

- Pharmacokinetics and Pharmacodynamics
- Biostatistics: Introduction
- Variability: Analysis
Micro-course: Biostatistics: Introduction
11,950 views
Learn key concepts and earn your certificate.





Variability: Analysis


00:00
01:11
Video Summary: What Is Variability Analysis
Why do some clinical trials show wildly different results even when testing the same treatment? Variability analysis reveals how data points scatter around averages, helping researchers and healthcare professionals understand the true picture behind the numbers. From measuring blood pressure variations in hypertensive patients at Johns Hopkins to comparing glucose levels across diabetic patient groups at Mayo Clinic, understanding data dispersion is crucial for making informed medical decisions. Watch the full video on JoVE Coach to master this concept with expert-led visuals and step-by-step explanations.
- Understand what variability analysis is and why it's essential for interpreting biological and medical data accurately
- Identify the five key measures of variability: range, confidence intervals, standard deviation, variance, and coefficient of variation
- Analyze how standard deviation and variance quantify the spread of data points around the mean in clinical datasets
- Compare different treatment groups in medical studies using appropriate variability measures
- Evaluate the reliability of research findings by interpreting confidence intervals for population parameters
- Apply the coefficient of variation to compare relative variability between datasets with different scales or units
- Recognize when to use each variability measure based on the type of data and research question
- Explore real-world applications of variability analysis in clinical trials, epidemiological studies, and diagnostic testing
Understanding Variability Analysis: The Foundation of Data Interpretation
Variability analysis forms the backbone of statistical interpretation in biological sciences, providing critical insights into how data points spread around central tendencies. Unlike simple averages that only tell part of the story, variability measures reveal the reliability, consistency, and meaningful patterns hidden within datasets-essential skills for AP Statistics, college biostatistics courses, and MCAT preparation.
Core Measures of Variability in Biological Data
The range serves as the simplest variability measure, calculated by subtracting the minimum value from the maximum value in a dataset. While straightforward, range can be misleading in medical research due to outliers. For instance, if measuring recovery times for cardiac patients at Cleveland Clinic, one extremely long recovery could skew the range dramatically, masking the typical patient experience.
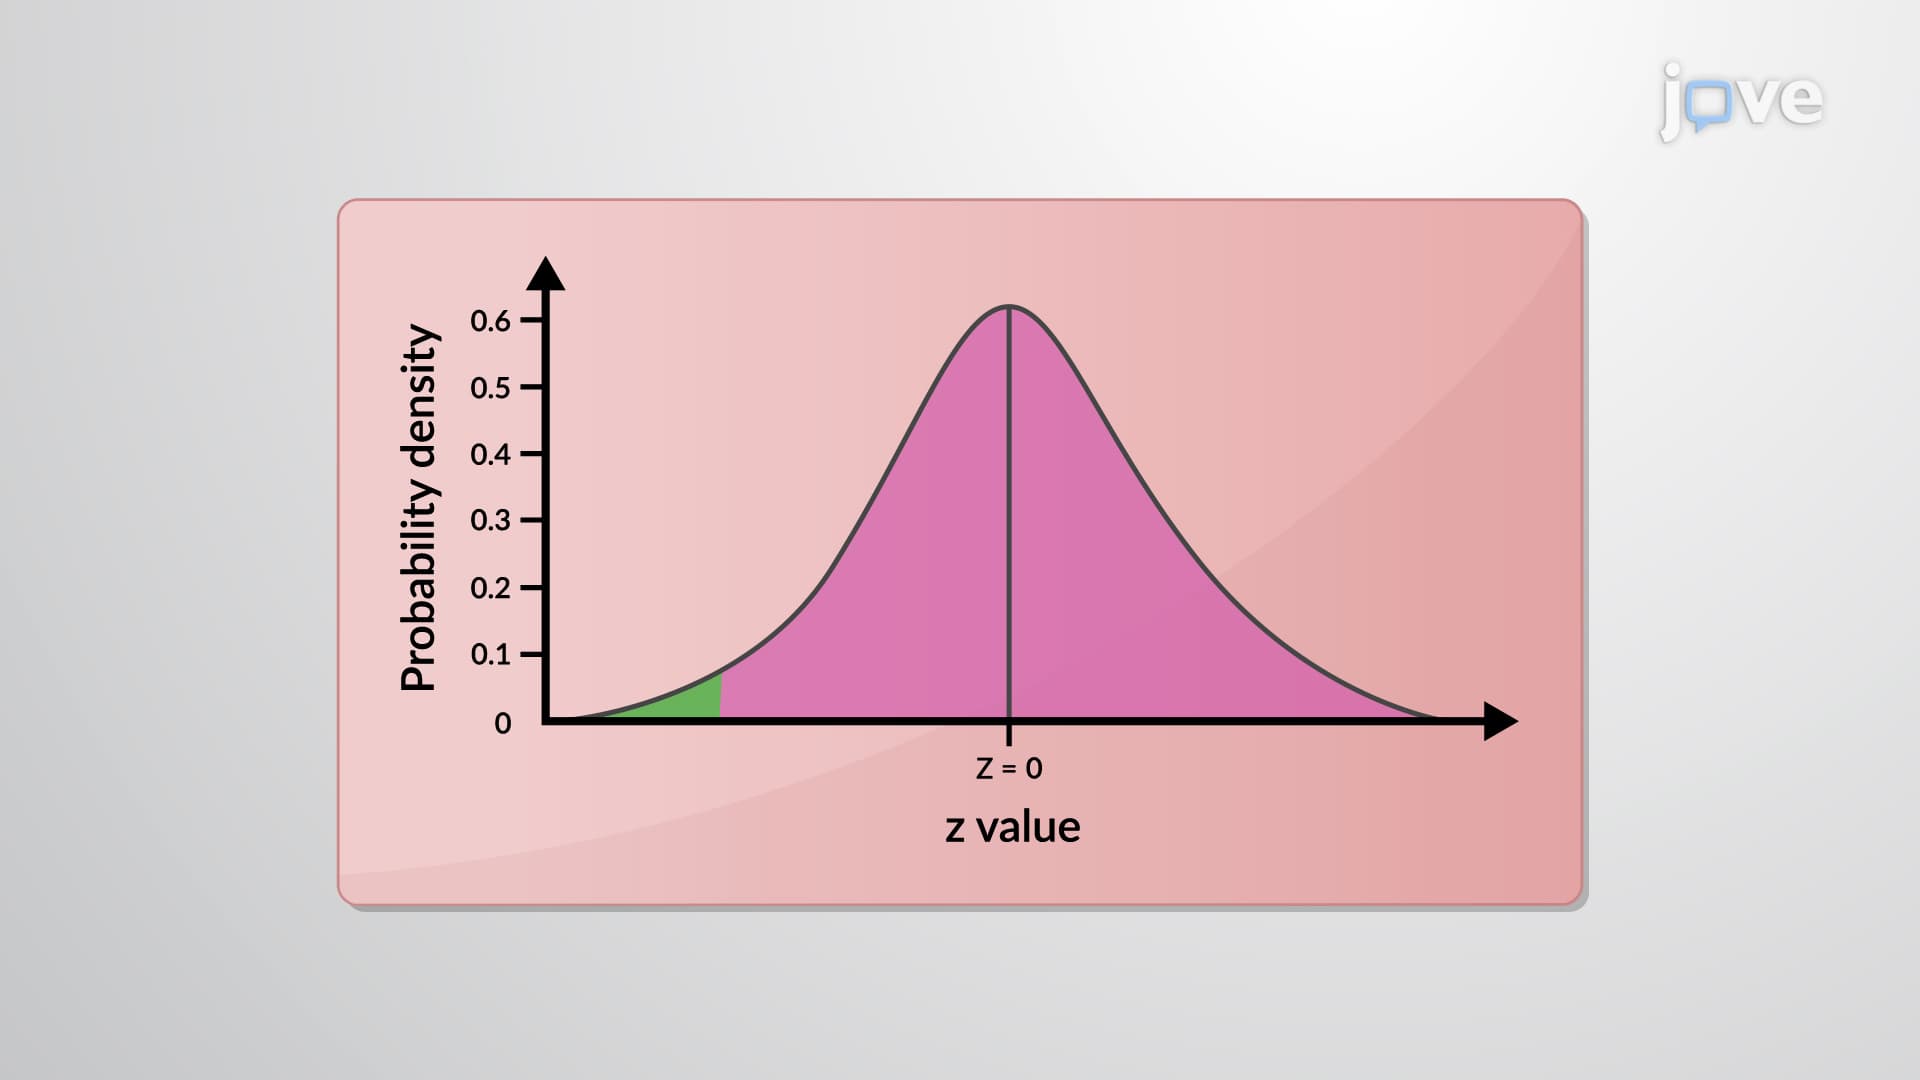
Standard deviation and variance provide more robust measures of spread. Standard deviation represents the average distance each data point deviates from the mean, expressed in the same units as the original data. Variance equals the standard deviation squared, amplifying larger deviations. In pharmaceutical research, these measures help determine whether a new blood pressure medication consistently reduces readings or shows unpredictable effects across patients.
Confidence intervals offer probabilistic ranges for population parameters based on sample data. A 95% confidence interval for average cholesterol levels means we're 95% confident the true population mean falls within that range. This concept appears frequently on AP Statistics exams and is crucial for interpreting research studies in pre-med coursework.
Comparative Analysis and Practical Applications
The coefficient of variation (CV) enables comparison between datasets with different scales or units by expressing standard deviation as a percentage of the mean. This proves invaluable when comparing variability across different measurements-for example, comparing the consistency of blood glucose monitors versus blood pressure cuffs in clinical settings.
These concepts directly apply to standardized test success and career preparation. The MCAT frequently tests interpretation of confidence intervals in research passages, while nursing entrance exams like HESI A2 require understanding of data variability in patient monitoring scenarios. Medical school curricula emphasize these principles in biostatistics courses, epidemiology studies, and evidence-based medicine training.
Frequently Asked Questions
Variability analysis examines how data points spread around central values like the mean or median. It's crucial in biological sciences because it reveals data reliability, helps compare treatment effectiveness, and enables researchers to make confident conclusions about population characteristics. Understanding variability distinguishes between meaningful differences and random fluctuations in medical research.
The MCAT frequently includes passages requiring confidence interval interpretation and standard deviation analysis in research contexts. AP Statistics dedicates entire units to measures of variability, including calculation and interpretation of standard deviation, variance, and coefficient of variation. Expect questions about comparing treatment groups and analyzing experimental reliability.
Prioritize standard deviation, variance, and confidence intervals as these appear most frequently in college coursework and exams. Master the coefficient of variation for comparing different measurement scales. Many professors emphasize interpretation over calculation, so focus on understanding what each measure reveals about data patterns and research conclusions.
Hospitals use variability analysis to monitor patient vital signs, evaluate treatment consistency, and improve quality control. For example, ICU teams analyze heart rate variability to detect patient deterioration, while pharmacy departments use coefficient of variation to ensure medication dosing accuracy across different patient populations and medical devices.
Basic algebra and understanding of averages provide sufficient foundation for variability analysis concepts. Most biological applications focus on interpretation rather than complex calculations. Scientific calculators or statistical software typically handle computations, while your role involves understanding what results mean for research conclusions and practical applications.
Practice interpreting real research data rather than just memorizing formulas. Create study scenarios using medical examples, work through confidence interval interpretations, and focus on explaining what different variability measures reveal about data quality. Use practice problems from AP Statistics prep books and MCAT question banks for realistic exam preparation.
Variability analysis skills transfer directly to genetics (population variation), ecology (species distribution patterns), biochemistry (enzyme activity consistency), and physiology (homeostatic regulation). These concepts also prepare you for research methodology courses, graduate school applications, and evidence-based practice in healthcare careers.
Progress to hypothesis testing, correlation analysis, and regression techniques. Explore advanced topics like ANOVA for comparing multiple groups, non-parametric statistics for non-normal data, and experimental design principles. These concepts build naturally on variability analysis foundations and appear frequently in upper-level biology and pre-health curricula.
Related Micro-courses

29 Concepts


15 Concepts