Loading subject page…


130,500 views

Video Summary: What Is Energy Diagrams I
Ever wonder why a roller coaster at Six Flags can complete a full loop without falling off the track? Energy diagrams I reveal the secret by plotting how potential energy changes with position when conservative forces act on objects. This fundamental physics concept explains everything from skateboarding tricks at local parks to spacecraft trajectories launched from NASA's Kennedy Space Center. Understanding what is energy diagrams I helps predict motion patterns and energy transformations in mechanical systems. Watch the full video on JoVE Coach to master this concept with expert-led visuals and step-by-step explanations.
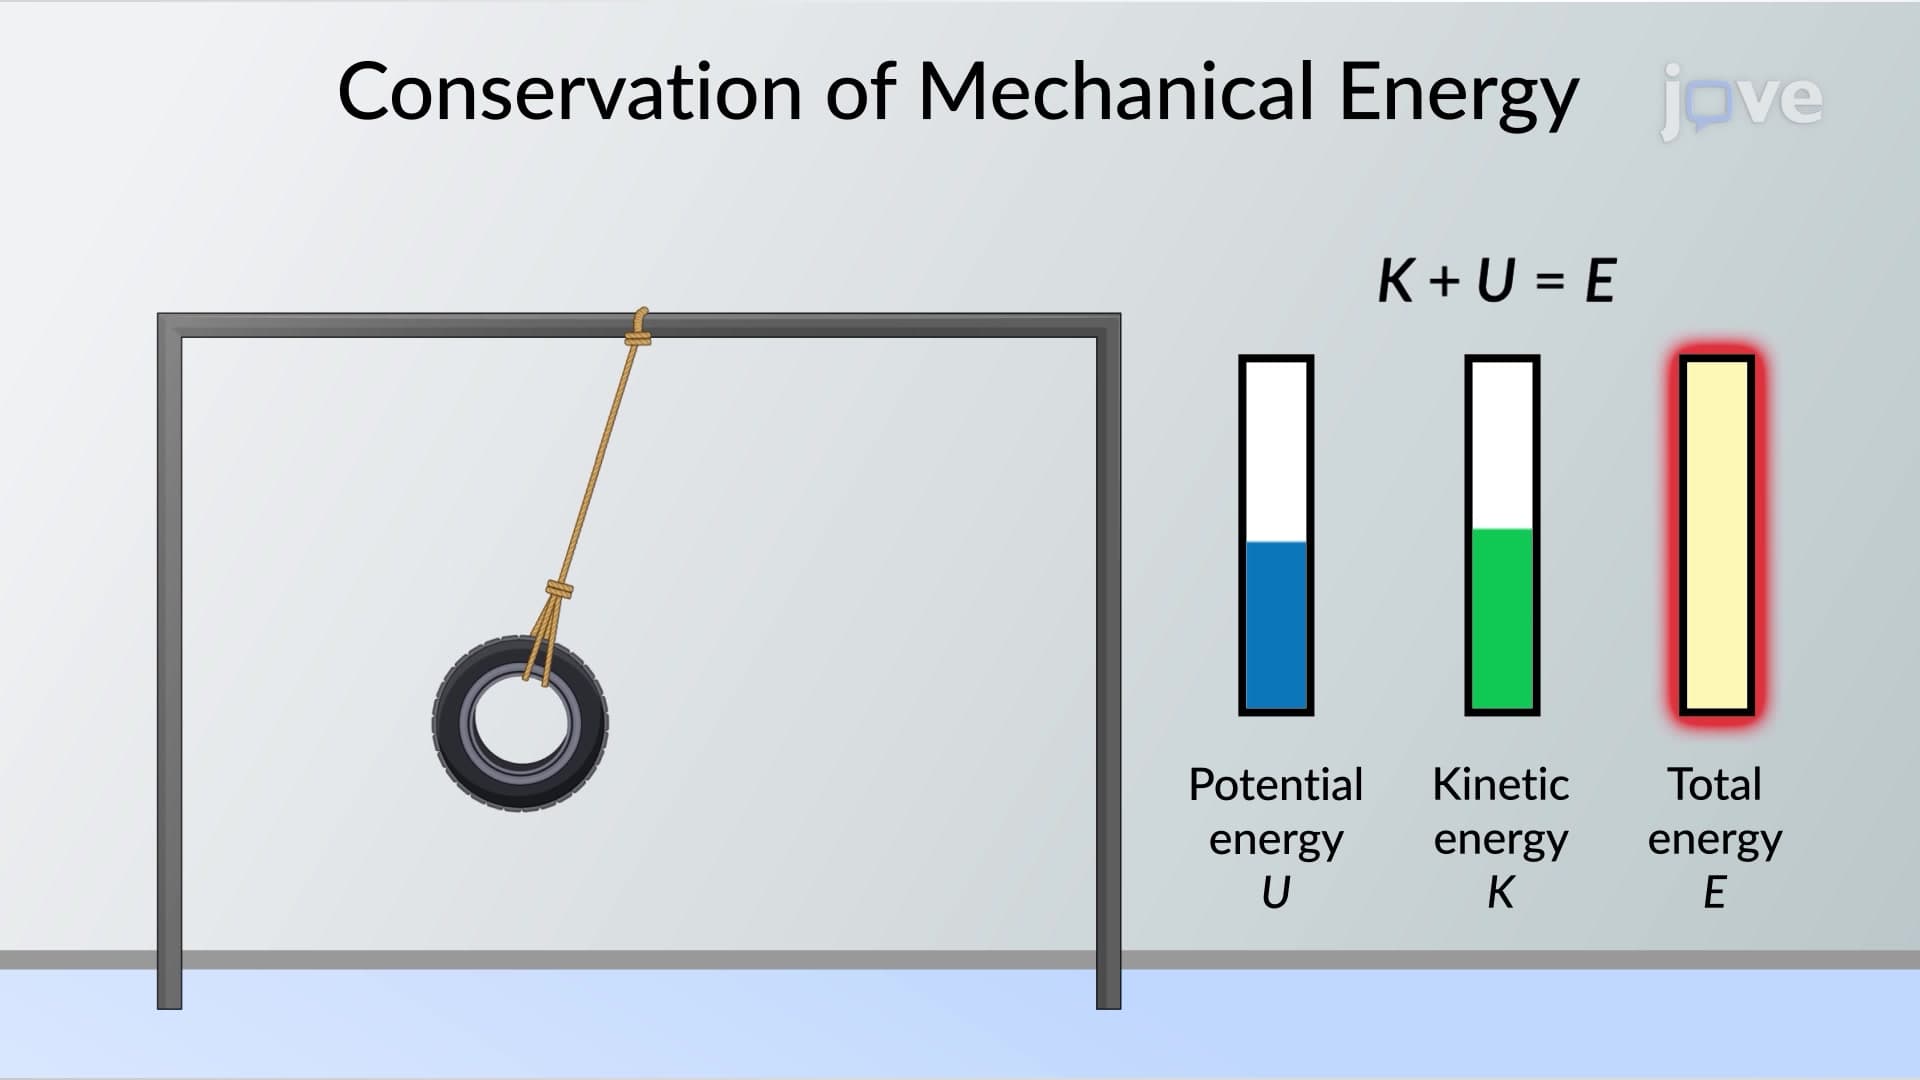
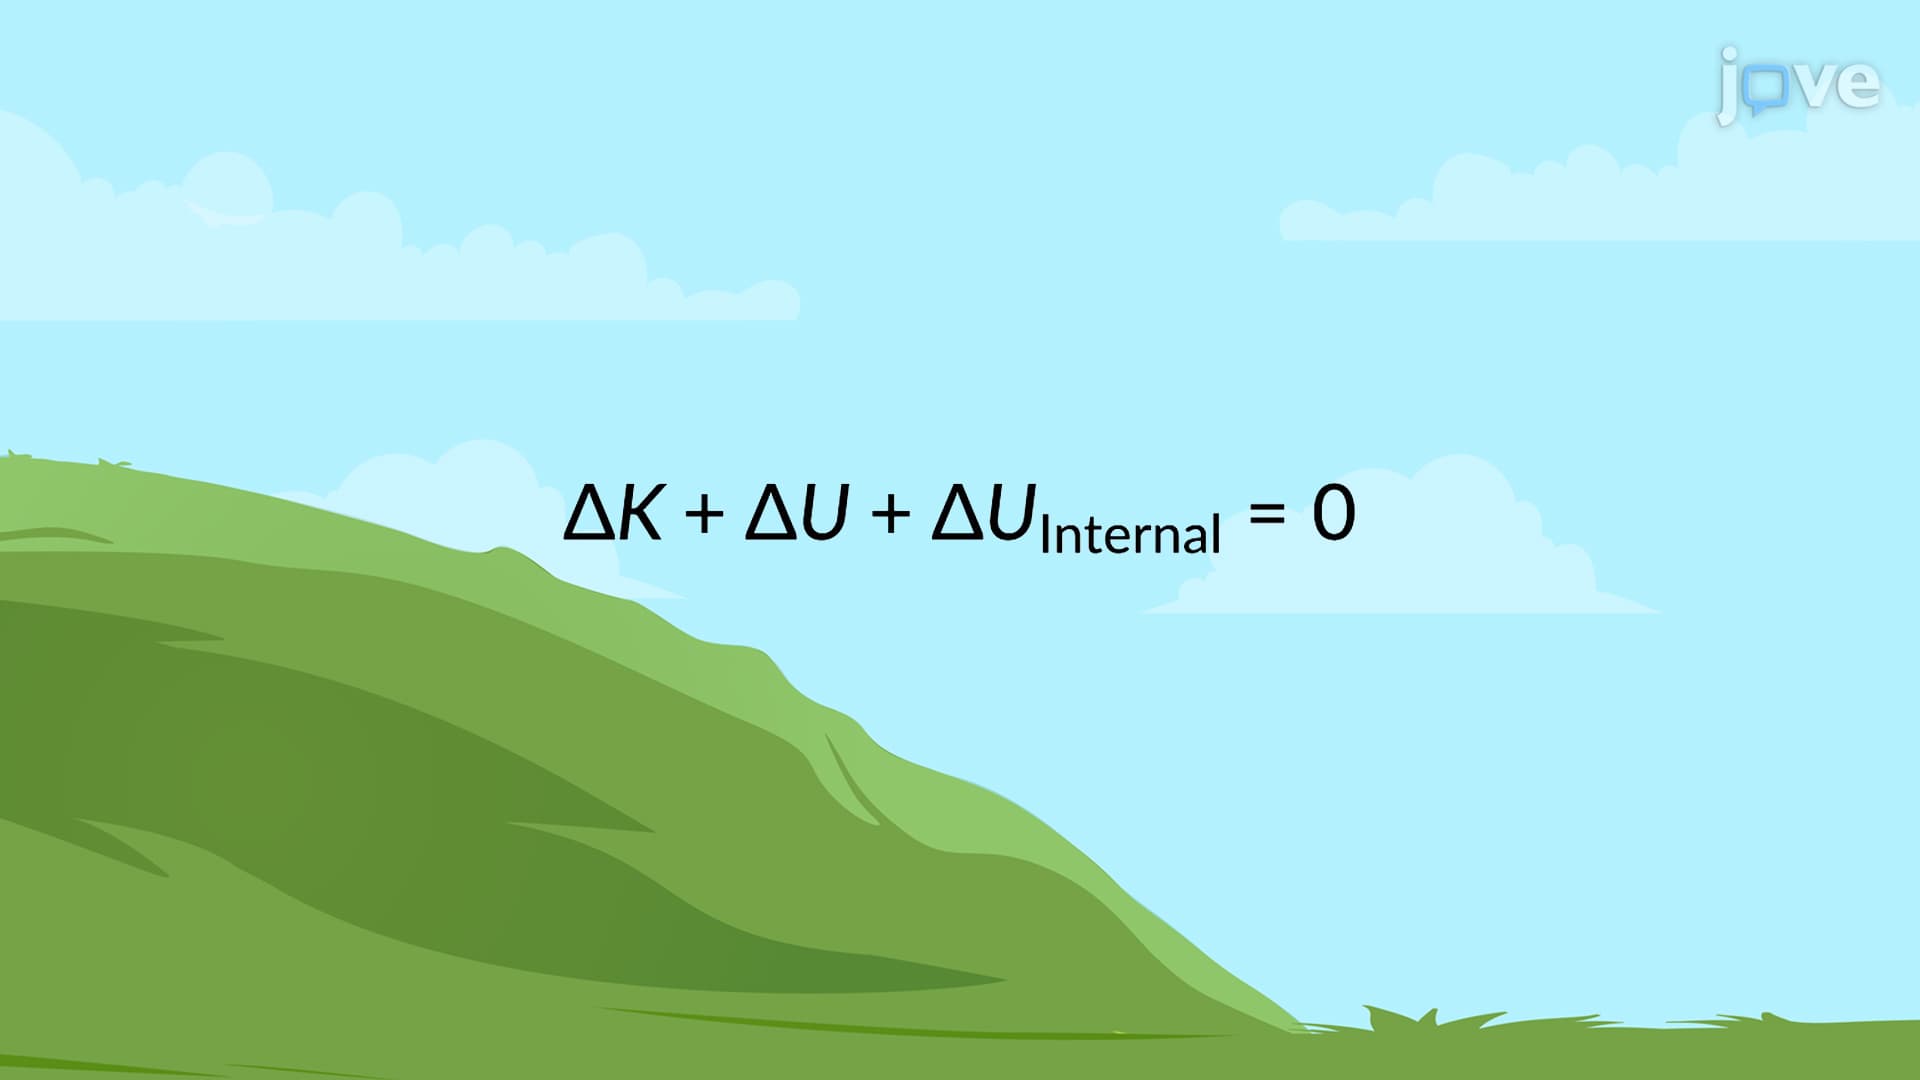
Energy diagrams I serve as powerful visual tools that map potential energy against position for objects under conservative forces. These graphical representations become essential for analyzing mechanical systems where energy transforms between kinetic and potential forms while total mechanical energy remains constant.
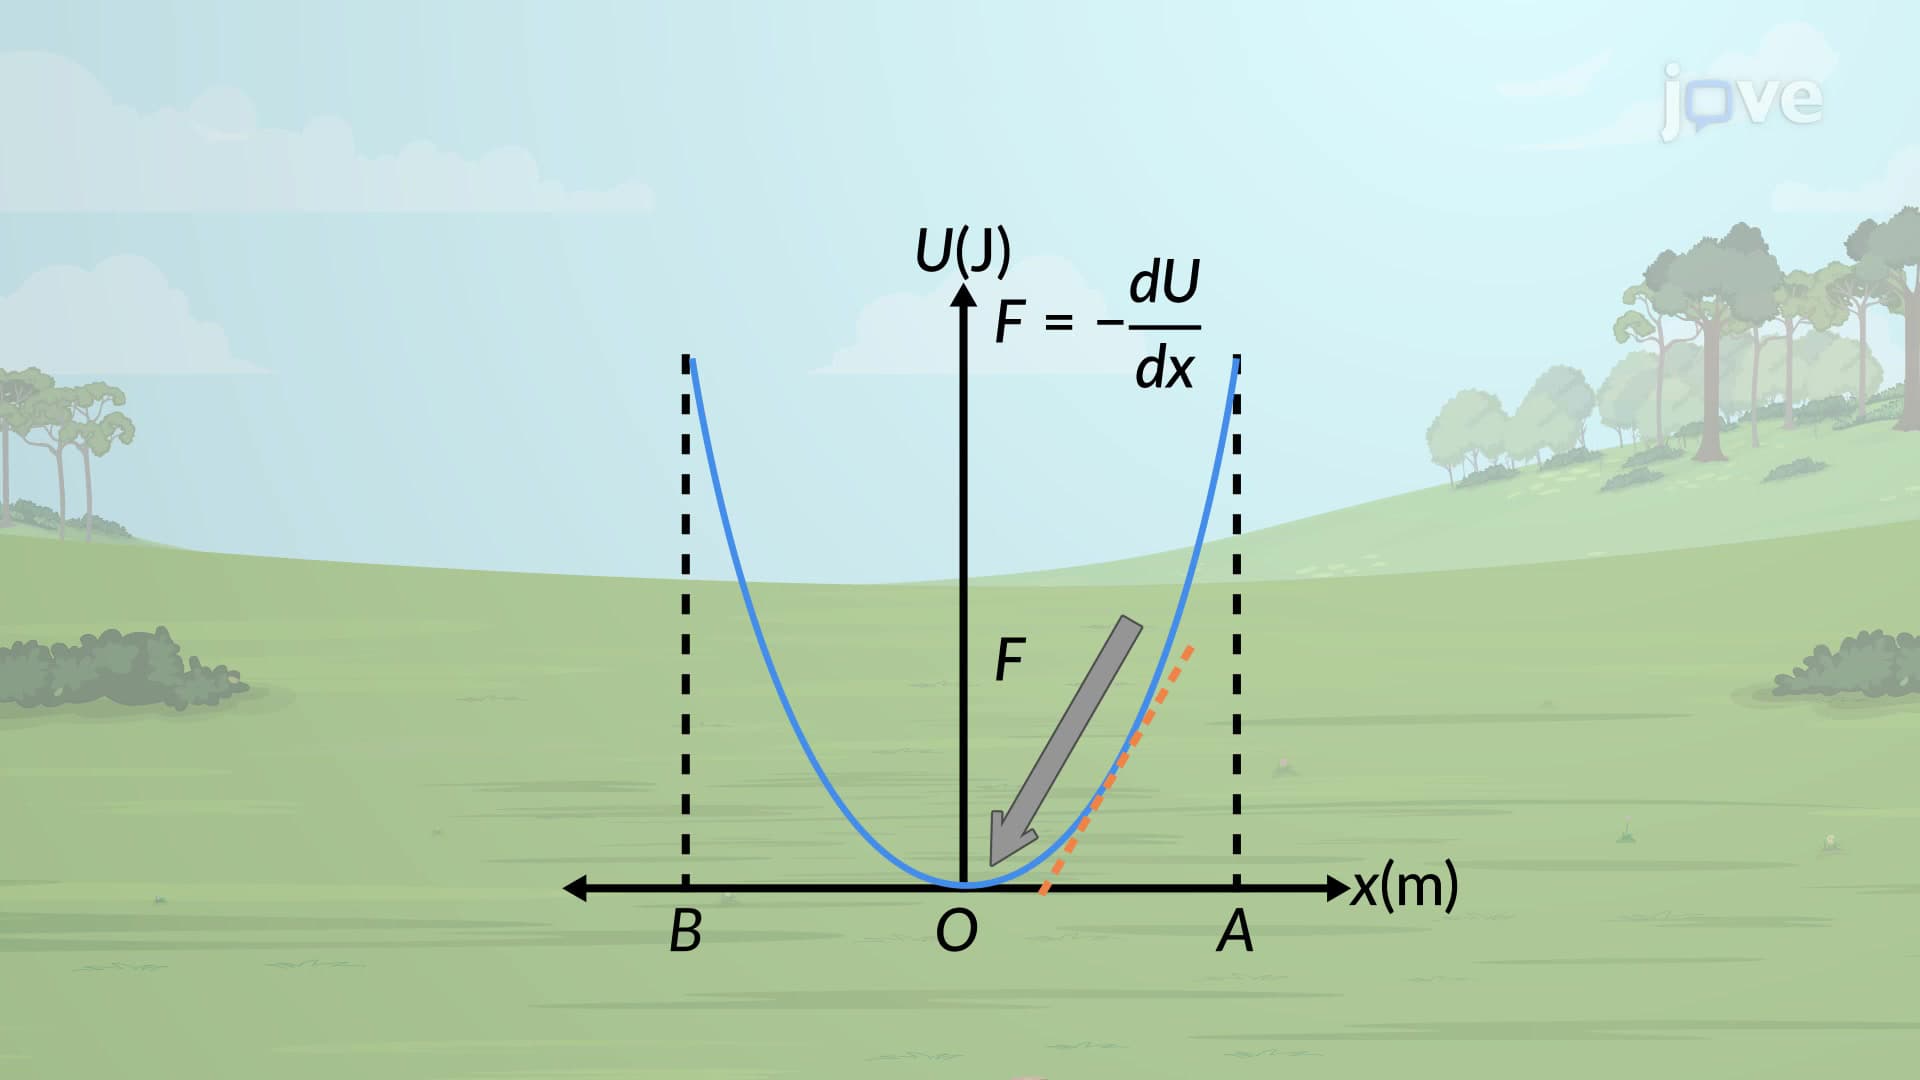
In these diagrams, the vertical axis represents potential energy (U), while the horizontal axis shows position (x). The resulting curve reveals how stored energy varies with location, providing crucial insights into object behavior. When studying physics at the high school AP level or introductory college courses, mastering energy diagrams becomes fundamental for solving complex motion problems.
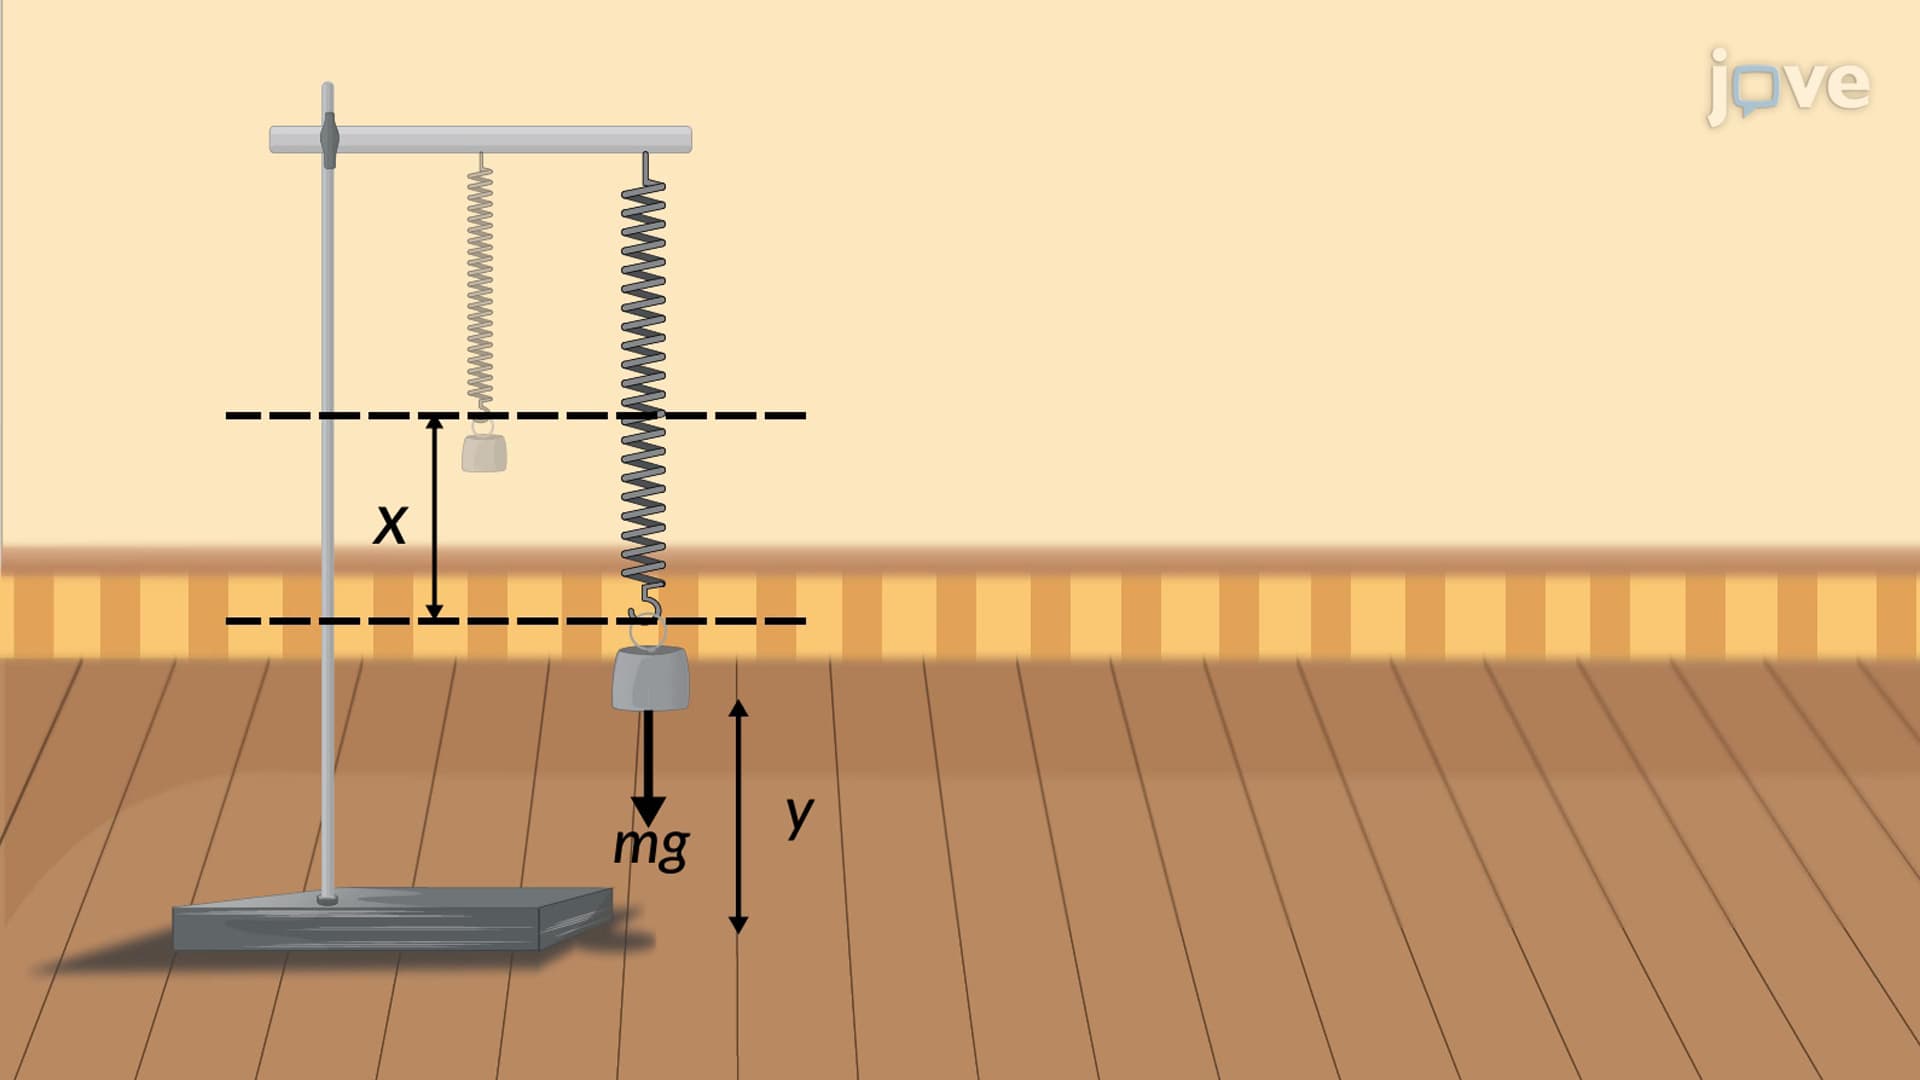
Conservative forces, such as gravity and spring forces, enable energy diagram analysis because they preserve total mechanical energy. Unlike friction, these forces allow energy to convert between kinetic and potential forms without loss. This principle appears frequently on standardized tests like the SAT Physics Subject Test and AP Physics exams.
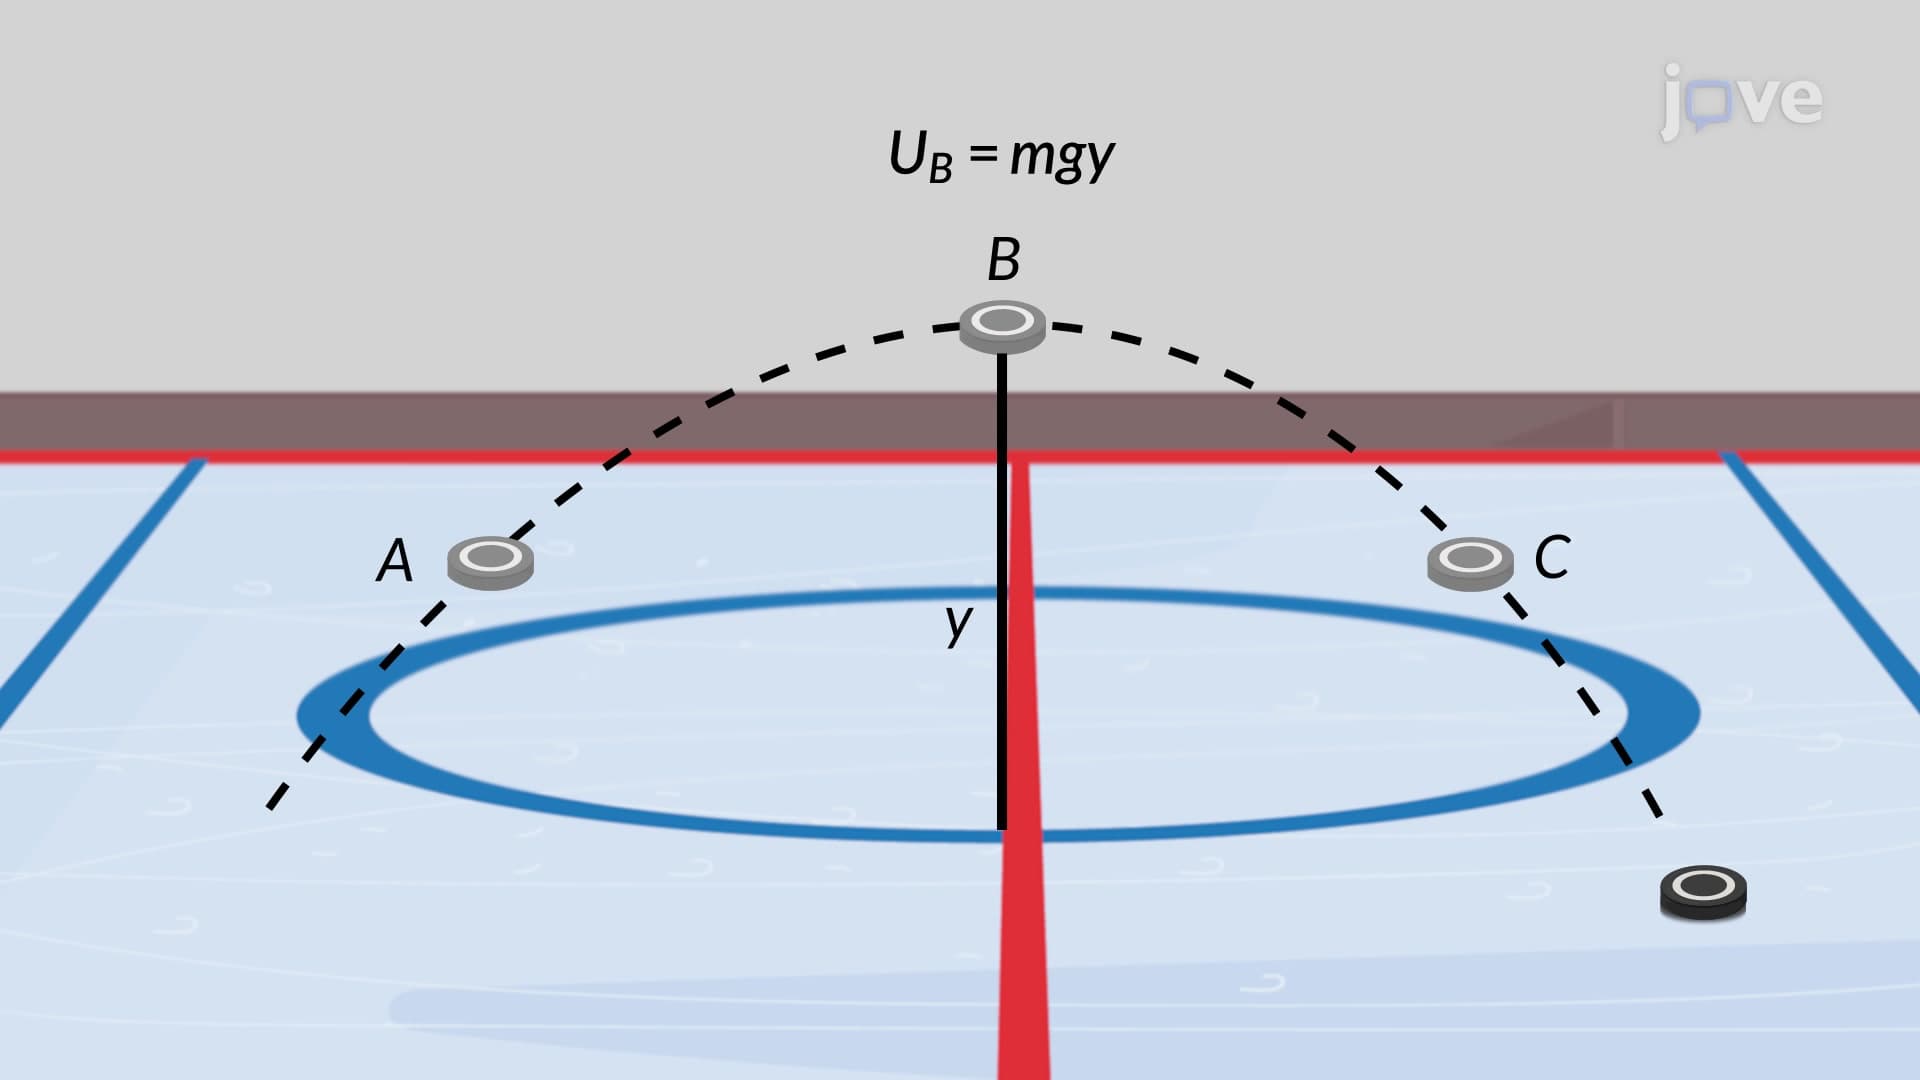
Consider a pendulum swinging in a grandfather clock, a classic American timepiece. At the highest points, gravitational potential energy reaches maximum while kinetic energy approaches zero. At the bottom of the swing, kinetic energy peaks while potential energy minimizes. The energy diagram for this system shows a parabolic curve representing gravitational potential energy.
Energy diagrams reveal critical information about object motion. Total mechanical energy appears as a horizontal line on the diagram, representing the sum of kinetic and potential energies. Where this line intersects the potential energy curve indicates turning points, locations where objects momentarily stop before reversing direction.
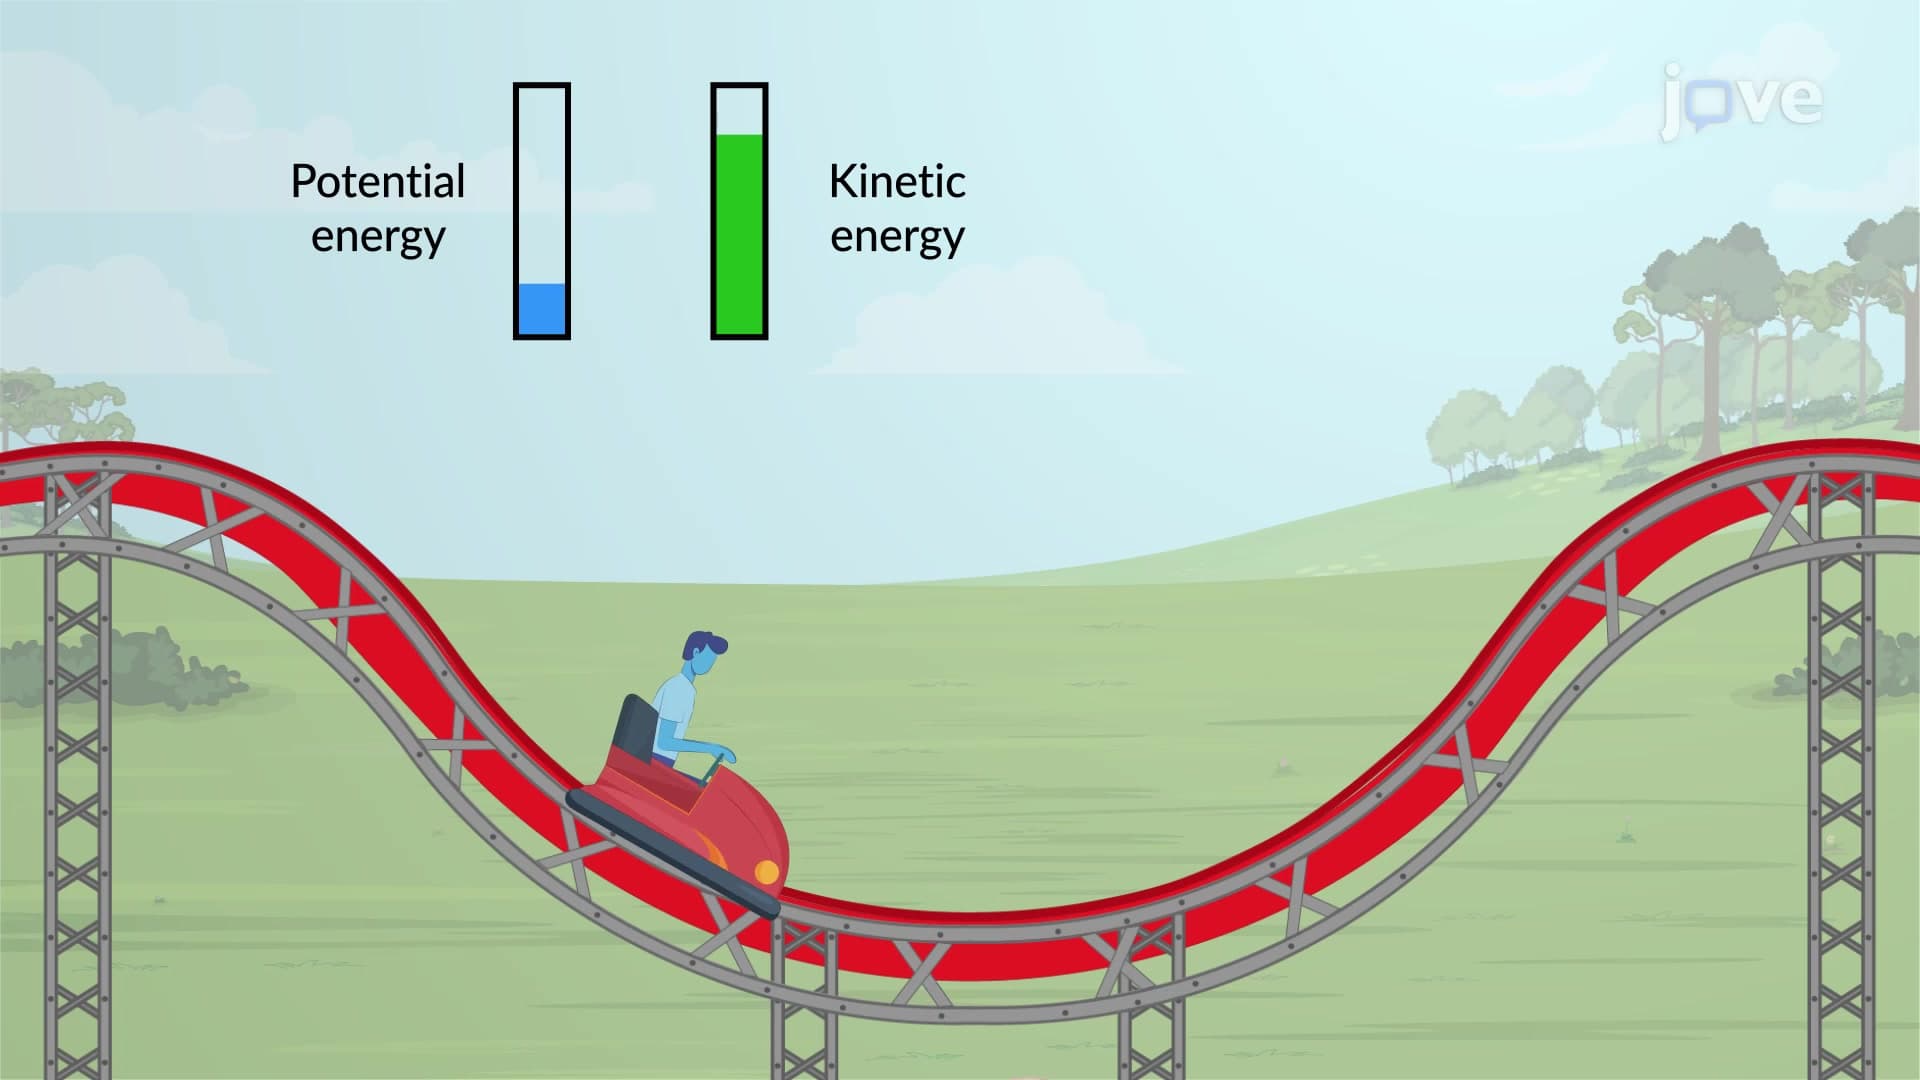
The vertical distance between the total energy line and potential energy curve represents kinetic energy at any position. This relationship proves invaluable when solving problems involving roller coasters, ski slopes, or satellite orbits, scenarios commonly featured in MCAT physics sections and engineering entrance exams.
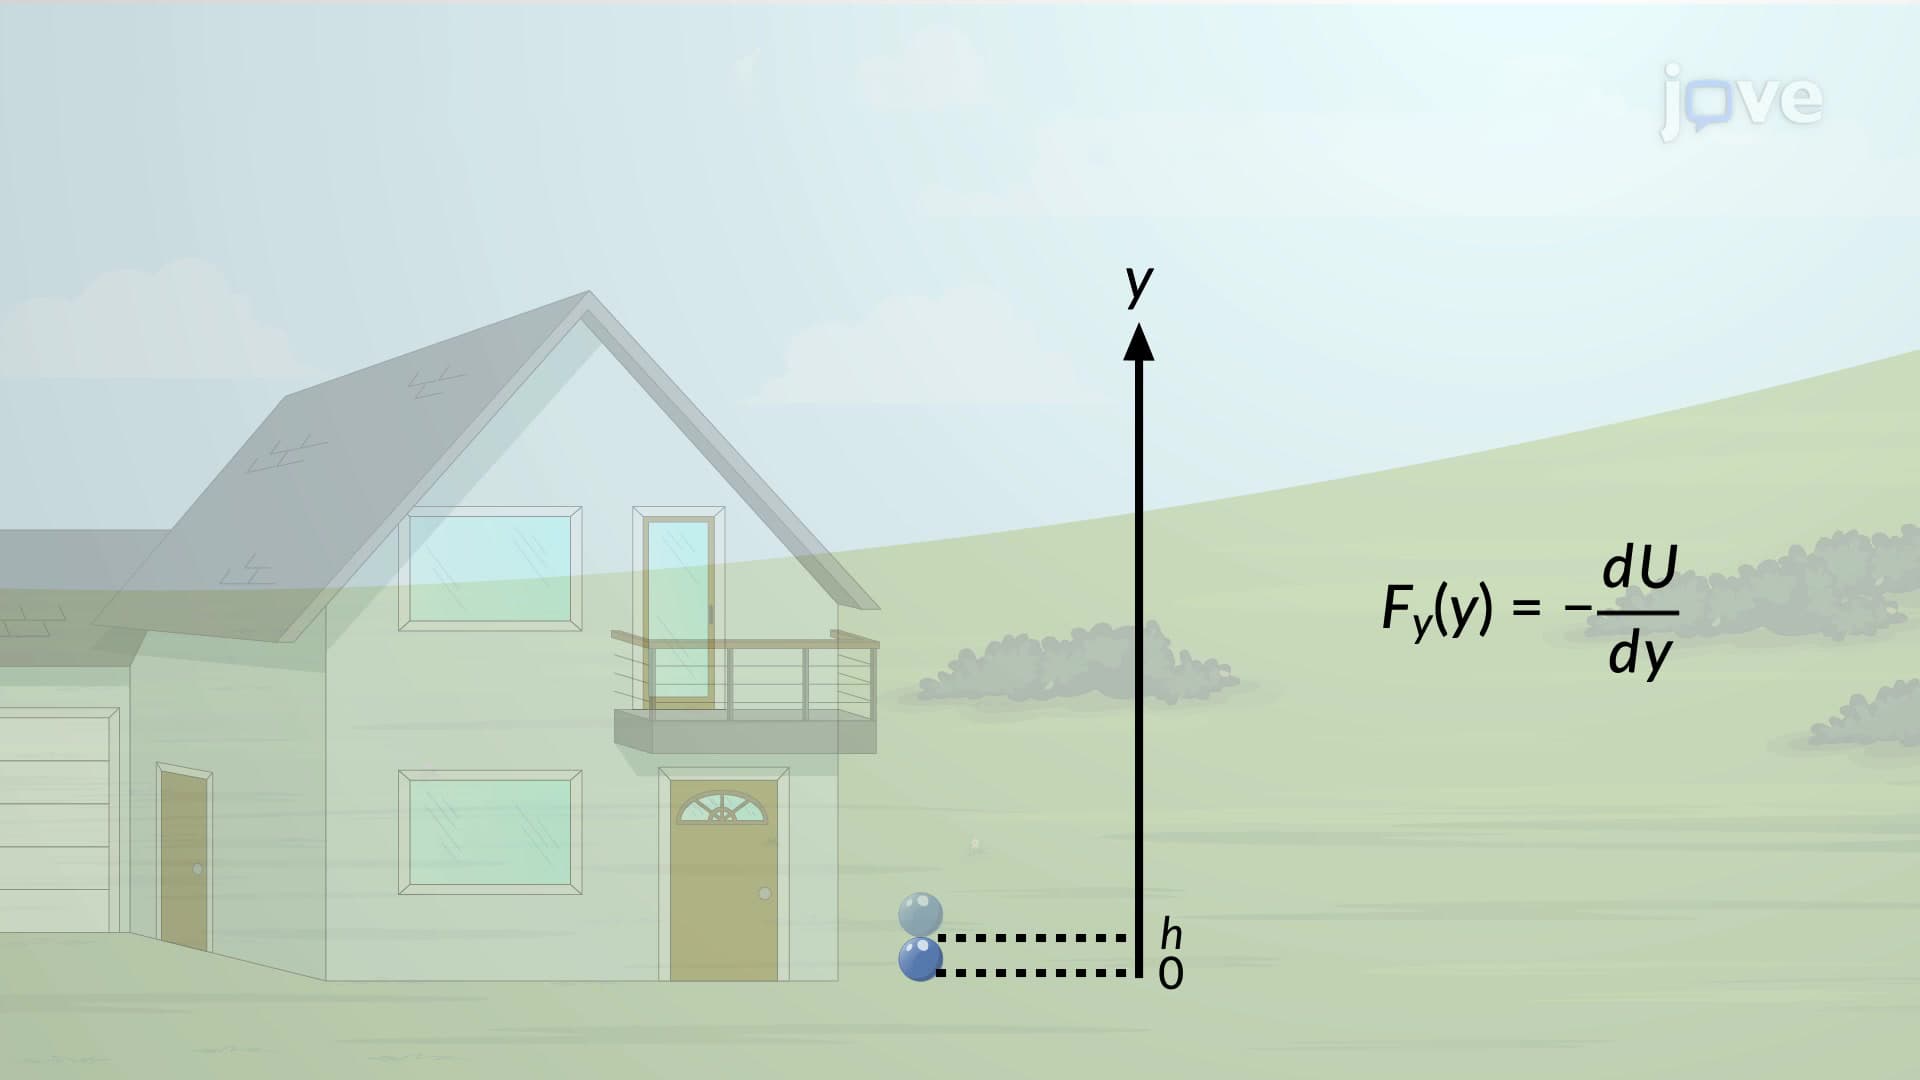
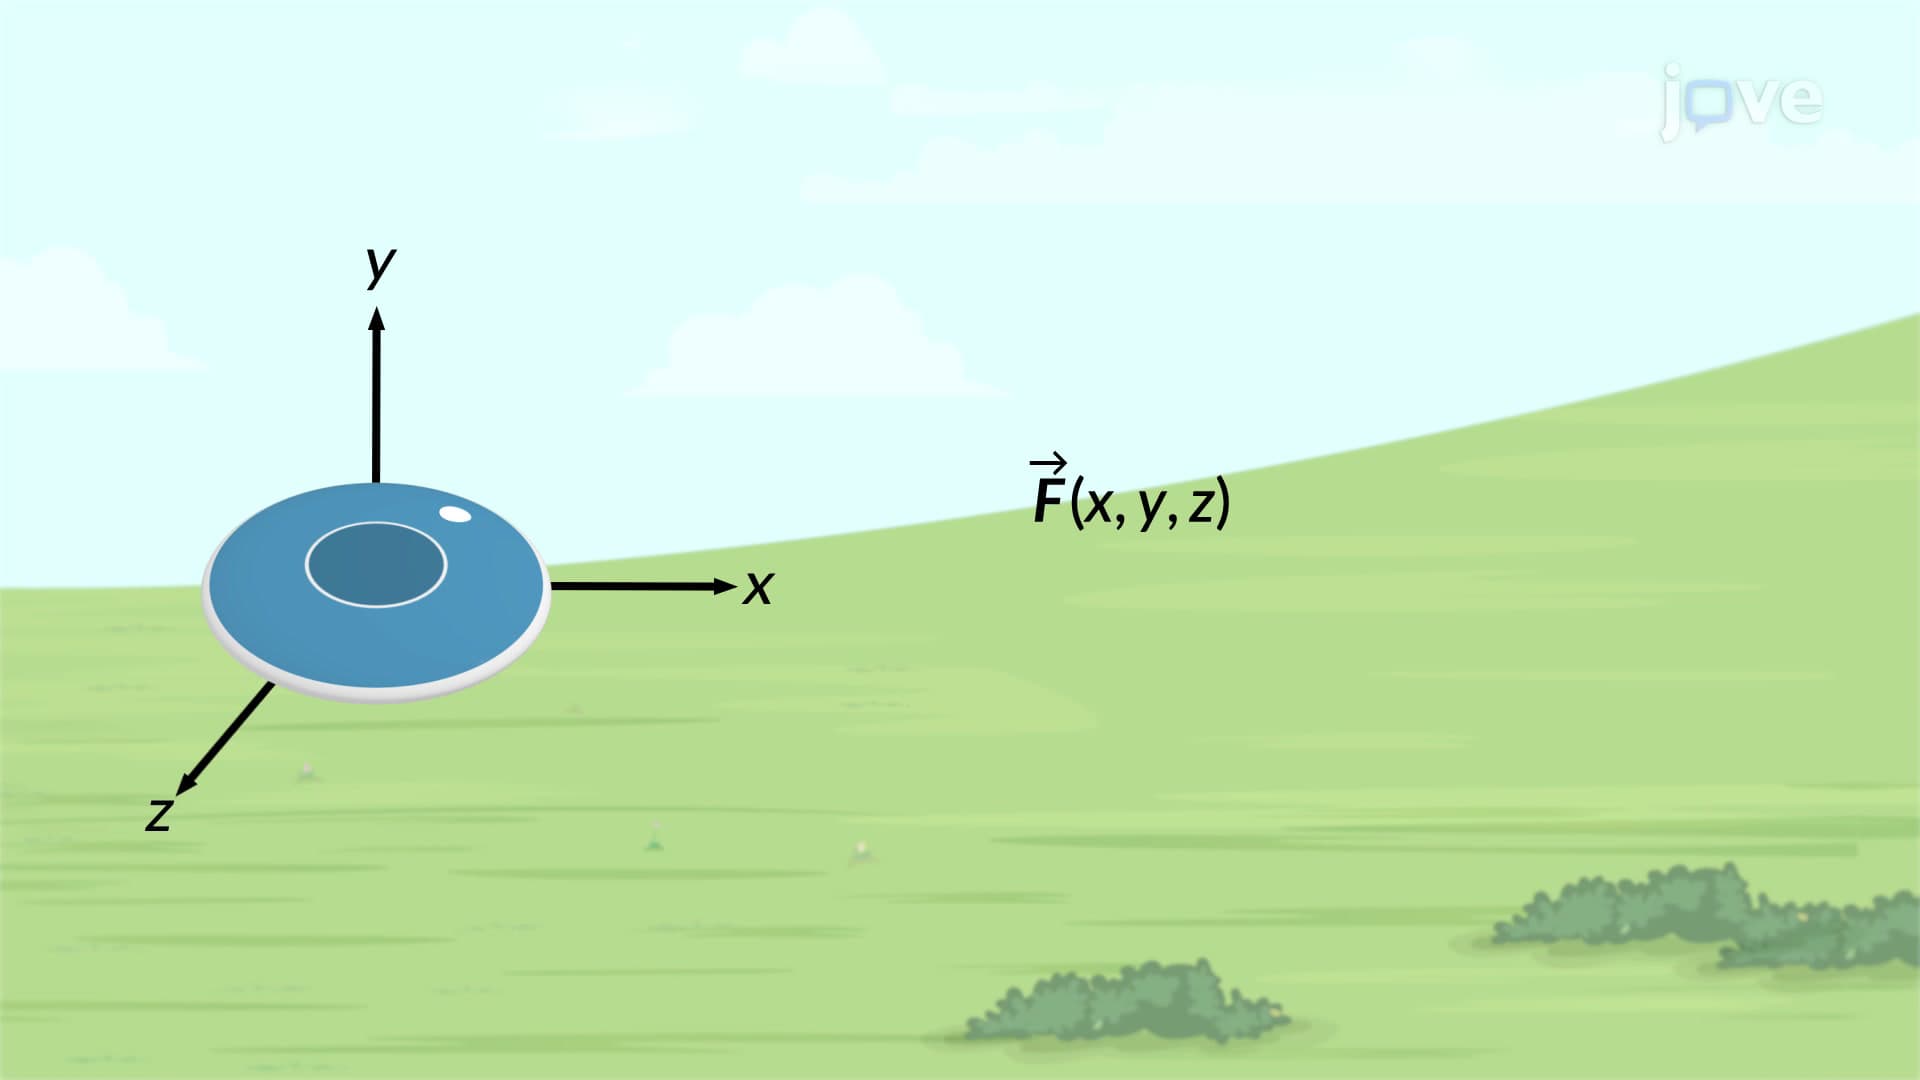
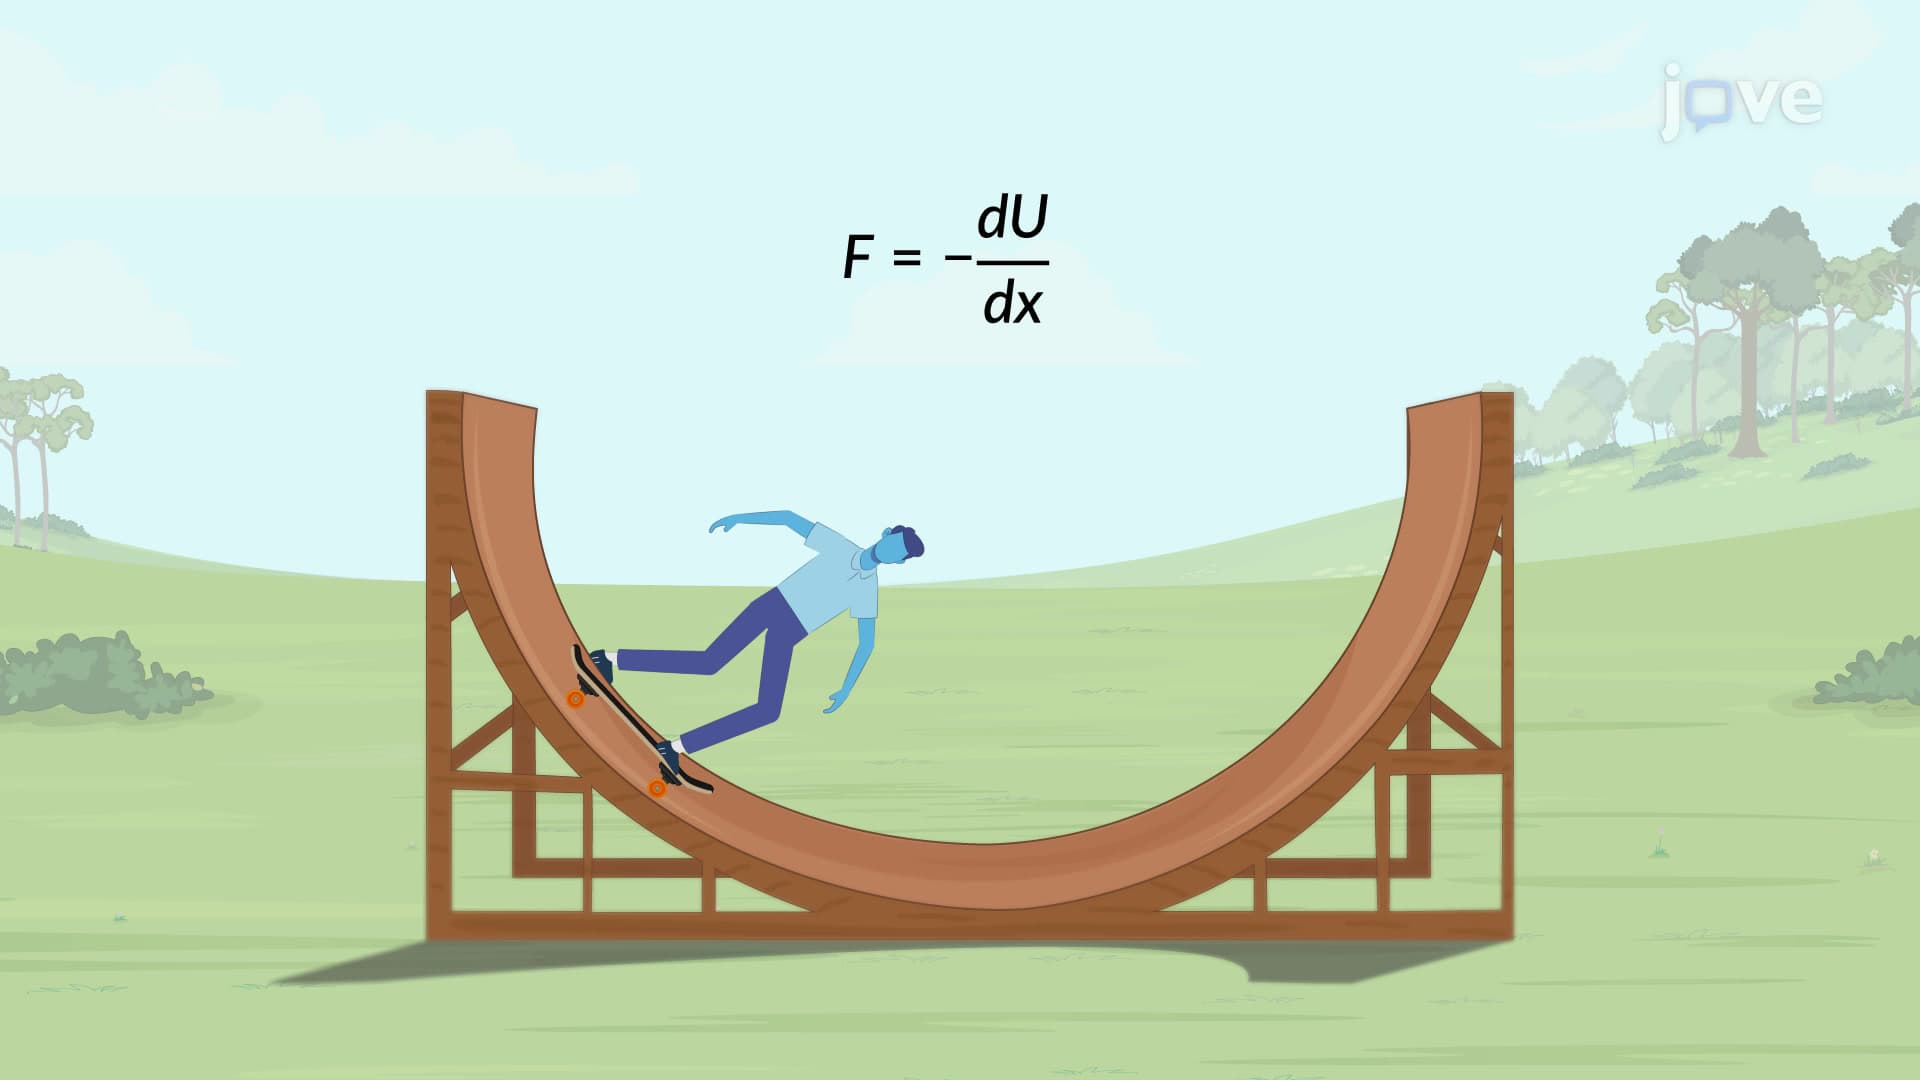
The slope of potential energy curves directly relates to conservative forces through the mathematical relationship: F = -dU/dx. Steeper slopes indicate stronger forces, while flat regions represent equilibrium positions where net force equals zero.
These principles apply extensively in American industries, from designing playground equipment that ensures child safety to optimizing energy storage systems in renewable energy facilities across states like California and Texas. Understanding energy diagrams helps engineers predict system behavior and optimize performance in countless applications.
Related Micro-courses