Loading subject page…


130,500 views

Video Summary: What Is Energy Diagrams Ii
Ever wonder why a roller coaster at Six Flags Magic Mountain can complete death-defying loops while others get stuck halfway? Energy diagrams II reveals the physics behind these thrilling rides by mapping potential energy curves and predicting motion boundaries. Just like NASA engineers calculating spacecraft trajectories, understanding what is Energy Diagrams II helps predict whether objects will remain trapped in energy wells or escape to infinity. Watch the full video on JoVE Coach to master this concept with expert-led visuals and step-by-step explanations.
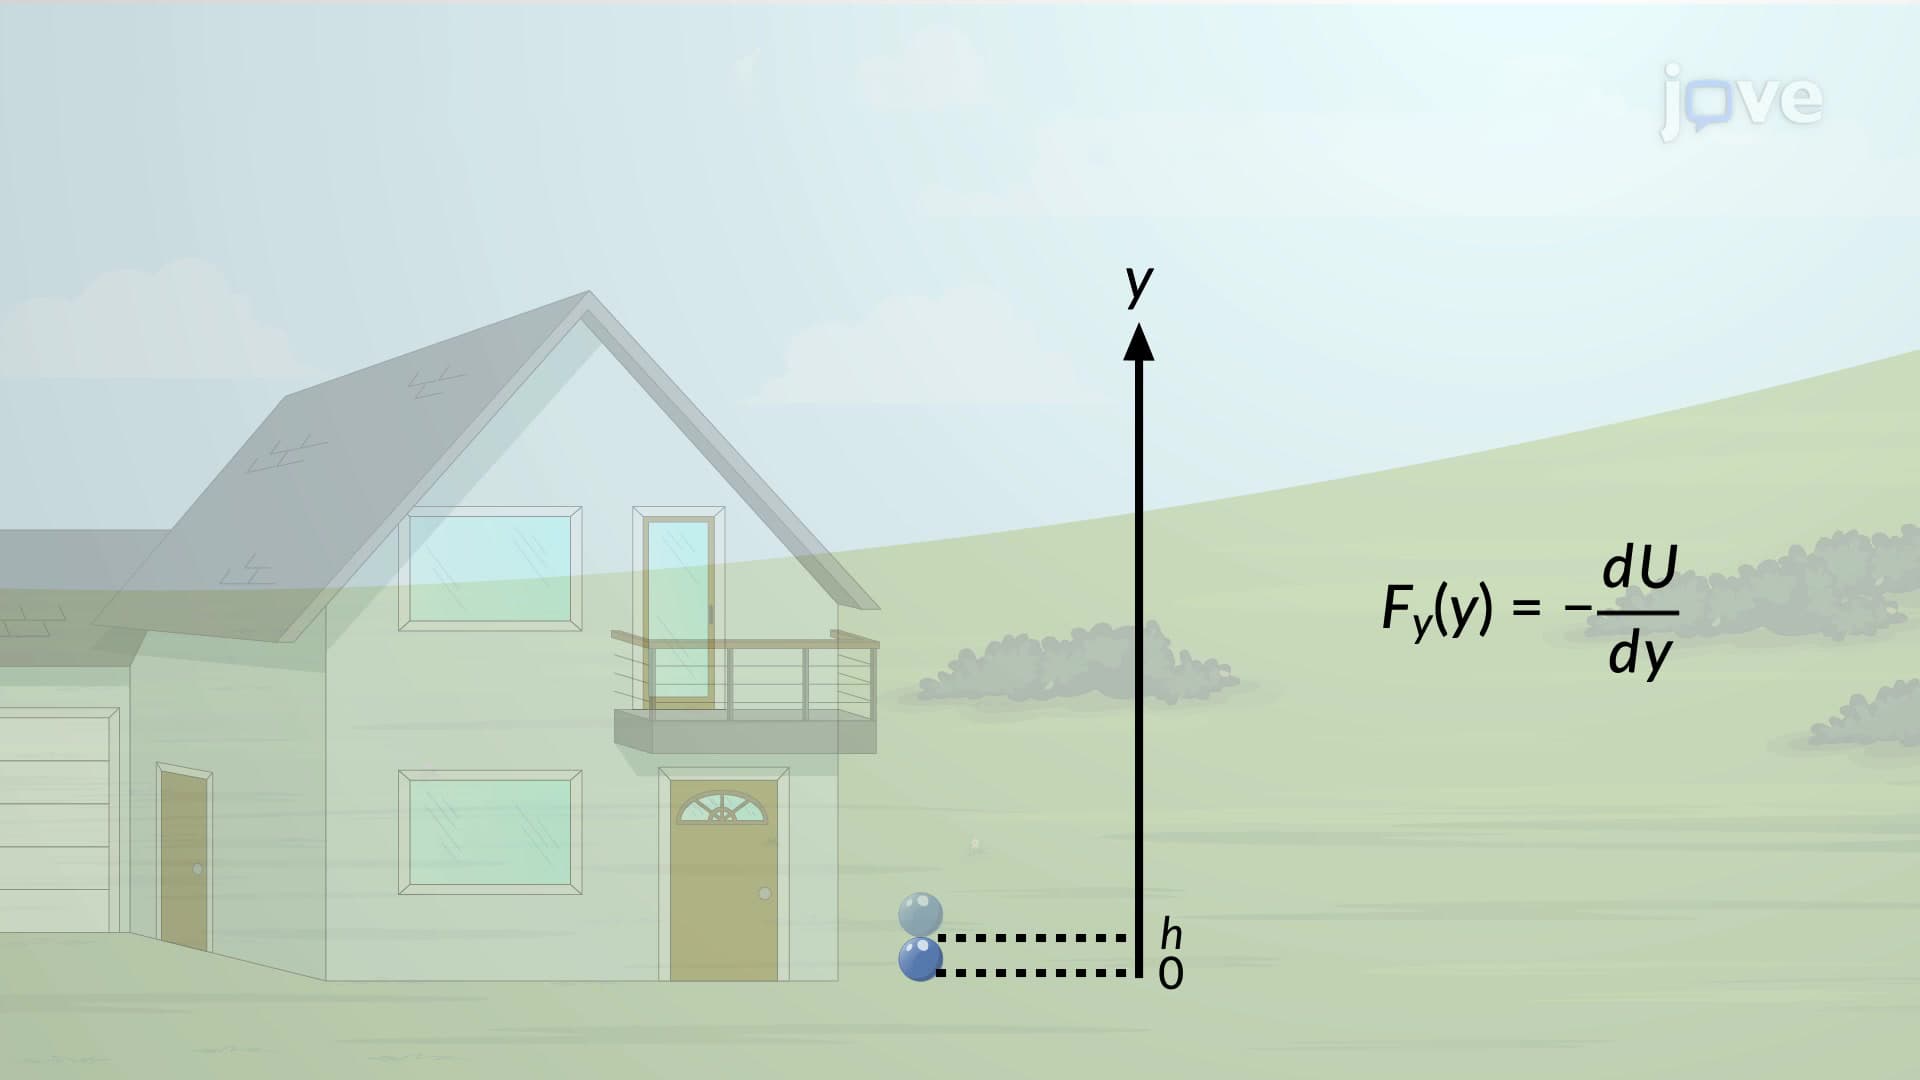
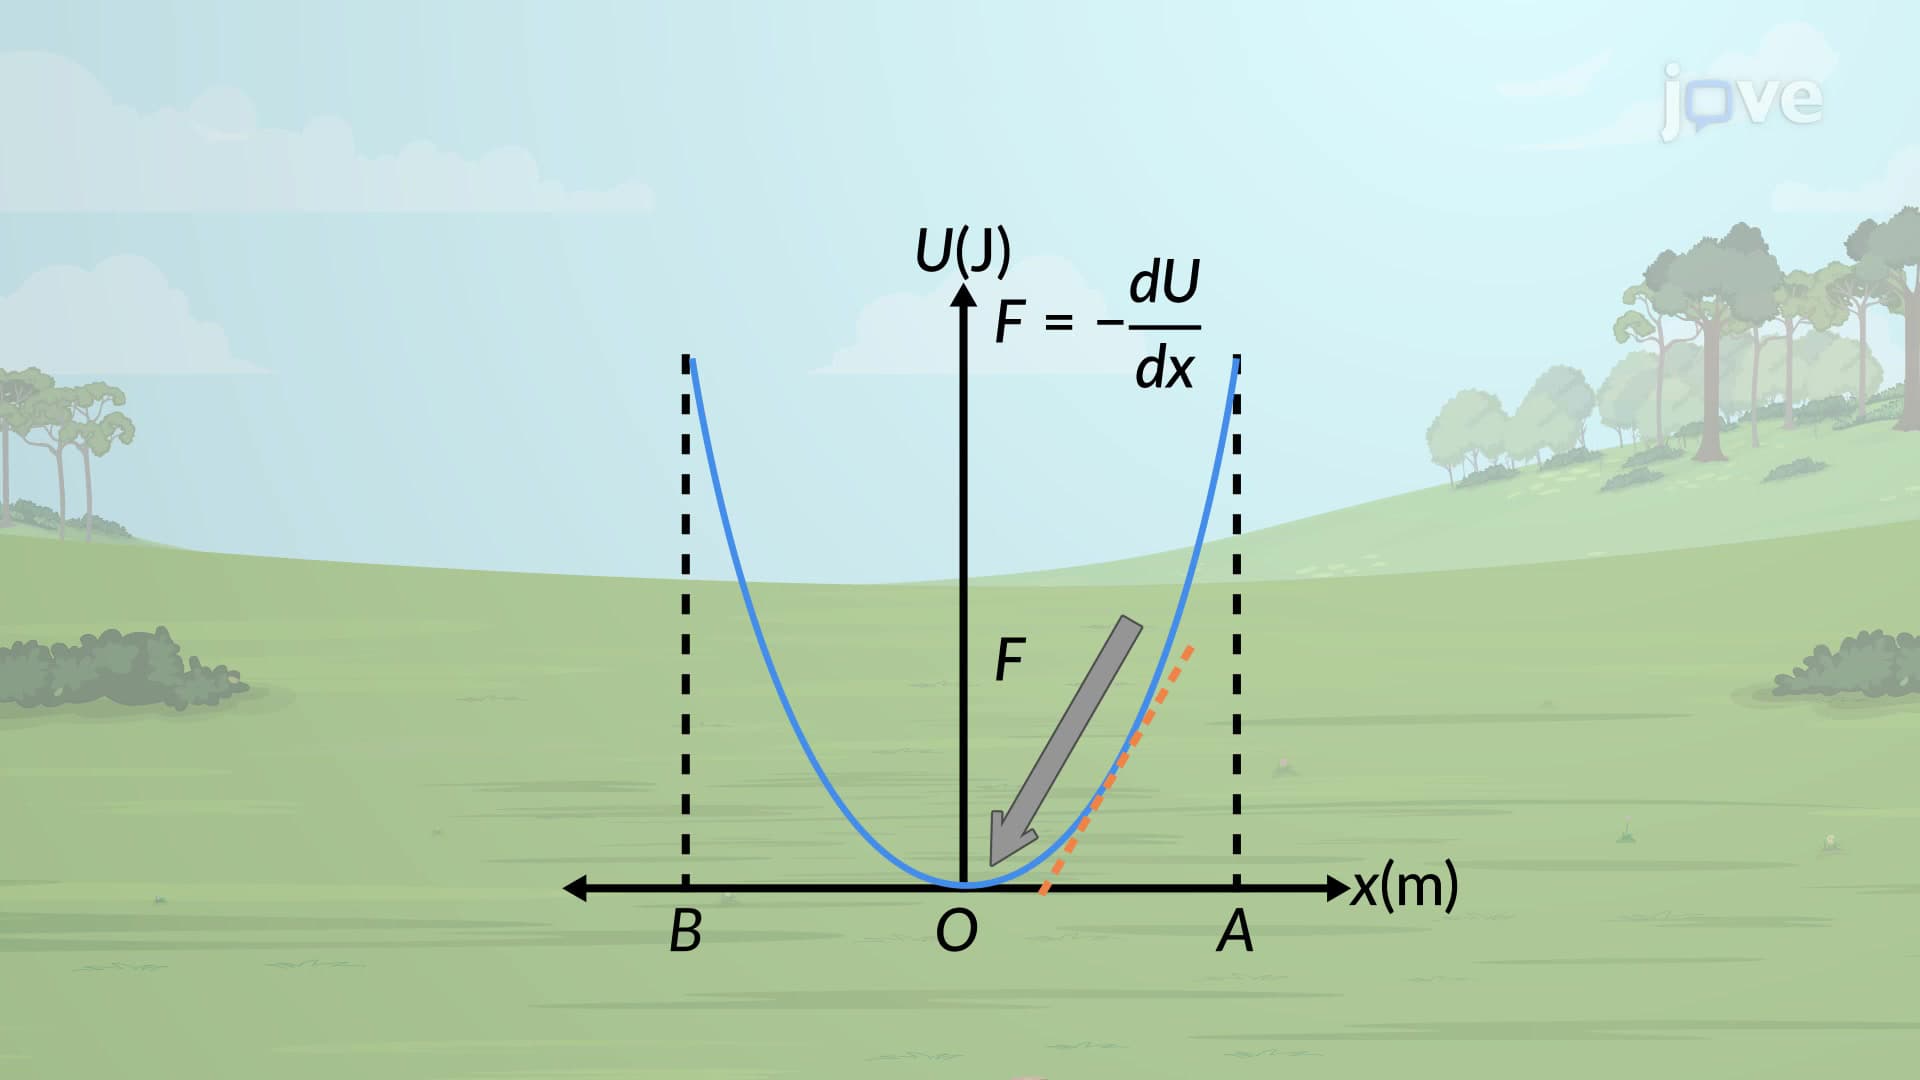
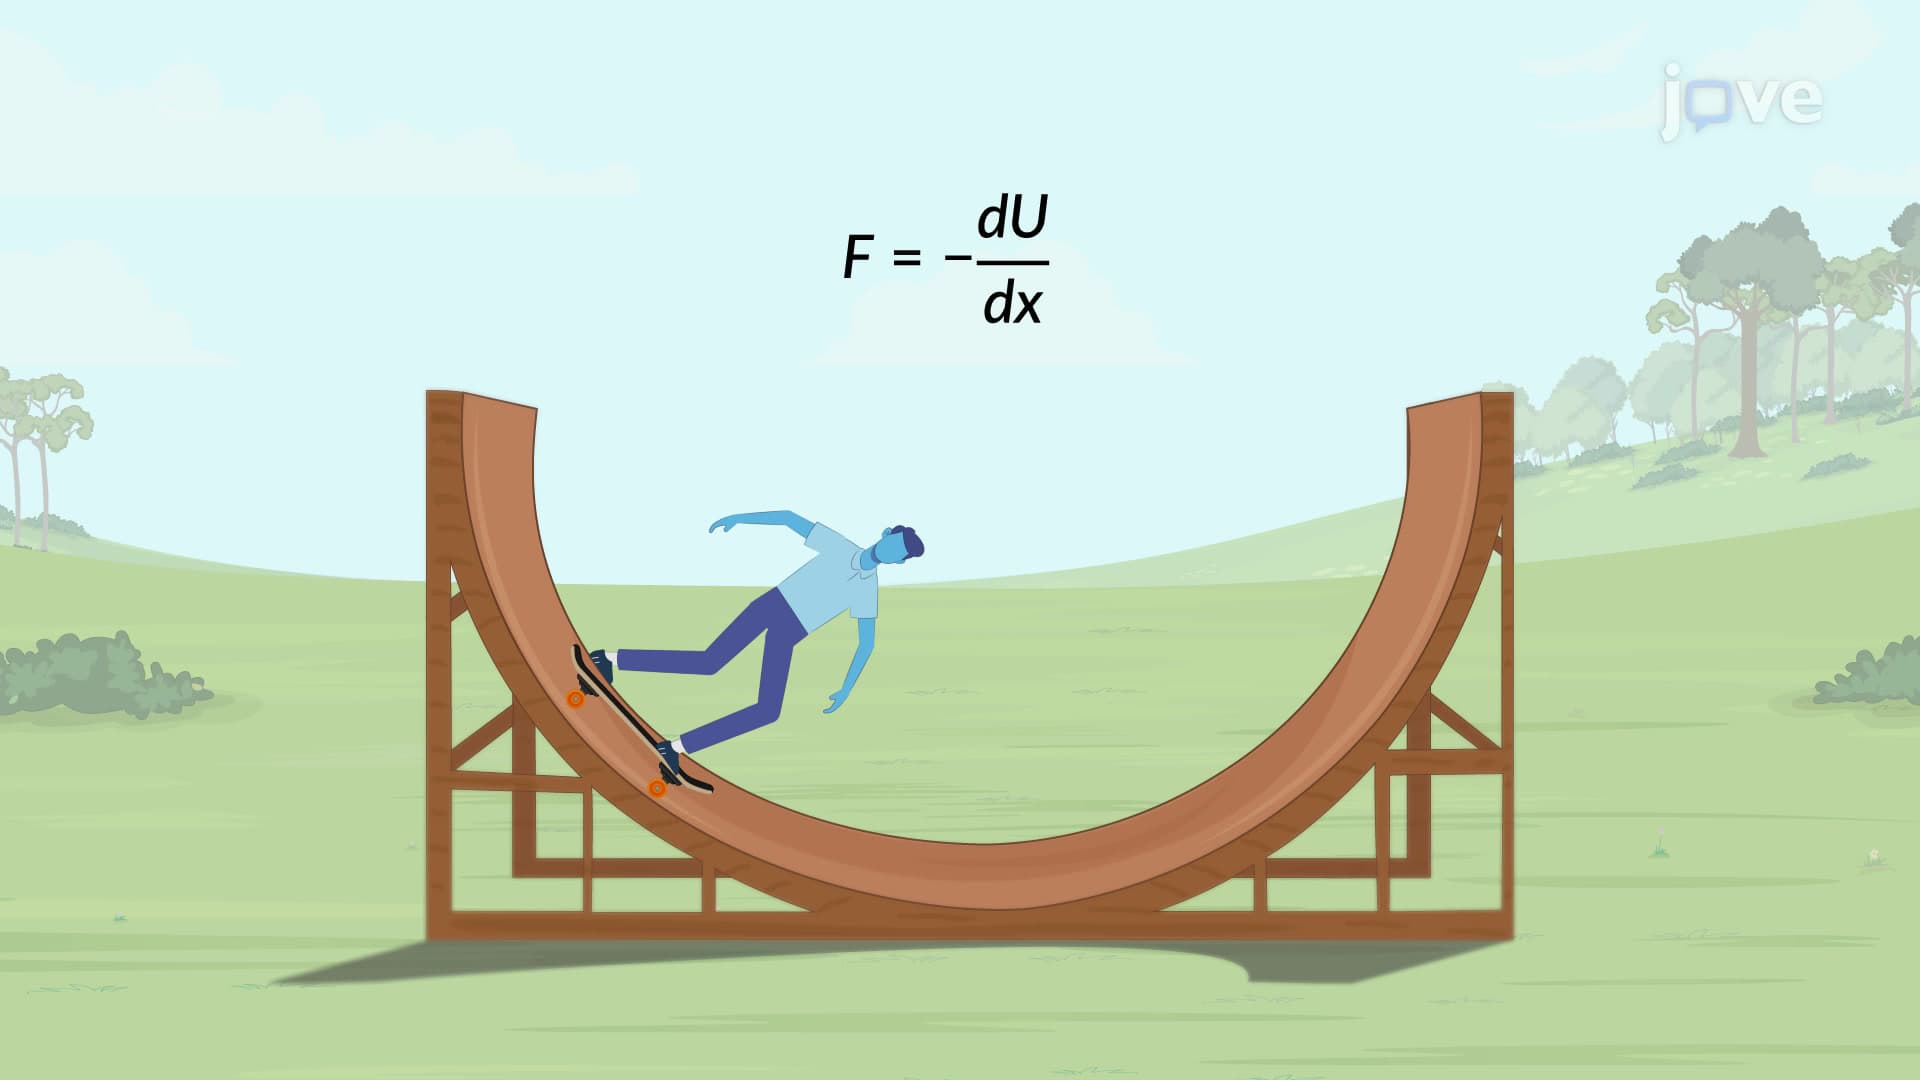
Energy Diagrams II represents an advanced analysis of potential energy curves that reveals profound insights about mechanical motion and system stability. Unlike basic energy conservation, this concept explores how the shape of potential energy functions determines force behavior, equilibrium conditions, and motion boundaries. The fundamental principle underlying energy diagrams II connects the negative slope of potential energy curves to conservative forces: F = -dU/dx.
The energy diagrams II concept distinguishes between stable and unstable equilibrium through mathematical analysis of potential energy curves. At equilibrium points, the net force equals zero, corresponding to locations where dU/dx = 0. Stable equilibrium occurs at potential energy minima-any small displacement creates restoring forces that drive the system back to equilibrium. Think of a marble resting at the bottom of a bowl. Conversely, unstable equilibrium exists at potential energy maxima, where small displacements generate forces that push the system further away, like balancing a pencil on its tip.
This stability analysis proves crucial for engineering applications. Structural engineers at companies like Boeing use these principles to ensure aircraft components remain in stable configurations during flight. Similarly, the Federal Highway Administration applies stability concepts when designing bridge supports that must withstand dynamic loads while maintaining structural integrity.
The energy diagrams II study guide emphasizes how total mechanical energy determines accessible motion regions. When total energy E₁ is less than the potential energy at certain positions, those regions become classically forbidden-the particle cannot reach them. This creates "potential wells" where objects remain trapped between turning points. However, when total energy E₂ exceeds all potential barriers, the particle can escape to infinity, exhibiting unbound motion.
These concepts directly appear on standardized exams. AP Physics C frequently tests students' ability to identify turning points and predict oscillatory motion from energy diagrams. The MCAT physics section includes similar problems involving molecular potential energy curves and binding energies. College physics courses at institutions like MIT and Stanford dedicate entire units to analyzing complex potential functions using these energy diagram techniques.
Understanding energy diagrams II in detail enables prediction of diverse physical phenomena. Satellite orbital mechanics relies on gravitational potential energy analysis to determine escape velocities and stable orbit conditions. Chemical engineers use intermolecular potential curves to predict phase transitions and molecular behavior in industrial processes. Even financial modeling employs similar mathematical frameworks to analyze market stability and predict economic equilibrium points.
Related Micro-courses