Loading…
Loading video…

5,966 views
Ever wondered why medical researchers can predict patient survival rates with mathematical precision? The hazard rate serves as a critical statistical measure that quantifies the probability of an event—like death or disease recurrence—occurring within a specific time interval for individuals who have survived up to that point. For instance, FDA clinical trials for cancer drugs rely heavily on hazard rate calculations to determine treatment effectiveness. Understanding what is hazard rate enables researchers to make data-driven decisions about patient care and treatment protocols. Watch the full video on JoVE Coach to master this concept with expert-led visuals and step-by-step explanations.
The hazard rate definition centers on measuring instantaneous risk—specifically, the probability that an event will occur in the next small time interval, given that an individual has survived up to the current time. Unlike simple mortality rates, hazard rates provide dynamic insights into how risk changes over time, making them invaluable for medical professionals and researchers.
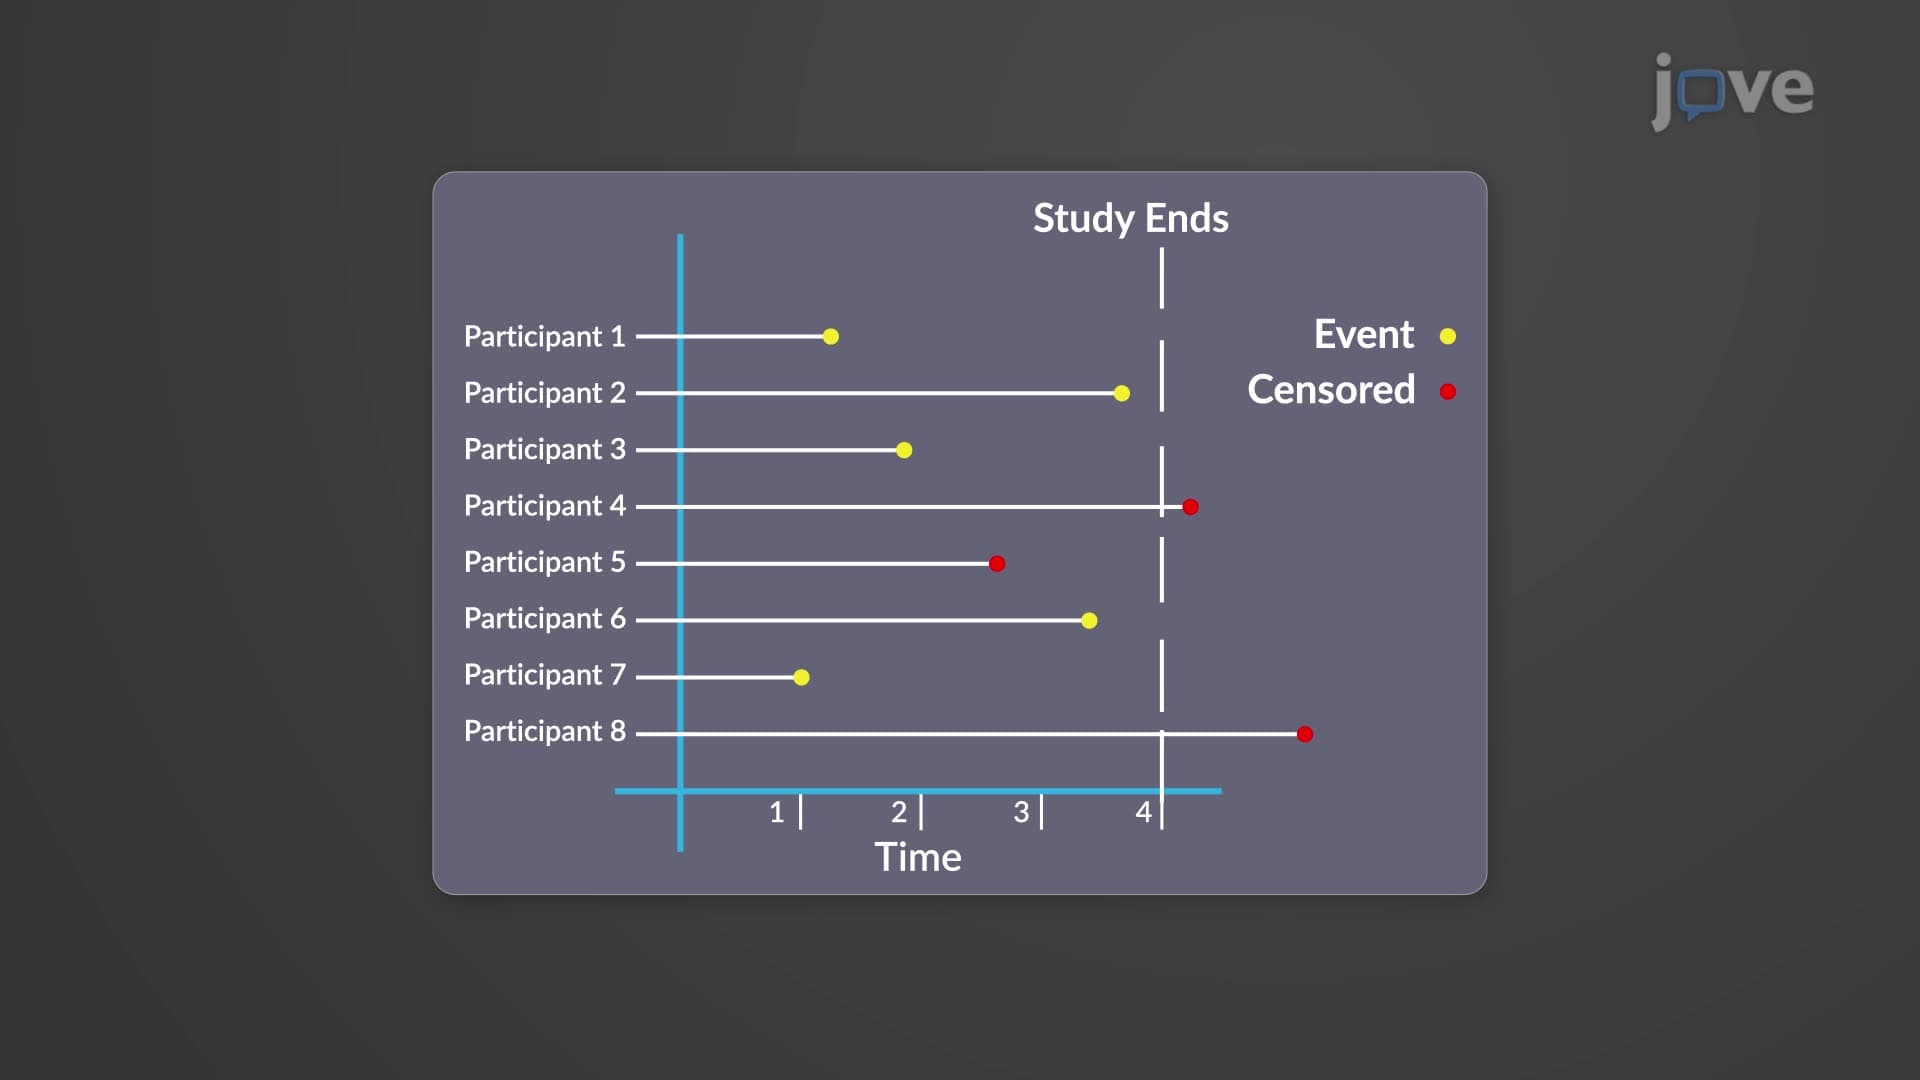
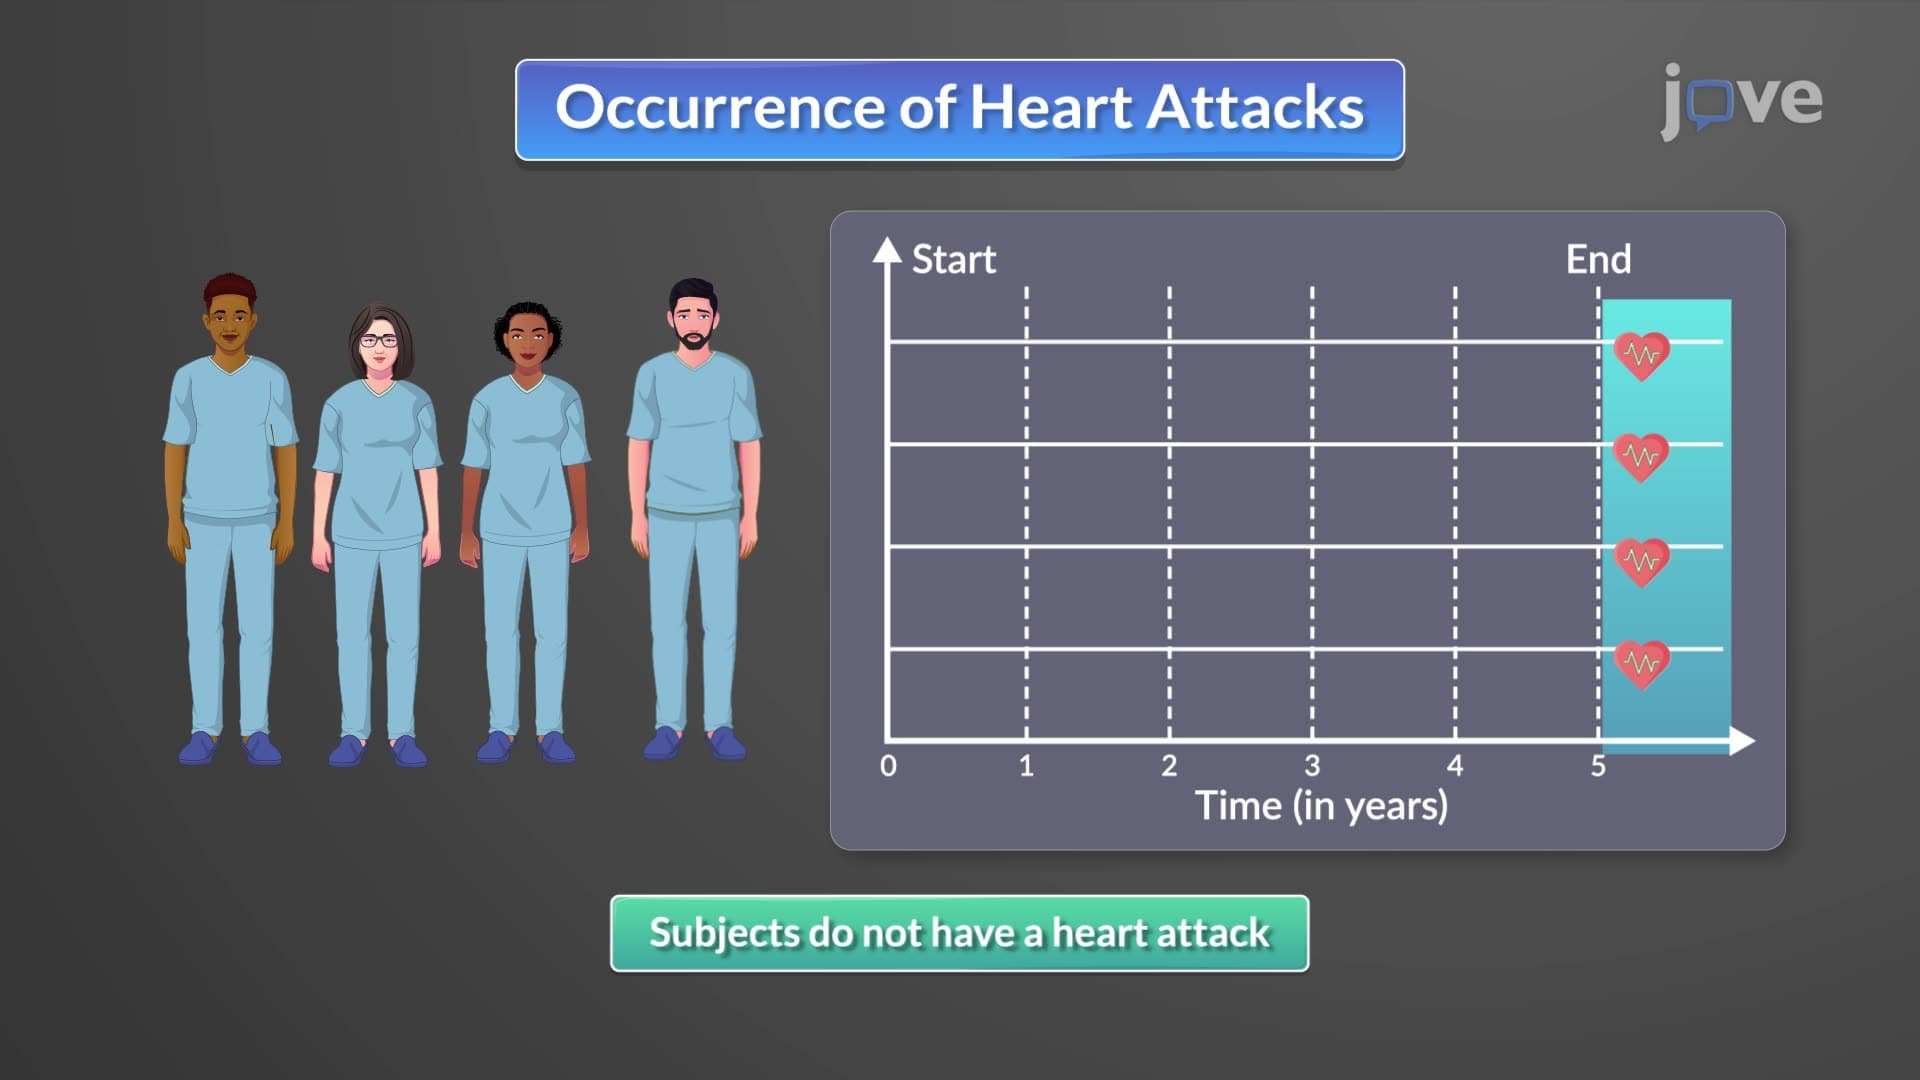
When examining what is hazard rate in detail, we must consider its mathematical structure. The calculation involves tracking participants from their entry point (B_i) through either their event occurrence (D_i) or censoring time (C_i). The time each individual remains "at risk" forms the denominator, while observed events comprise the numerator. This approach ensures accurate risk assessment even when participants enter studies at different times or leave before completion.
The Poisson distribution approximation becomes crucial when dealing with rare events across large populations. This statistical property allows researchers to model complex survival scenarios with confidence intervals and predictive power essential for clinical decision-making.
Major US medical institutions utilize hazard rate concepts extensively. The Mayo Clinic employs hazard rate analysis in cardiovascular studies, while Johns Hopkins uses these calculations for cancer prognosis models. FDA drug approval processes require comprehensive hazard rate documentation, particularly for Phase III clinical trials comparing new treatments against established standards.
For students preparing for advanced coursework, understanding hazard rate basics proves essential for AP Statistics, pre-med requirements, and undergraduate biostatistics courses. Medical school applicants encounter hazard rate questions on the MCAT, particularly in biological and biochemical foundations sections. Nursing students studying for NCLEX examinations must grasp these concepts for evidence-based practice questions.
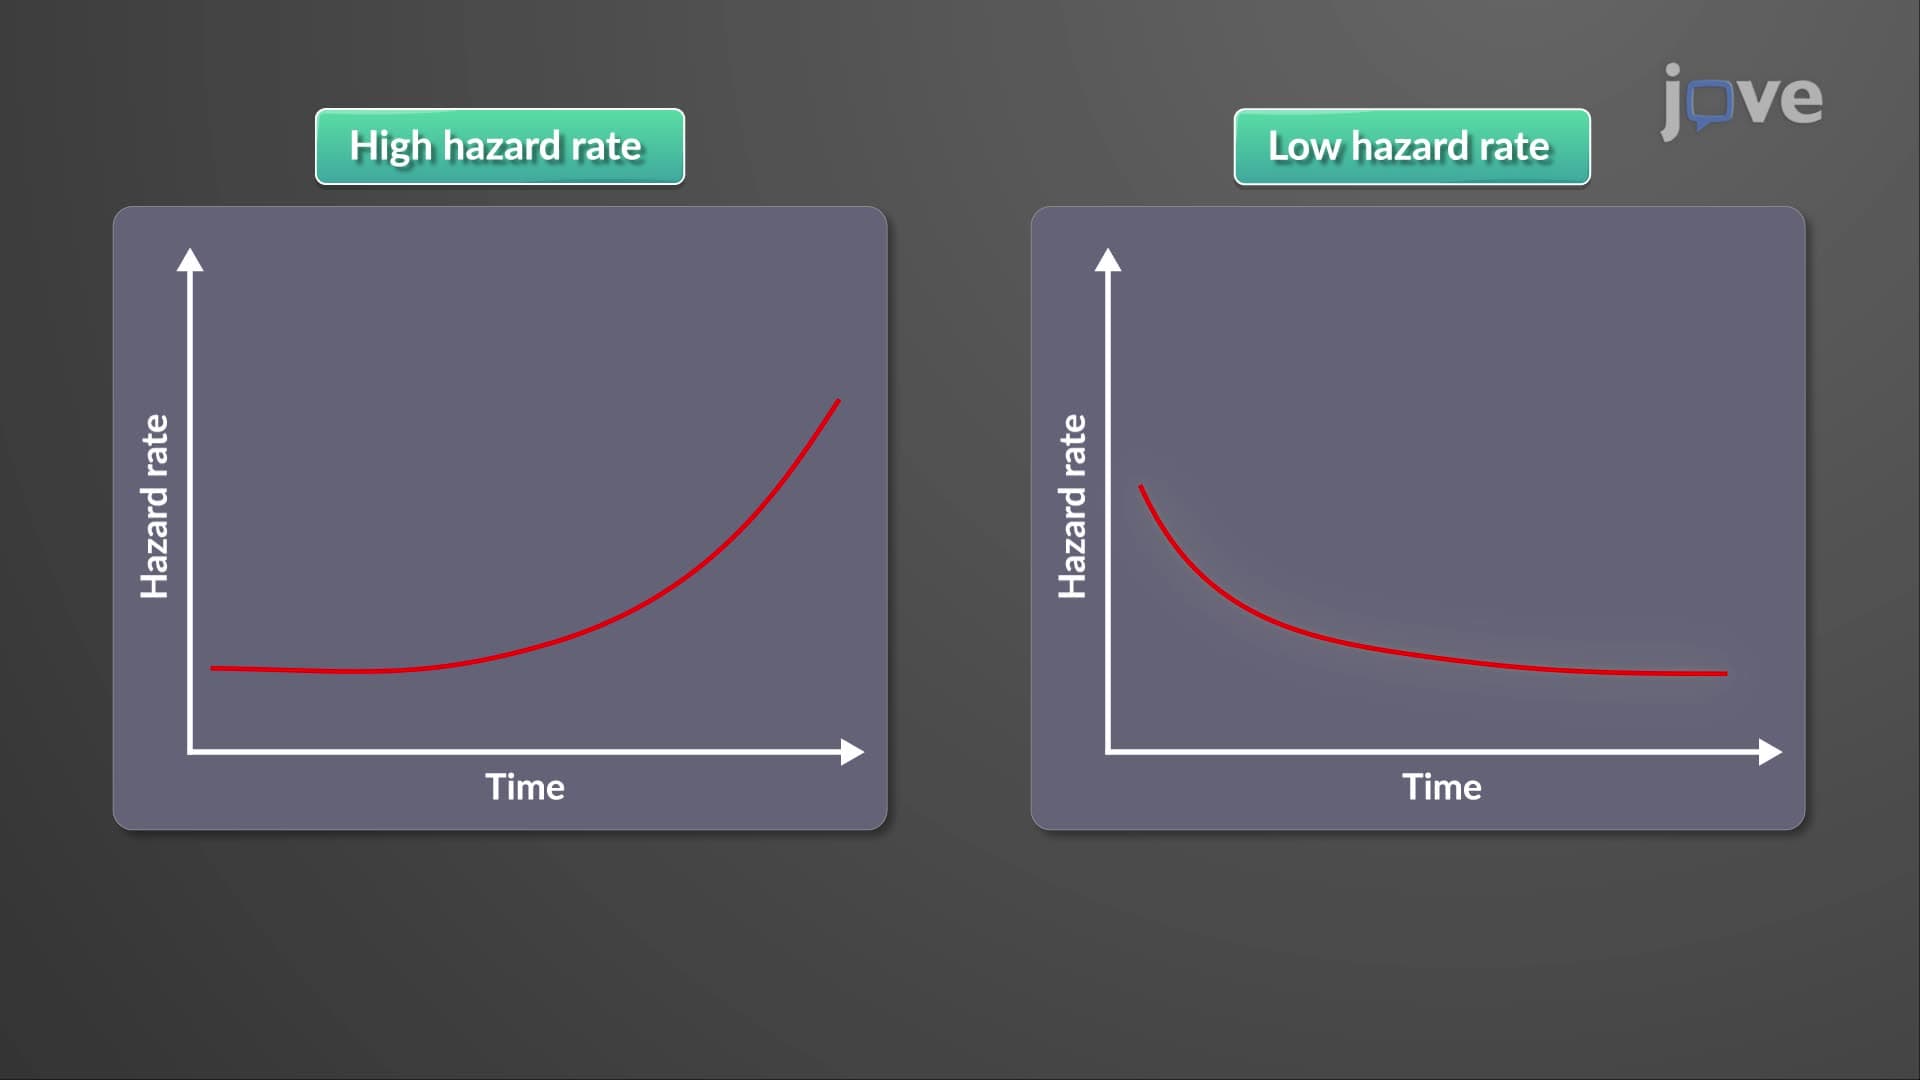
Hazard rate study guides typically emphasize practical interpretation over complex mathematical derivations. Students should focus on understanding when hazard rates increase (indicating higher risk over time) versus decrease (suggesting improved survival chances), as these patterns directly influence clinical protocols and patient counseling approaches in US healthcare settings.
Frequently Asked Questions
Hazard rate measures instantaneous risk of death at a specific time point, given survival up to that moment. Unlike crude mortality rates that simply divide deaths by population, hazard rates account for timing and provide dynamic risk assessment. This makes hazard rates particularly valuable for clinical trials where participants enter at different times and may leave before study completion.
For standardized exams, hazard rate is defined as the probability of an event occurring in the next time interval, conditional on survival to the current time. MCAT questions often focus on interpreting hazard rate graphs and understanding their clinical implications. AP Statistics emphasizes the mathematical relationship between hazard rates and survival functions in data analysis contexts.
USMLE questions present clinical scenarios where students must interpret survival curves and hazard rate changes over treatment periods. Common formats include comparing hazard rates between treatment groups or explaining why hazard rates might increase after initial treatment success. The emphasis lies on clinical interpretation rather than mathematical calculation.
Emergency departments use hazard rate models to predict patient deterioration risks, while oncology centers apply them for treatment planning and prognosis discussions. Insurance companies utilize hazard rate data for coverage decisions, and pharmaceutical companies rely on these calculations for drug development and FDA submissions.
Not at all—hazard rate concepts build naturally from basic probability and statistics covered in Algebra 2 and AP Statistics. The key is focusing on interpretation rather than complex mathematical derivations. Most high school students can grasp the practical meaning and applications with proper guidance and real-world examples.
Focus on understanding the conceptual framework first, then practice interpreting survival curves and hazard rate plots. Create flashcards linking hazard rate changes to clinical scenarios, and work through practice problems involving time-to-event data. Many students find success by connecting hazard rates to familiar concepts like insurance risk assessment.
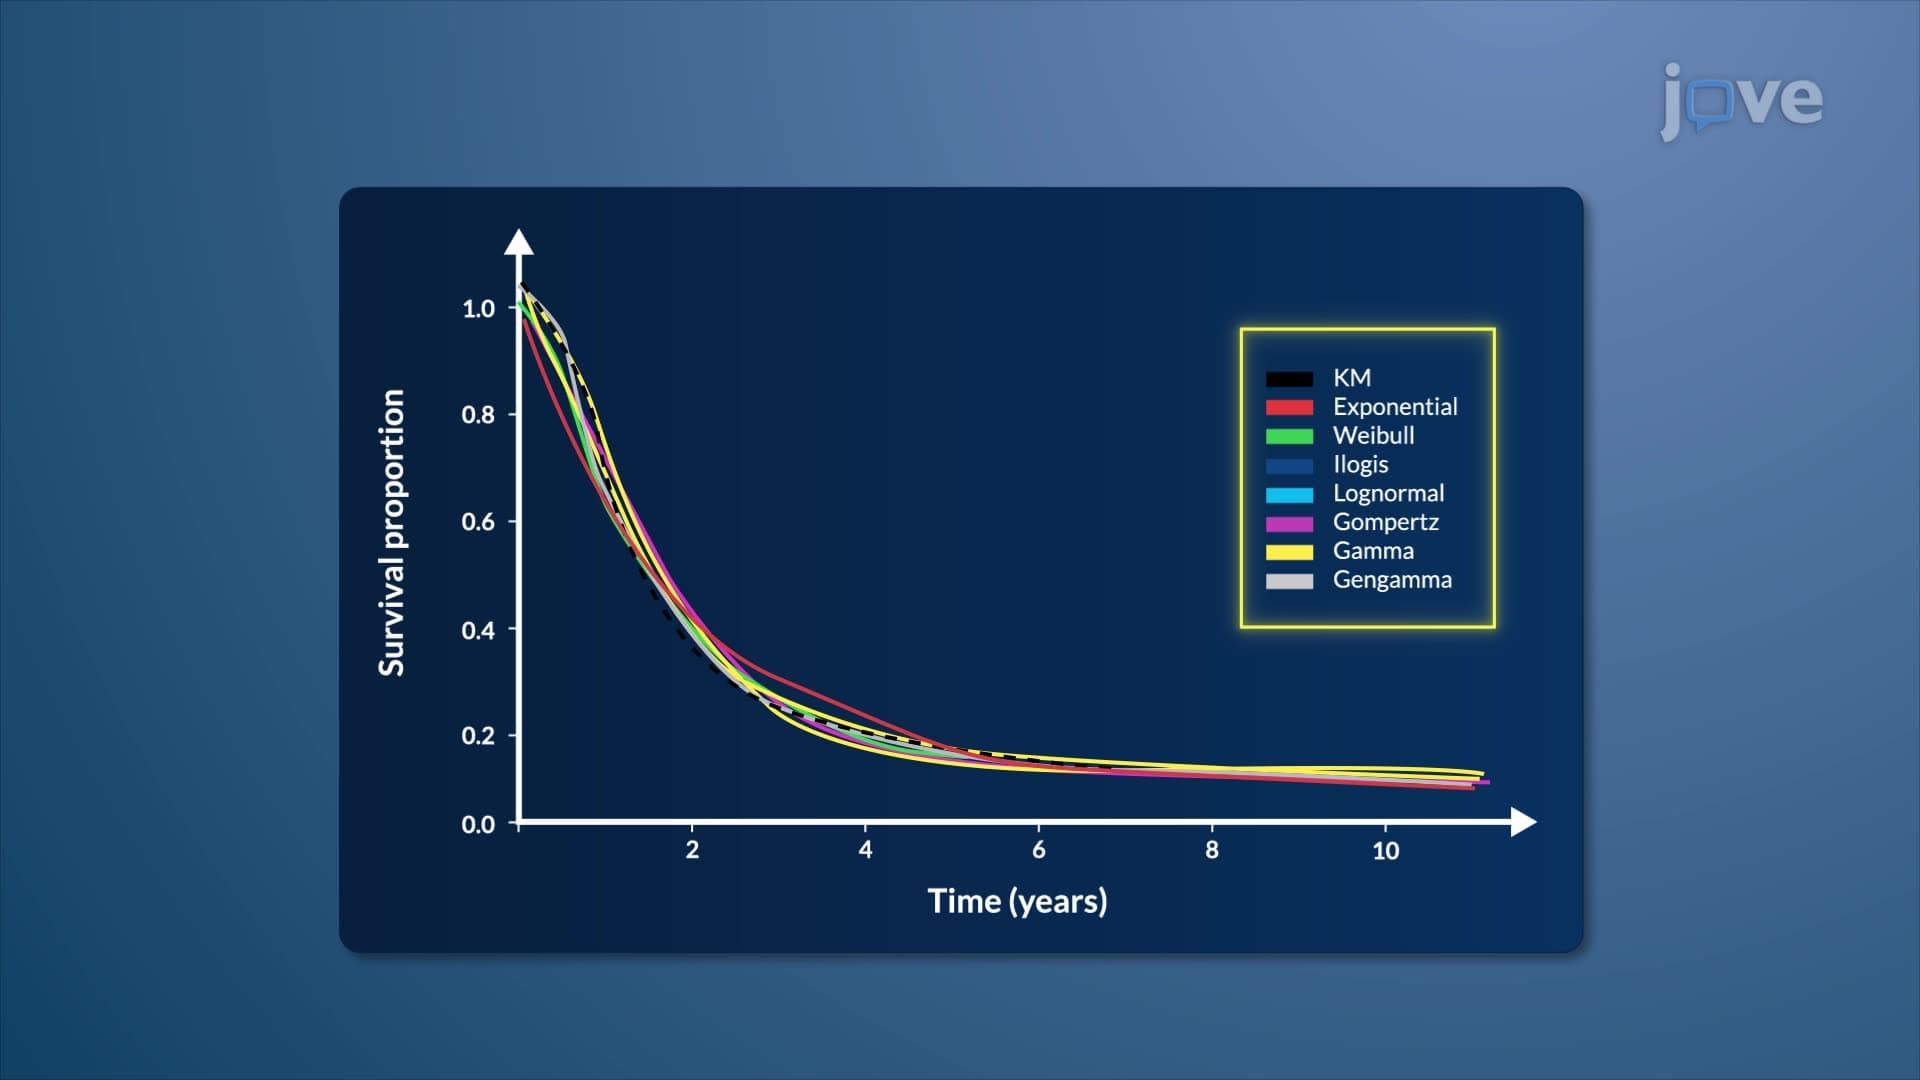
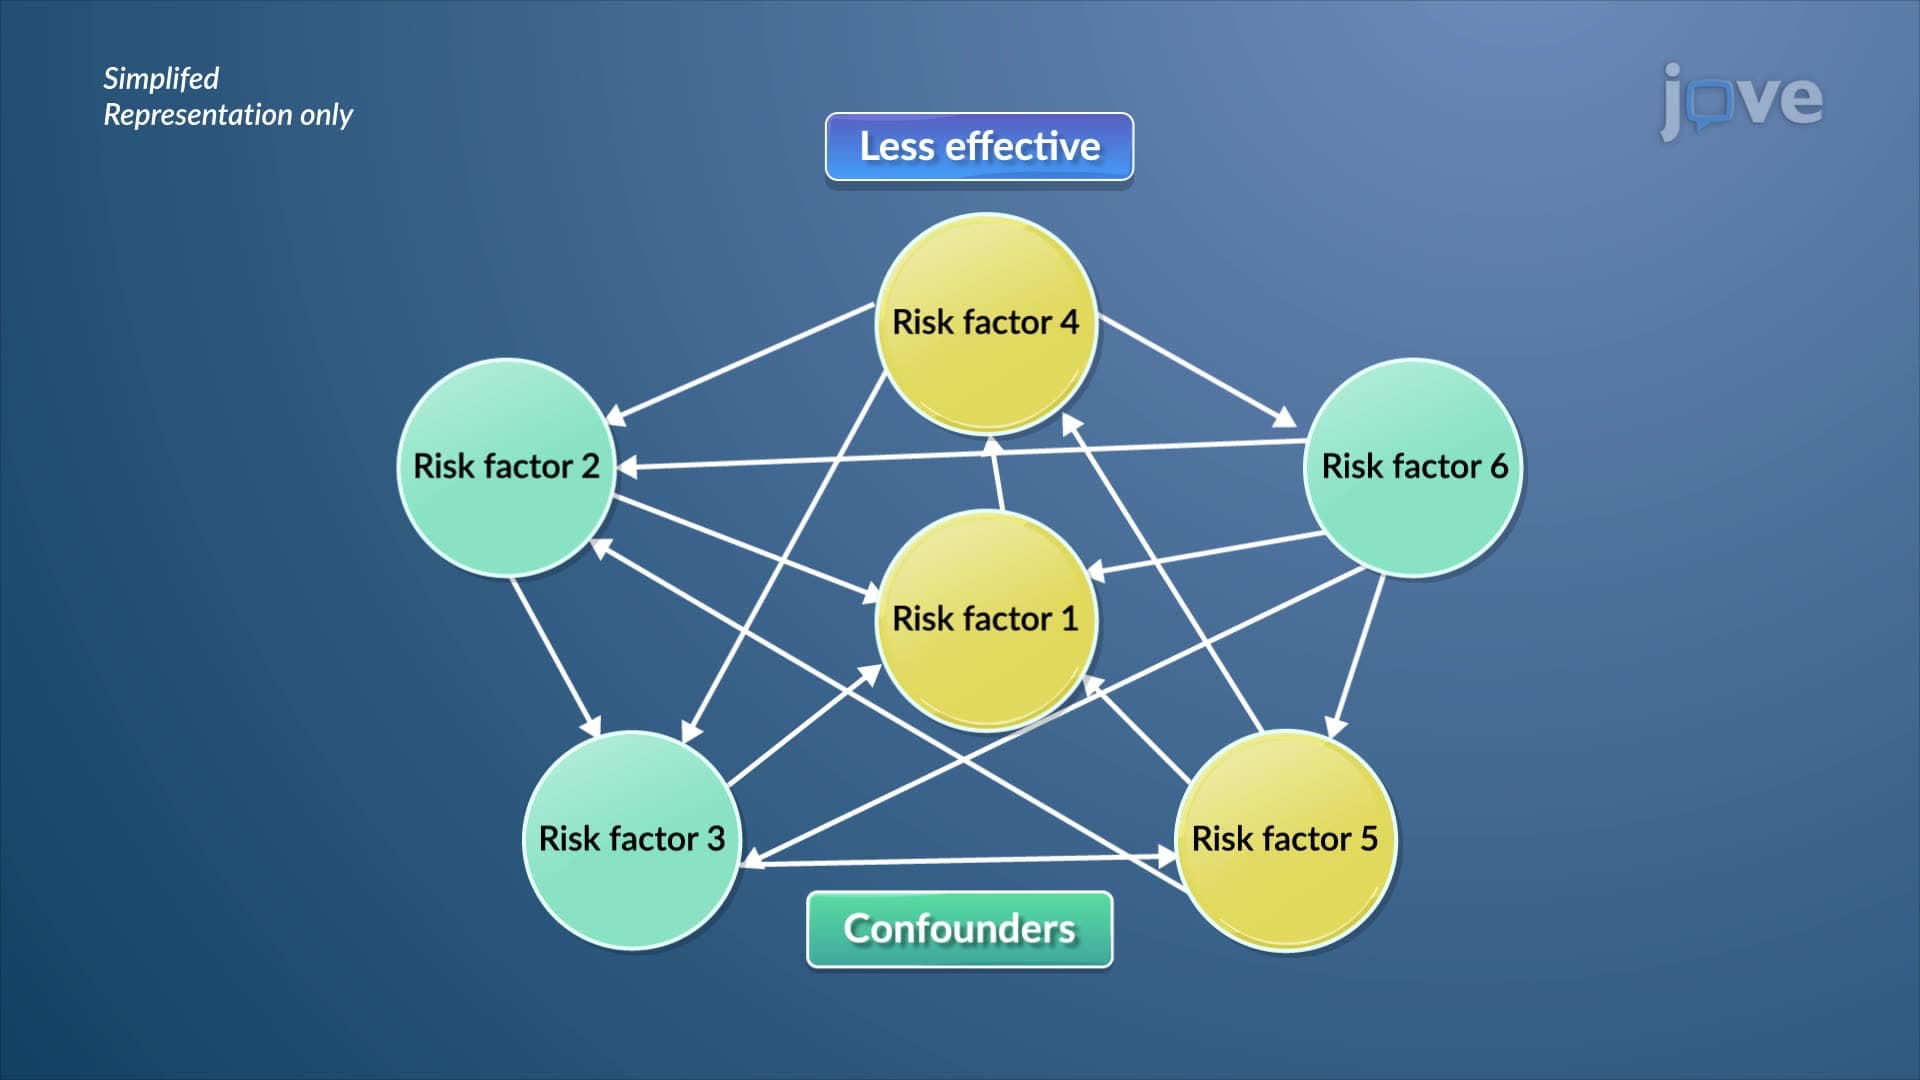
Progress to Cox proportional hazards models, which extend basic hazard rate concepts to include multiple risk factors simultaneously. Kaplan-Meier survival curves provide excellent complementary knowledge, as they visually represent the data that hazard rates help analyze mathematically.
Related Micro-courses
Related Subjects
 Physics 33 micro-courses›
 Math Fundamentals 11 micro-courses›