Loading subject page…

- Statistics
- Survival Analysis
- Survival Curves
Micro-course: Survival Analysis
5,966 views
Learn key concepts and earn your certificate.












Survival Curves

00:00
01:18
Video Summary: What are Survival Curves
Ever wondered why life insurance premiums increase with age, or how the CDC tracks COVID-19 mortality rates across different age groups? Survival curves provide the mathematical foundation for these critical analyses by plotting the percentage of a population that remains alive over time. For instance, when epidemiologists at the Centers for Disease Control and Prevention study breast cancer survival rates among American women, they rely on survival curves to inform treatment protocols and public health policies. Watch the full video on JoVE Coach to master this concept with expert-led visuals and step-by-step explanations.
- Understand what are survival curves and how they differ from cumulative death probability functions
- Identify the mathematical relationship between survival functions S(t) and cumulative distribution functions F(t)
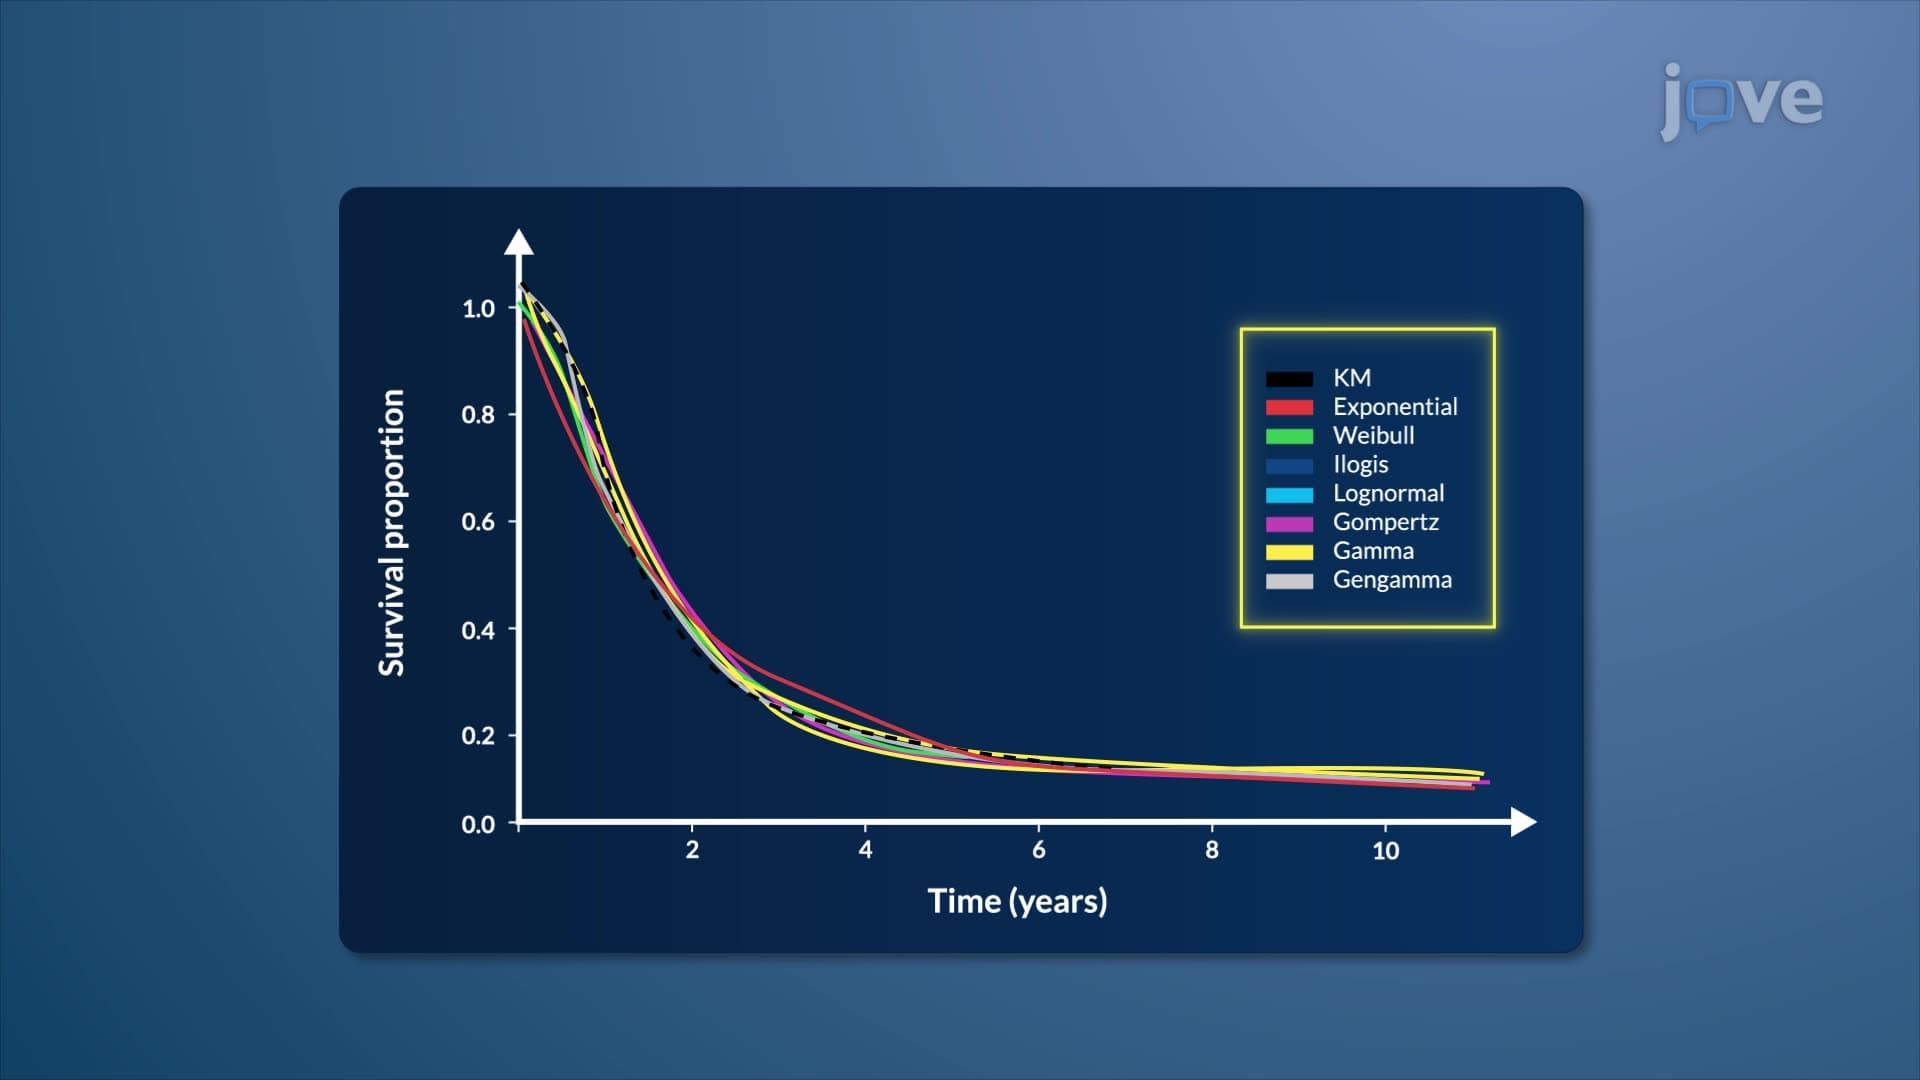
- Analyze the key components of survival curve graphs, including time variables and survival proportions
- Compare exponential, Weibull, log-normal, and log-logistic survival models and their appropriate applications
- Evaluate when to use different types of survival curves based on hazard rate characteristics
- Apply survival curve concepts to interpret real-world medical and epidemiological data
- Recognize the limitations of survival analysis when complete population data is unavailable
- Explore how survival curves inform clinical decision-making and public health policy development
Understanding What Are Survival Curves: Foundation and Purpose
Survival curves represent one of the most powerful tools in biostatistics and epidemiology for analyzing time-to-event data. Unlike simple mortality statistics, survival curves provide a dynamic view of how populations change over time, making them invaluable for medical research, insurance actuarial science, and public health planning.
The fundamental concept begins with the survival function S(t), which represents the probability that an individual survives beyond time t. Mathematically, this relates to the cumulative distribution function F(t) through the equation S(t) = 1 - F(t), where F(t) represents the proportion of the population that has experienced the event (typically death) by time t. This relationship ensures that survival curves always start at 100% (when t = 0) and decrease over time as events occur.
Types of Survival Curves and Their Mathematical Models
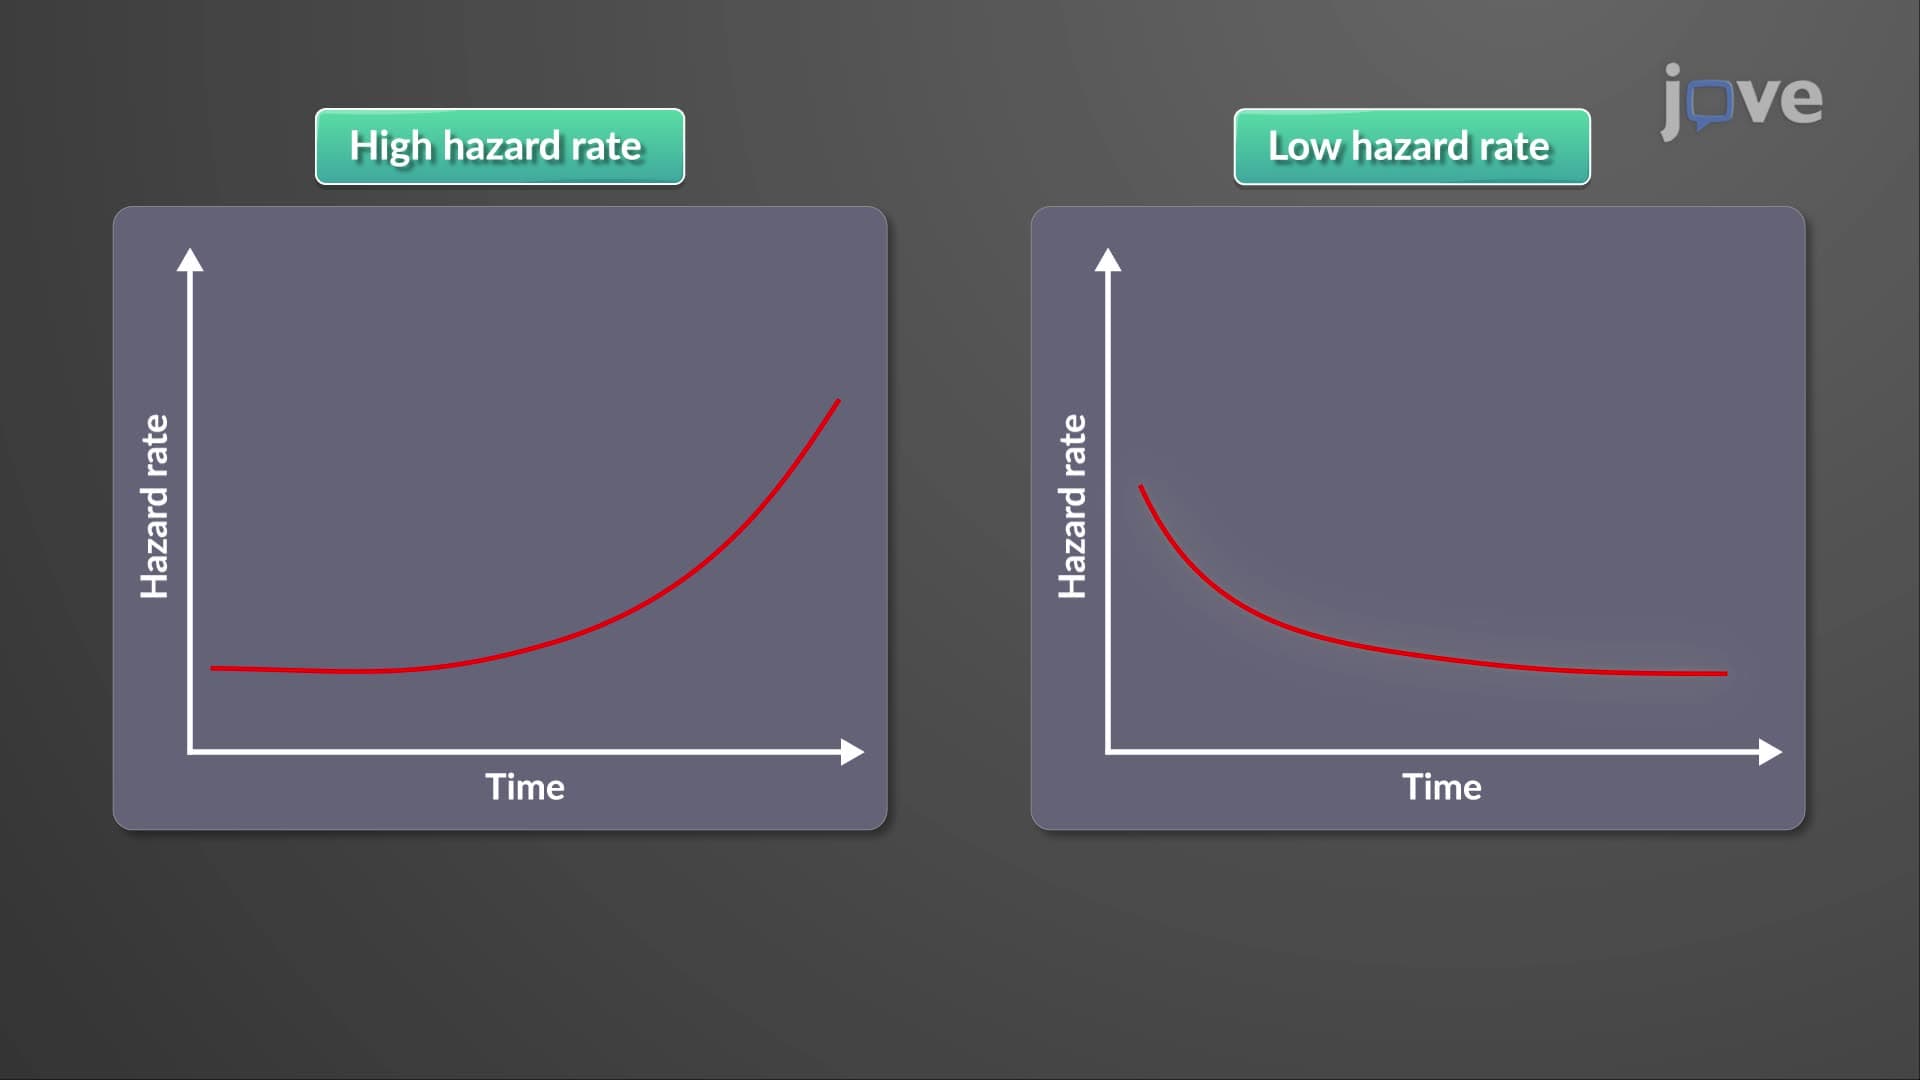
Understanding the types of survival curves requires examining different hazard patterns. The exponential survival model assumes constant hazard over time, meaning the risk remains unchanged regardless of age or duration. This model proves useful when studying sudden-onset diseases or accidents where prior exposure doesn't influence future risk.
The Weibull survival model offers greater flexibility, accommodating scenarios where hazard rates increase or decrease monotonically over time. For example, pediatric oncologists often use Weibull models when analyzing childhood leukemia survival, as treatment effectiveness may improve consistently over the treatment period.
Log-normal and log-logistic models handle more complex situations where hazard rates change non-monotonically-perhaps increasing initially, then decreasing. These models frequently appear in pharmaceutical research when analyzing drug efficacy, particularly for medications with delayed onset or tolerance development.
Clinical Applications and Real-World Examples
American medical institutions extensively use survival curves in clinical trials and treatment planning. The National Cancer Institute's SEER database employs survival curves to track five-year survival rates for various cancers across different demographic groups. Similarly, cardiac surgeons at institutions like the Mayo Clinic use survival curves to counsel patients about procedural risks and long-term outcomes.
Academic and Exam Relevance
Students preparing for the MCAT encounter survival curves in biological sciences sections, particularly when analyzing population dynamics or epidemiological studies. AP Statistics students explore survival analysis as part of advanced probability distributions, while college biostatistics courses dedicate entire units to survival analysis methodology. Understanding these concepts proves essential for students pursuing careers in medicine, public health, or biomedical research.
Frequently Asked Questions
A survival curve shows the percentage of a population remaining alive over time, starting at 100% and declining. Unlike death rate charts that show mortality at specific time points, survival curves provide cumulative survival probability, making them more useful for predicting long-term outcomes and comparing different groups or treatments.
The MCAT typically focuses on exponential (constant hazard), Weibull (monotonic hazard changes), and basic non-monotonic models like log-normal. You should understand when each model applies: exponential for constant risk scenarios, Weibull for aging or learning effects, and non-monotonic models for complex biological processes with changing risk patterns over time.
AP Statistics exams often include survival curves in free-response questions involving probability distributions and data interpretation. Students might analyze Kaplan-Meier curves, compare survival between groups, or calculate survival probabilities at specific time points. Focus on understanding the relationship between cumulative distribution functions and survival functions.
Hospitals like Johns Hopkins and Cleveland Clinic use survival curves because they provide more actionable information for patient counseling and treatment planning. While simple mortality rates only show deaths at specific times, survival curves reveal patterns over time, helping doctors explain prognosis and make evidence-based treatment recommendations to patients and families.
Not at all! While advanced survival analysis involves calculus, high school students can master the core concepts using basic algebra and probability. Focus on understanding the graphical interpretation, the relationship S(t) = 1 - F(t), and recognizing different curve shapes rather than complex mathematical derivations.
Create visual associations for each model type. Think "exponential = straight line on log scale = constant risk like car accidents," "Weibull = curved = aging effects like heart disease," and "log-normal = hump-shaped hazard = drug effects with onset and tolerance." Practice sketching each curve type and identifying real-world scenarios that match each pattern.
Survival curves form the foundation for advanced topics like Cox proportional hazards models, competing risks analysis, and clinical trial design. They also connect to epidemiology concepts like incidence rates, prevalence studies, and risk factor analysis. Mastering survival curves now prepares you for graduate-level biostatistics and epidemiology coursework.
Medical researchers, epidemiologists, biostatisticians, and actuaries rely heavily on survival analysis. Pharmaceutical companies use it for drug development, insurance companies for risk assessment, and government agencies like the CDC for public health monitoring. Understanding survival curves opens doors to careers in healthcare, research, and data science.
Related Micro-courses


