Loading concepts…


15 Concepts
15 Concepts
13 Concepts
11 Concepts
9 Concepts
14 Concepts
11 Concepts
15 Concepts
13 Concepts
7 Concepts
10 Concepts
10 Concepts
22 Concepts
19 Concepts
16 Concepts
16 Concepts
7 Concepts
 16 Concepts
 6K Views
 Popular topics







Survival analysis is a statistical method that examines the time until specific events occur, such as patient death, disease recurrence, or treatment failure. This powerful analytical framework handles incomplete data through censoring and provides crucial insights for medical research, insurance risk assessment, and public health policy in the United States. Master these essential time-to-event analysis techniques with JoVE Coach.
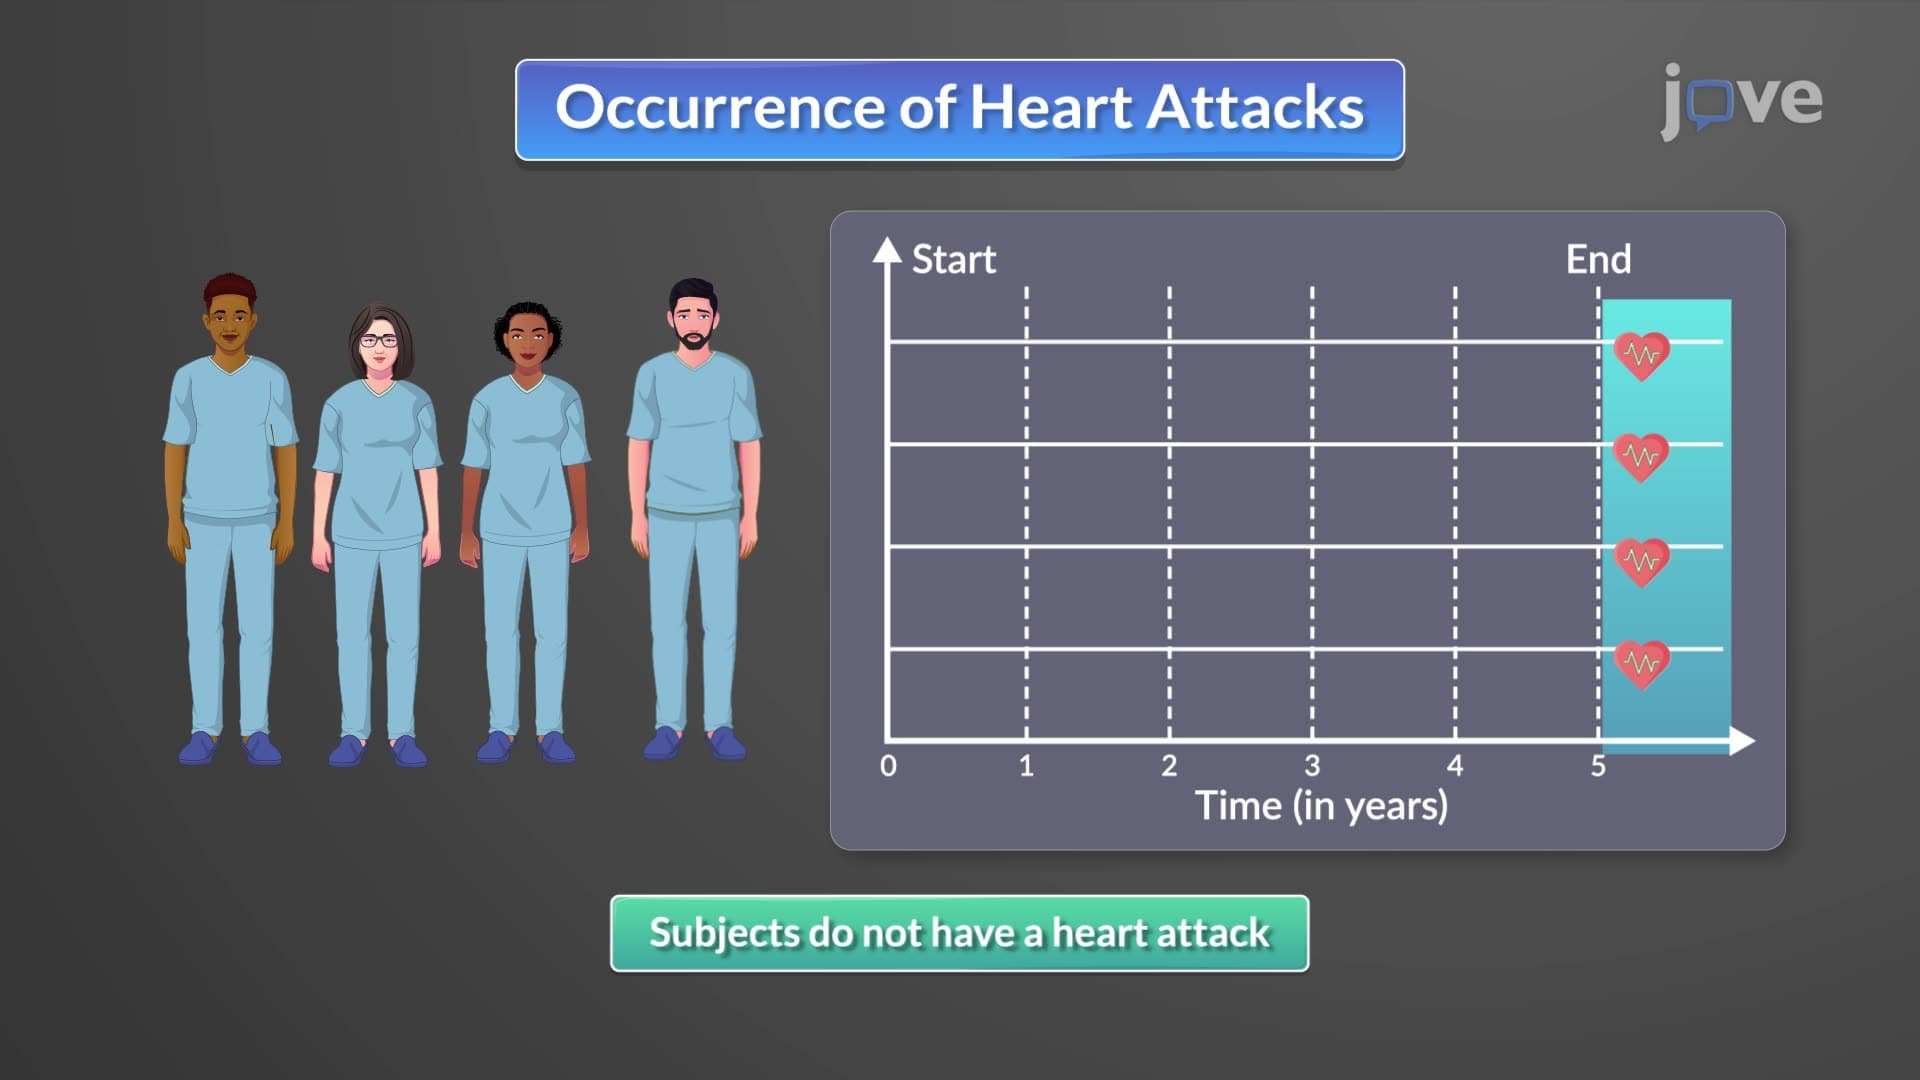
1. Fundamentals of Survival Analysis and Time-to-Event Data Survival analysis measures time from a starting point to an event of interest, such as death or disease recurrence. Unlike traditional statistical methods, survival analysis handles incomplete observations through censoring mechanisms. Key applications include cancer research studying remission-to-relapse times, pediatric dental studies tracking cavity development, and cardiovascular surgery outcomes. The method requires careful event definition, proper time measurement, and understanding of study populations to generate meaningful clinical insights for US healthcare systems.
2. Life Tables and Mortality Analysis Life tables systematically organize survival data across time intervals, displaying participant numbers, deaths, withdrawals, and conditional probabilities. Used extensively by US insurance companies and the CDC, these tables calculate survival rates while accounting for participants lost to follow-up. The effective exposure calculation assumes withdrawals occur mid-interval, reducing the denominator by half. Applications range from setting life insurance premiums to evaluating public health interventions and tracking population mortality trends across different US demographic groups.
3. Kaplan-Meier Survival Curves and Estimation Methods The Kaplan-Meier estimator creates step-function survival curves showing the probability of surviving beyond specific time points. This non-parametric method effectively handles censored data common in clinical trials, where patients may complete studies without experiencing events. The estimator assumes censored patients have similar survival prospects as observed patients and that event timing is accurately recorded. Widely used in FDA drug approval processes, these curves provide intuitive visual comparisons of treatment effectiveness in US clinical research.
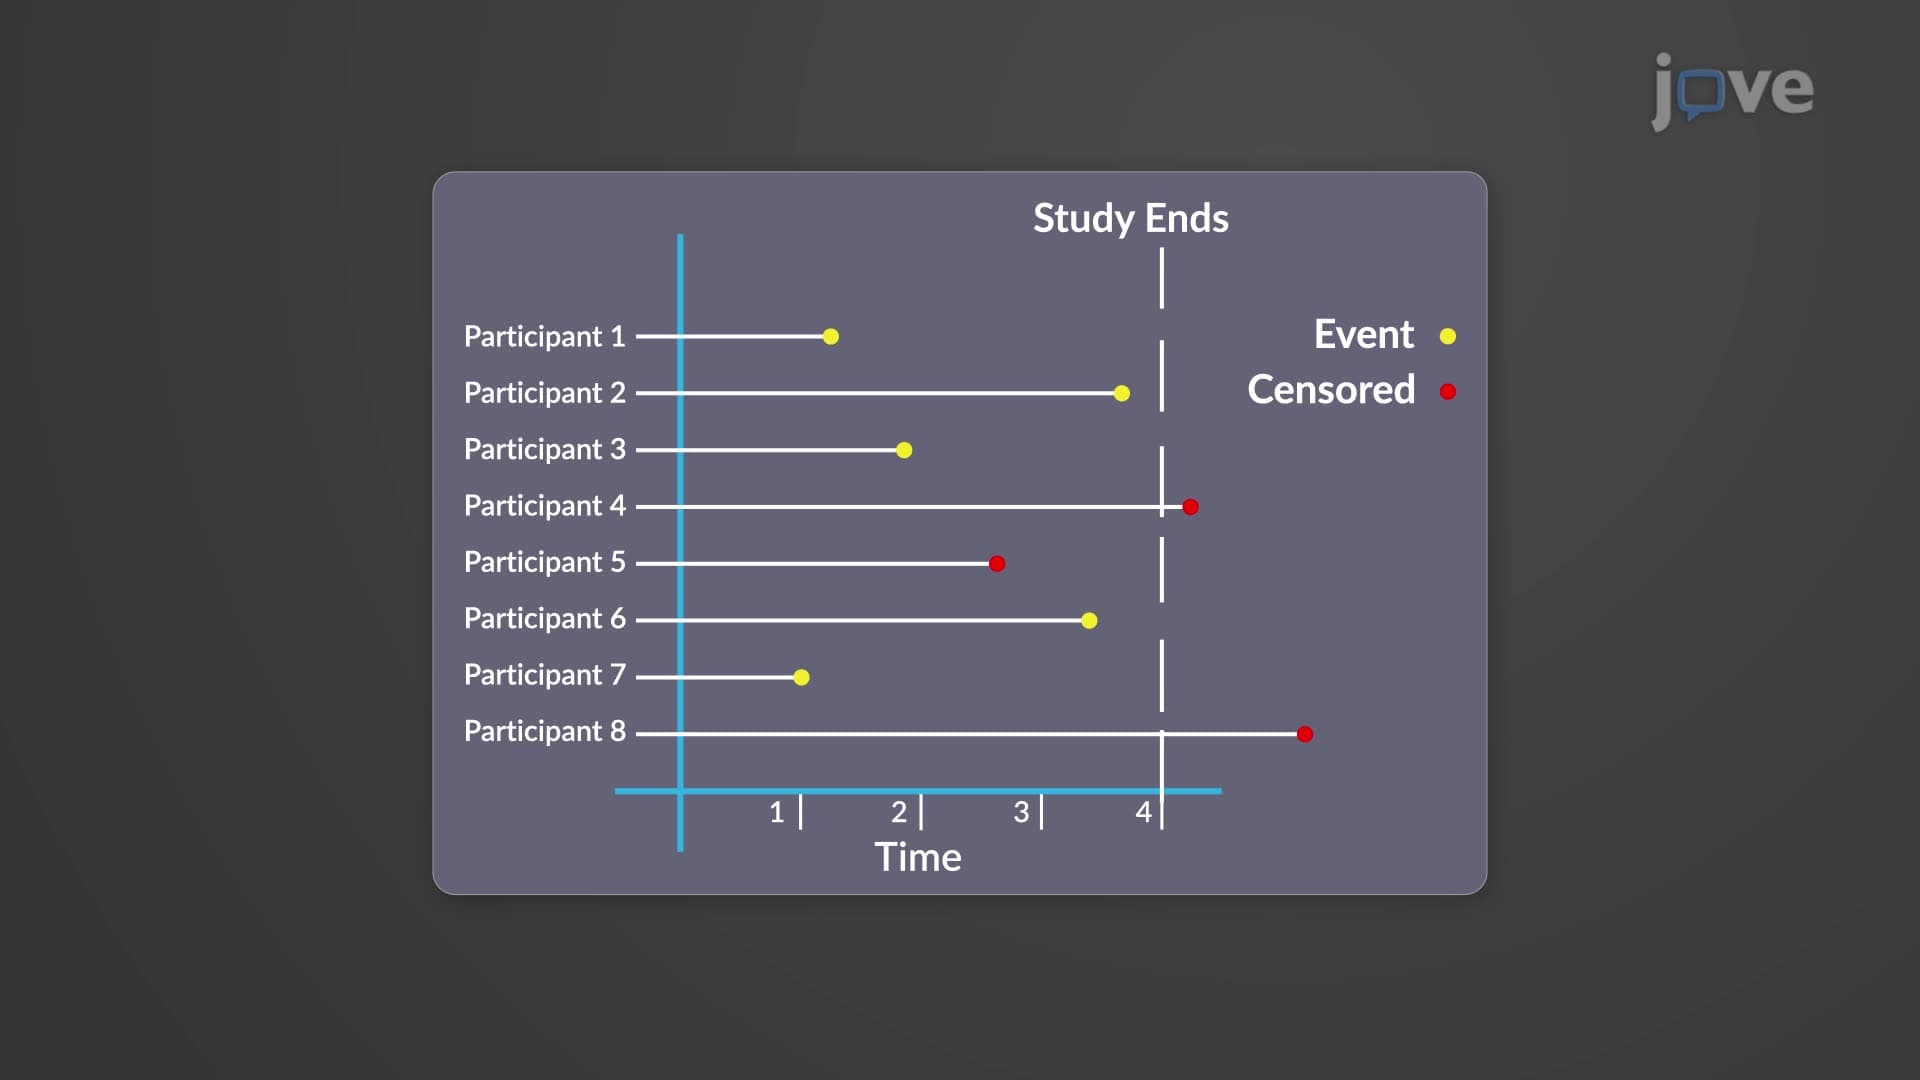
4. Censoring and Truncation in Survival Data Censoring occurs when complete survival information is unavailable, with right-censoring being most common when studies end before events occur. Left-censoring happens when event onset precedes observation, while interval censoring occurs during follow-up gaps. Truncation differs by completely excluding subjects from datasets. Understanding these concepts is crucial for US medical researchers analyzing clinical trial data, where patient dropout and study completion timing significantly impact results interpretation and regulatory submissions.
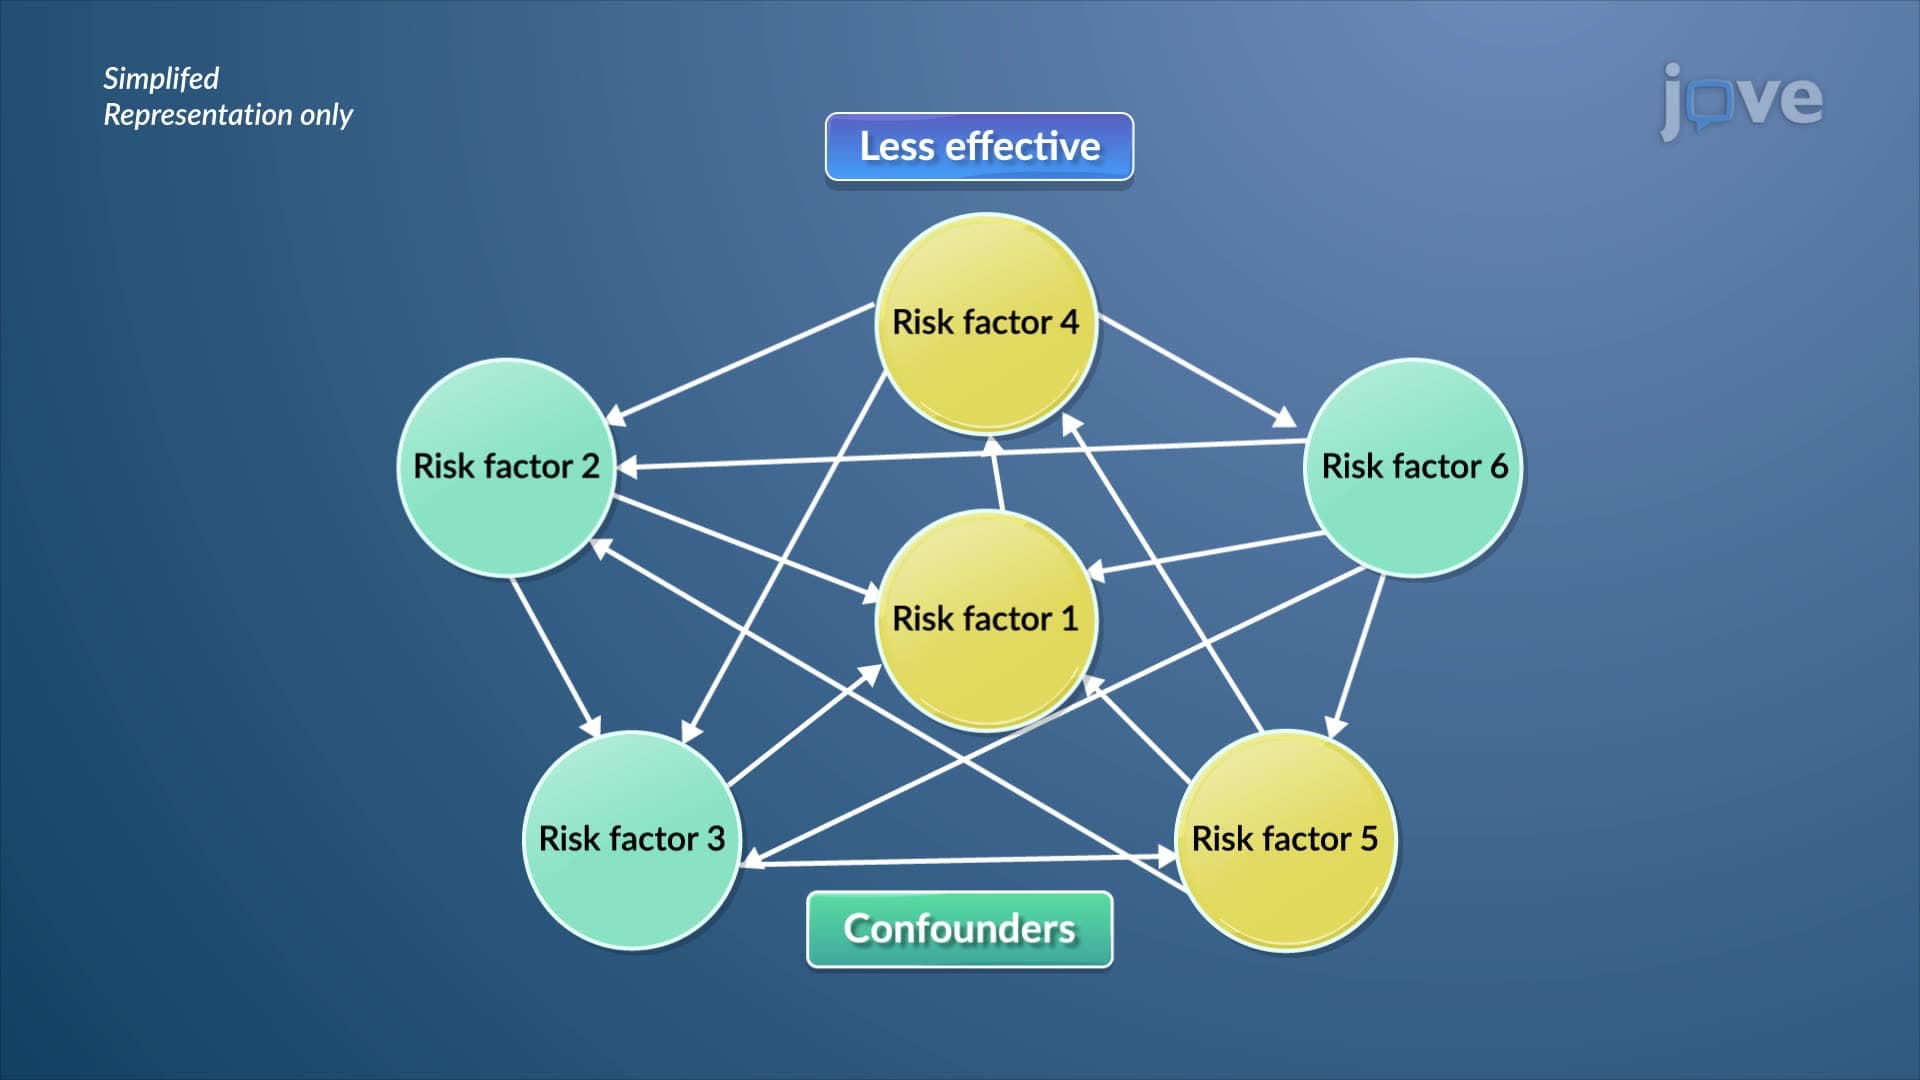
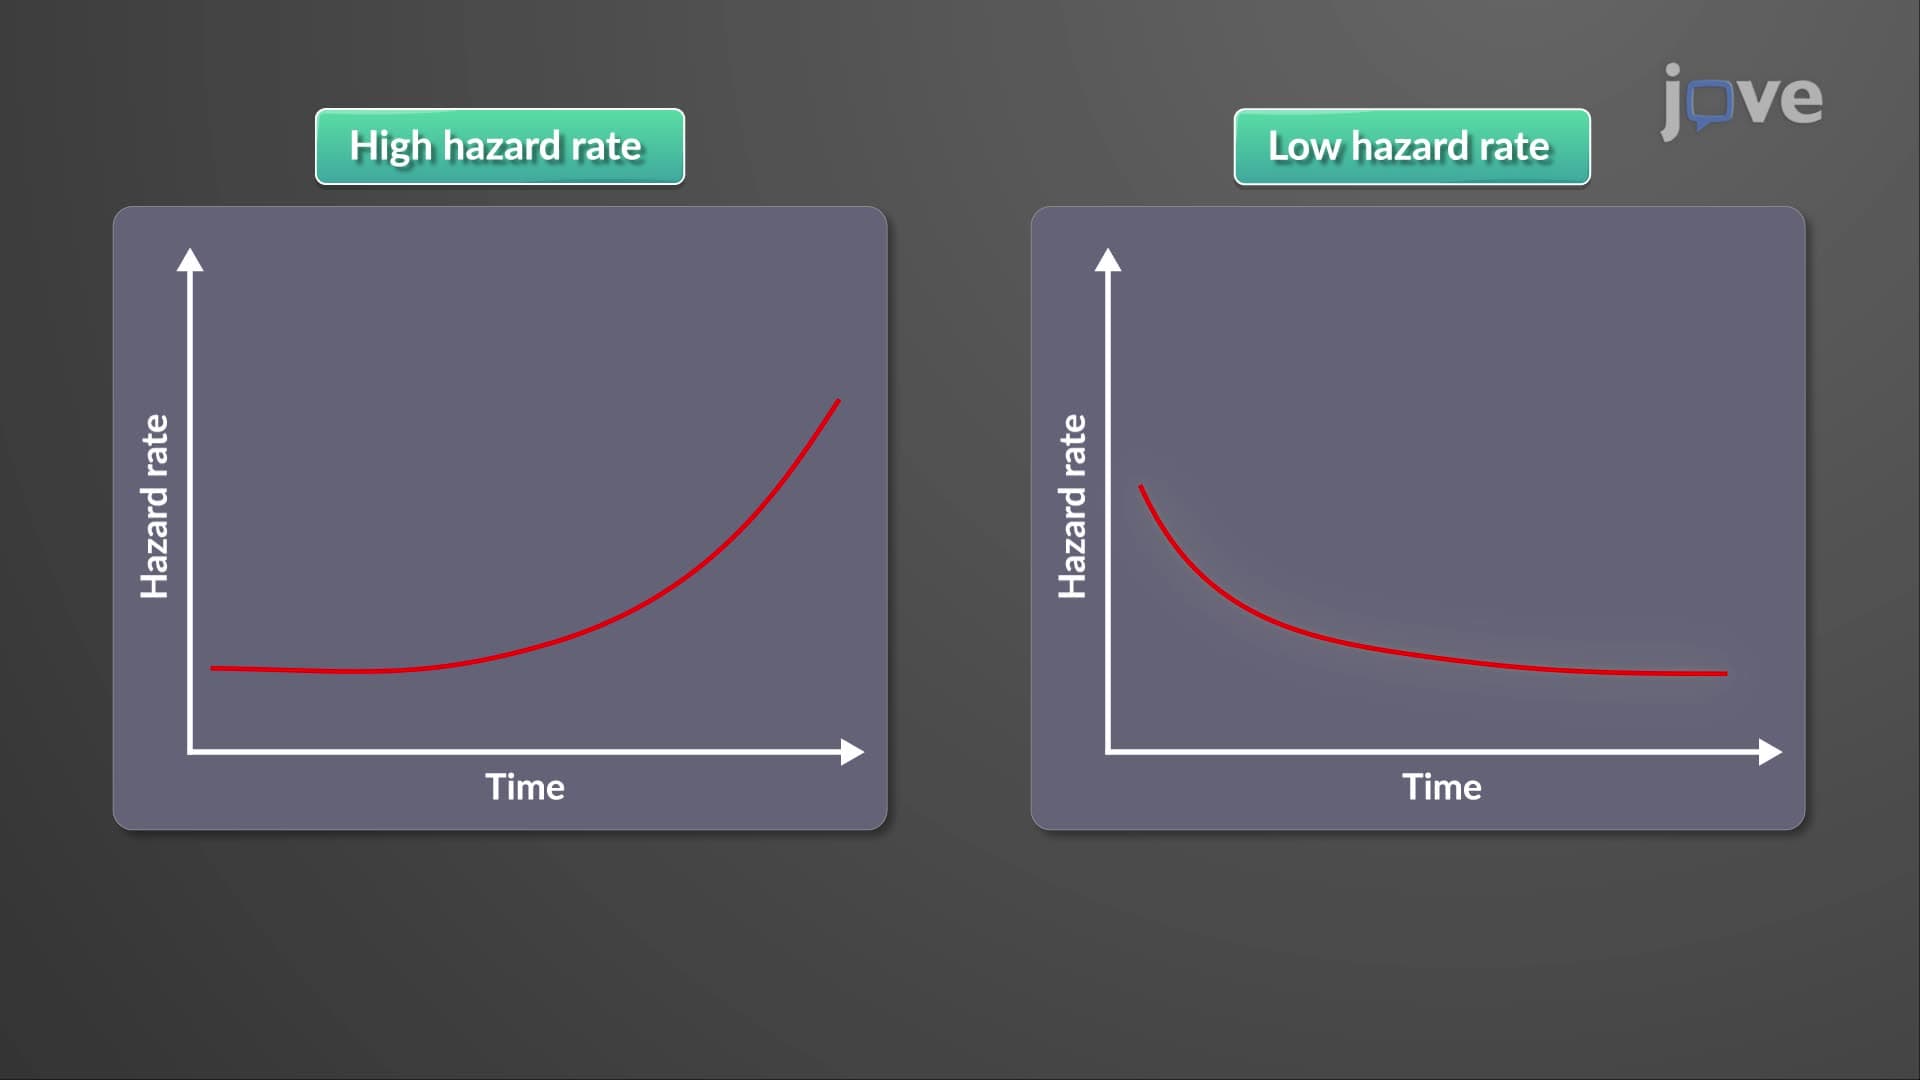
5. Hazard Rates, Hazard Ratios, and Risk Assessment Hazard rates measure instantaneous event risk at specific times, while hazard ratios compare risks between groups. A hazard ratio below 1 indicates reduced risk in the experimental group, above 1 suggests increased risk, and equal to 1 implies no difference. These metrics are fundamental in US pharmaceutical research for demonstrating drug efficacy and safety. The Cox proportional hazards model extends this concept by adjusting for multiple risk factors, providing more sophisticated analyses required by FDA regulatory standards.
6. Log-Rank Test and Group Comparisons The Mantel-Cox log-rank test compares survival distributions between two or more groups without assuming specific distribution shapes. This non-parametric test calculates differences between observed and expected events across groups, making it ideal for analyzing censored clinical trial data. Commonly used in US cancer research to evaluate new therapies, the test relies on proportional hazards assumptions. Violations of these assumptions, particularly in studies with small sample sizes or high censoring rates, can compromise result reliability and clinical decision-making.
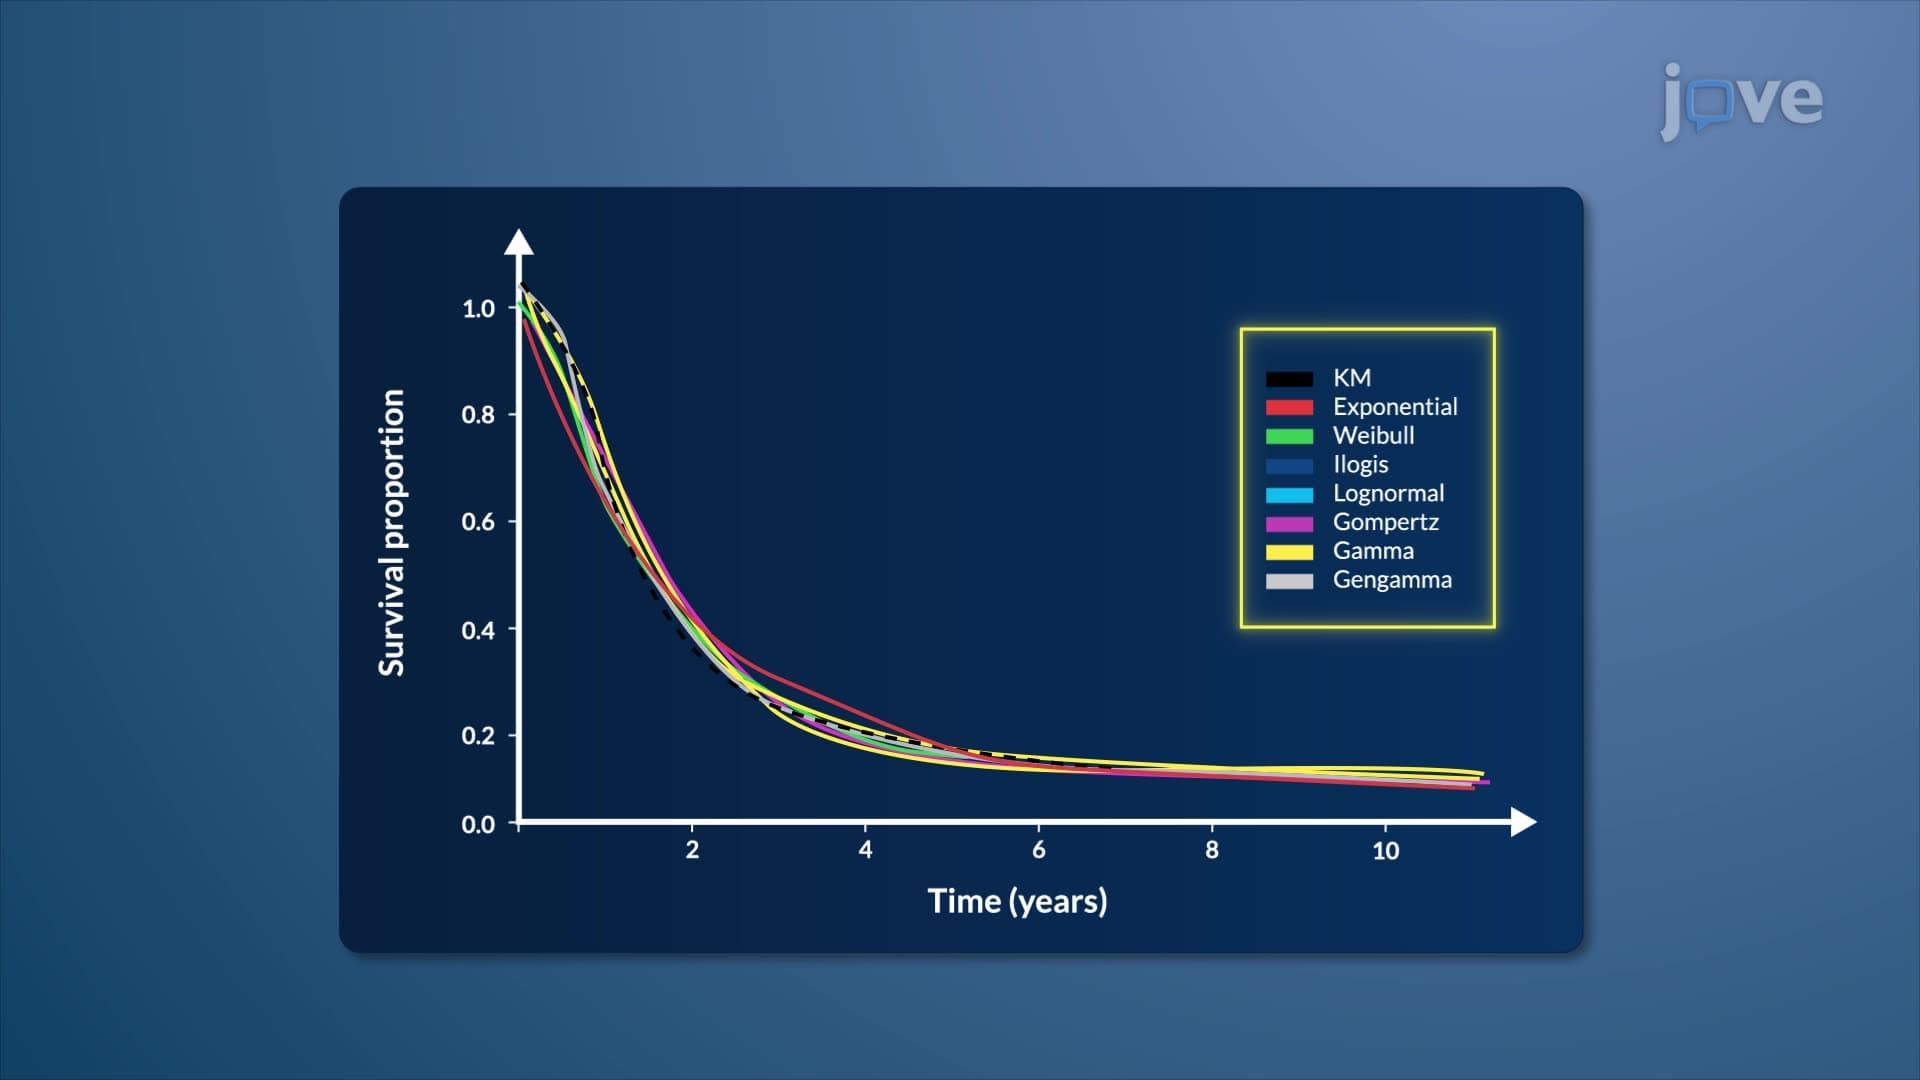
7. Parametric Survival Models: Weibull and Exponential Methods Parametric survival models assume specific distributions for survival times, with Weibull and exponential models being most common. The Weibull distribution's shape parameter determines hazard function behavior: values greater than 1 indicate increasing risk over time, less than 1 suggest decreasing risk, and equal to 1 represents constant hazard (exponential model). These models are valuable in US manufacturing for reliability analysis and in epidemiology for modeling disease progression when biological mechanisms suggest specific hazard patterns over time.