Loading subject page…

- Statistics
- Survival Analysis
- Comparing the Survival Analysis of Two or More Groups
Micro-course: Survival Analysis
5,966 views
Learn key concepts and earn your certificate.









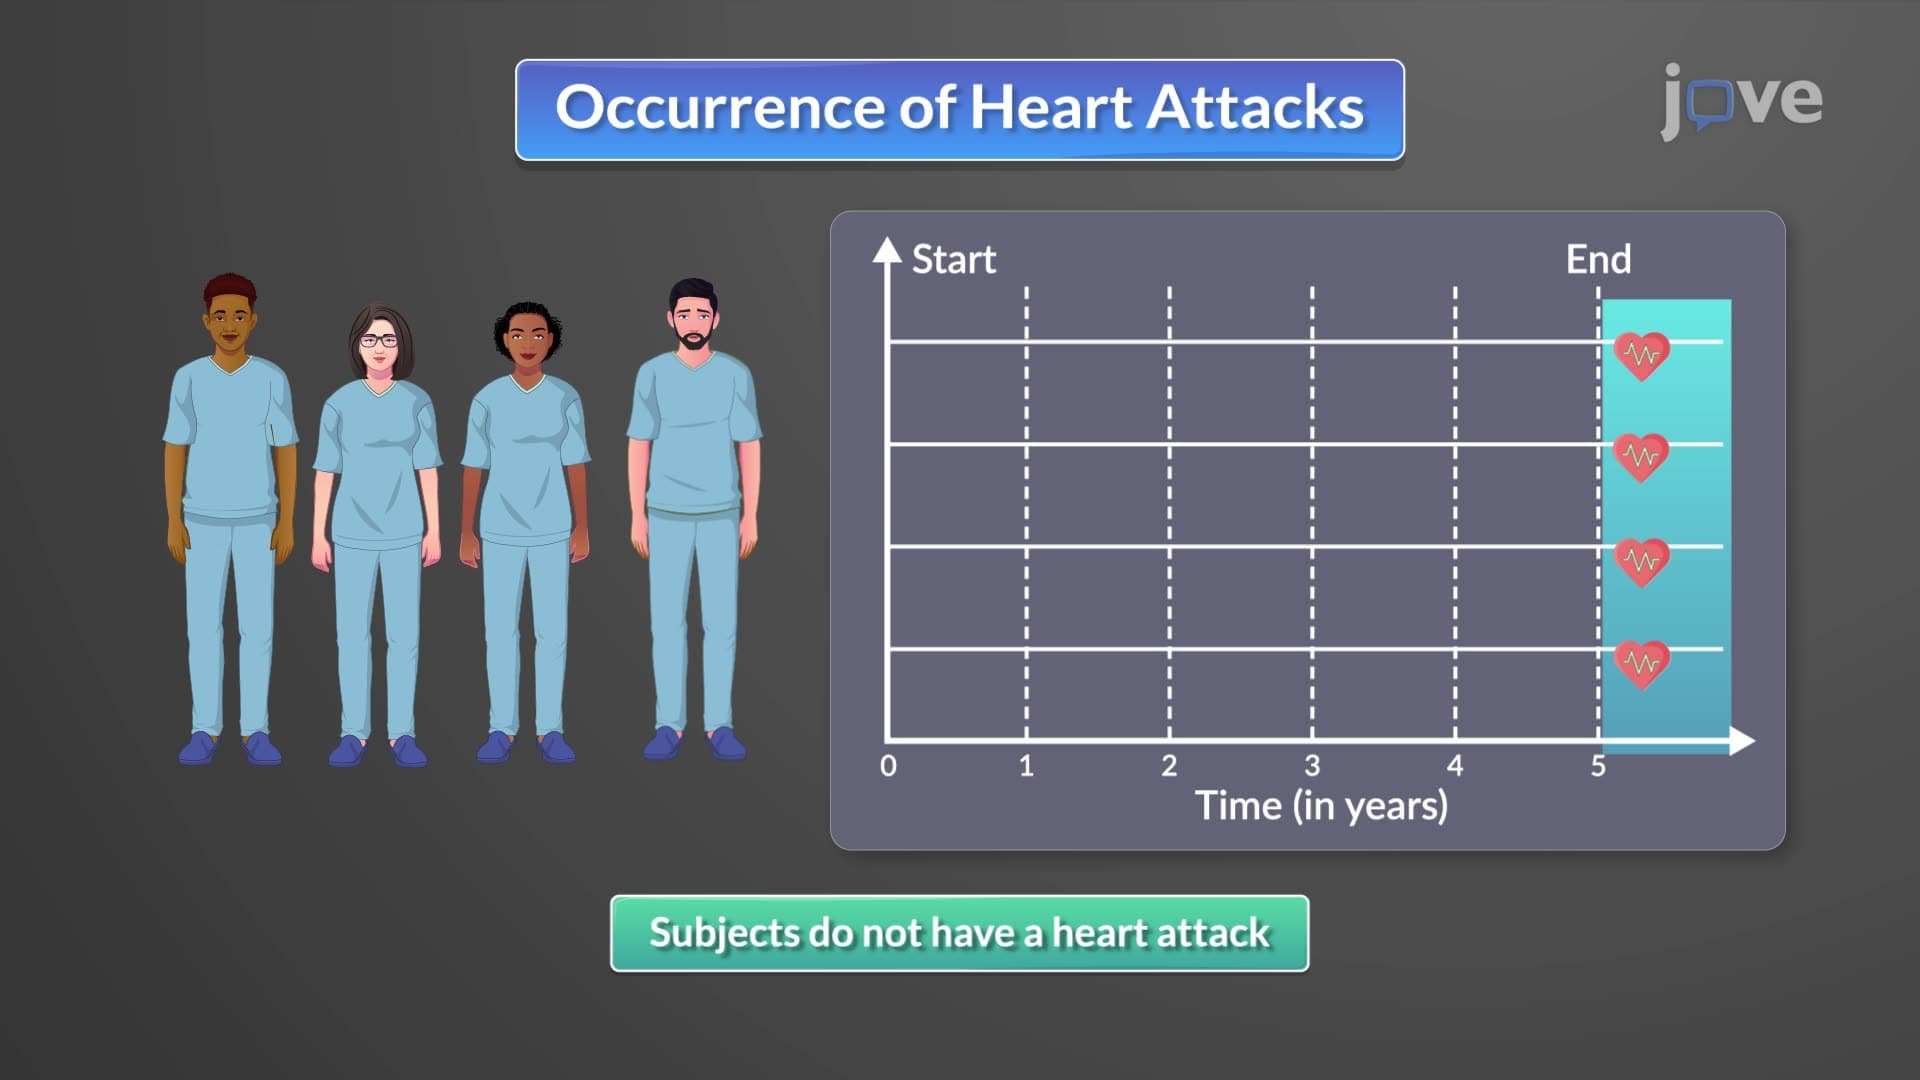


Comparing the Survival Analysis of Two or More Groups


00:00
01:20
Video Summary: Comparing the Survival Analysis of Explained
Did you know that survival analysis helped determine the most effective chemotherapy protocols for ovarian cancer patients at major US cancer centers like MD Anderson? Comparing the survival analysis of different treatment groups reveals which interventions truly extend patient lives by accounting for incomplete data where some patients haven't experienced the event by study's end. This statistical approach uses specialized techniques like Kaplan-Meier curves and Cox regression models to evaluate treatment effectiveness in clinical trials. Watch the full video on JoVE Coach to master this concept with expert-led visuals and step-by-step explanations.
- Understand how comparing the survival analysis of different treatment groups provides reliable evidence for medical decision-making in clinical research
- Identify the key components of survival analysis including time-to-event data, censoring, and the statistical methods used to handle incomplete observations
- Analyze Kaplan-Meier survival curves to determine which treatment groups show superior survival probabilities over time
- Compare survival distributions between multiple groups using log-rank tests to detect statistically significant differences
- Evaluate hazard ratios from Cox proportional hazards models to quantify the relative risk associated with different treatments
- Apply survival analysis concepts to interpret clinical trial results and understand how censored data affects study conclusions
- Recognize the advantages of survival analysis over simple mortality rates when comparing treatment effectiveness in medical research
- Explore real-world applications of survival analysis in oncology, cardiology, and public health studies conducted in US healthcare systems
Understanding Comparing The Survival Analysis of Treatment Groups
Comparing the survival analysis of different interventions represents one of the most critical statistical approaches in medical research and clinical trials. Unlike simple comparisons of mortality rates, survival analysis accounts for the timing of events and handles incomplete data where patients may still be alive at the study's conclusion. This methodology has revolutionized how researchers evaluate treatment effectiveness, particularly in oncology and chronic disease management.
The Kaplan-Meier Method: Visualizing Survival Differences
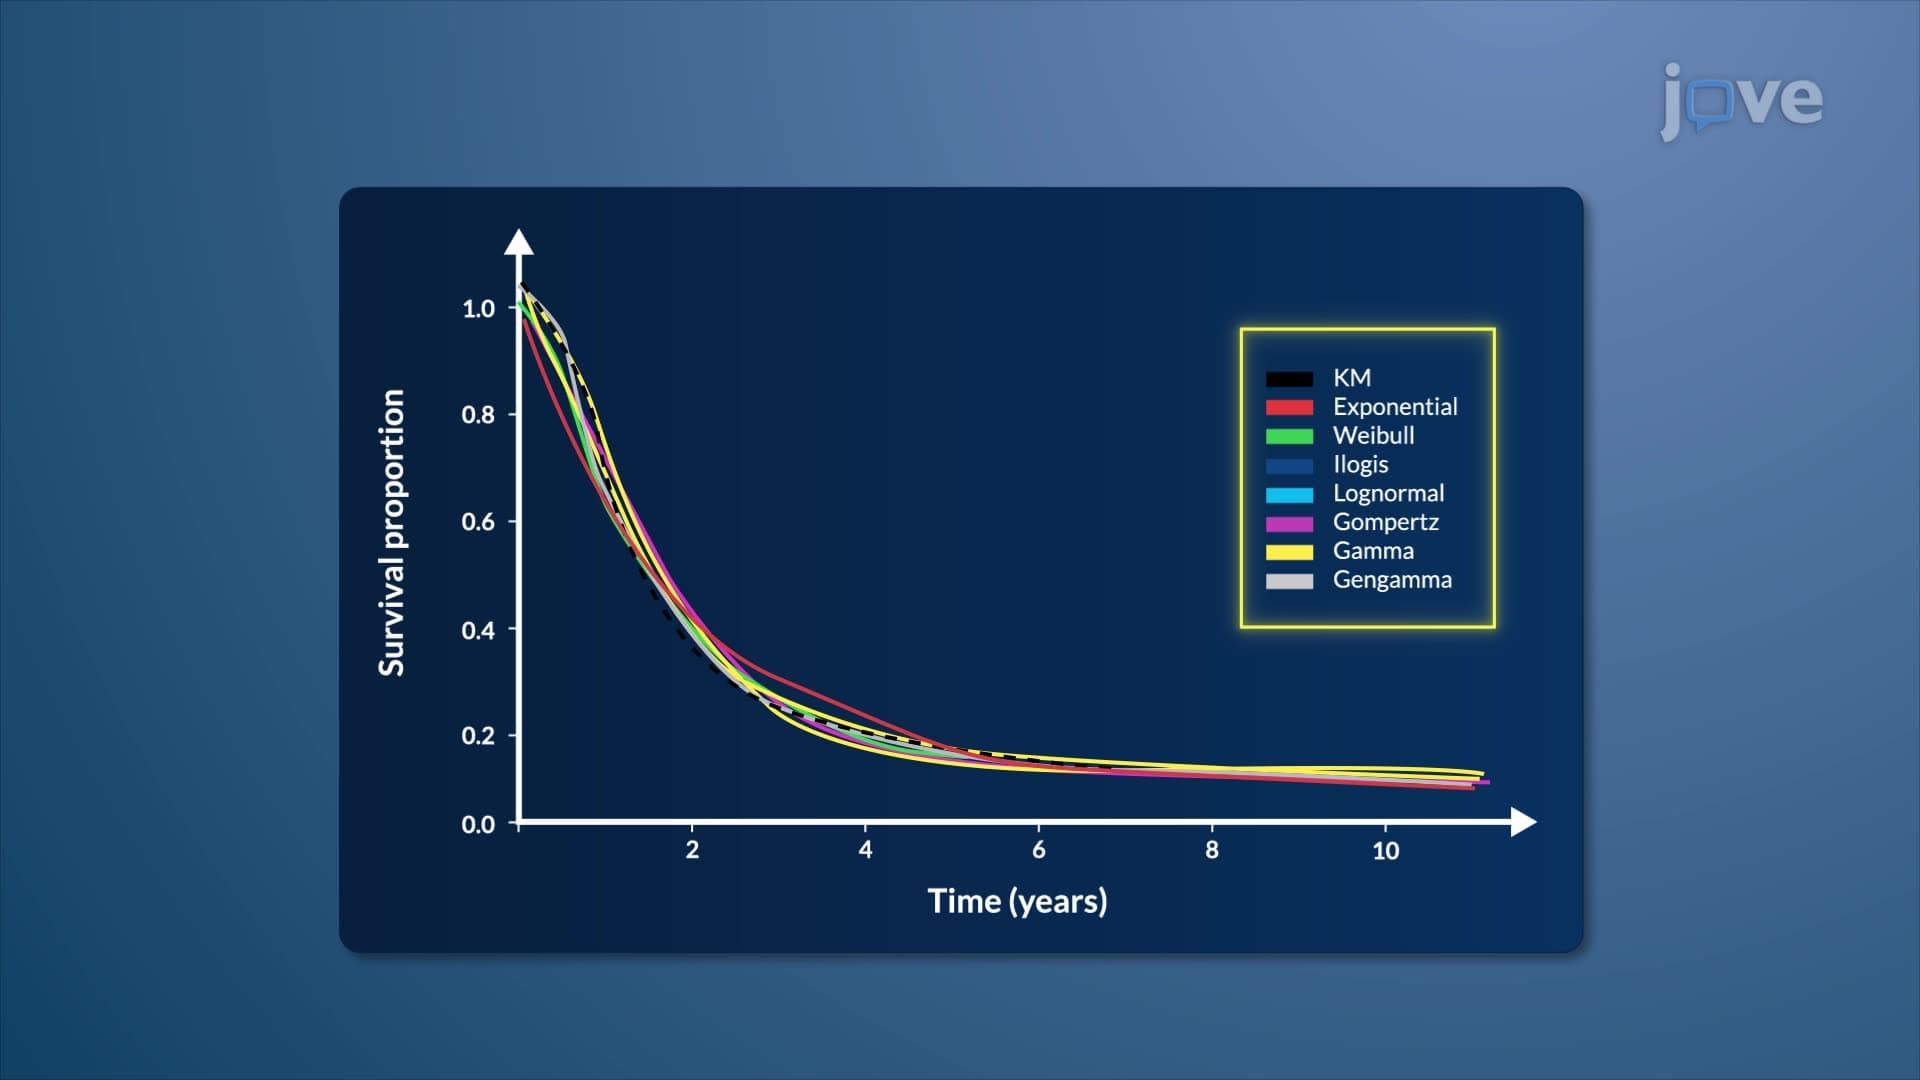
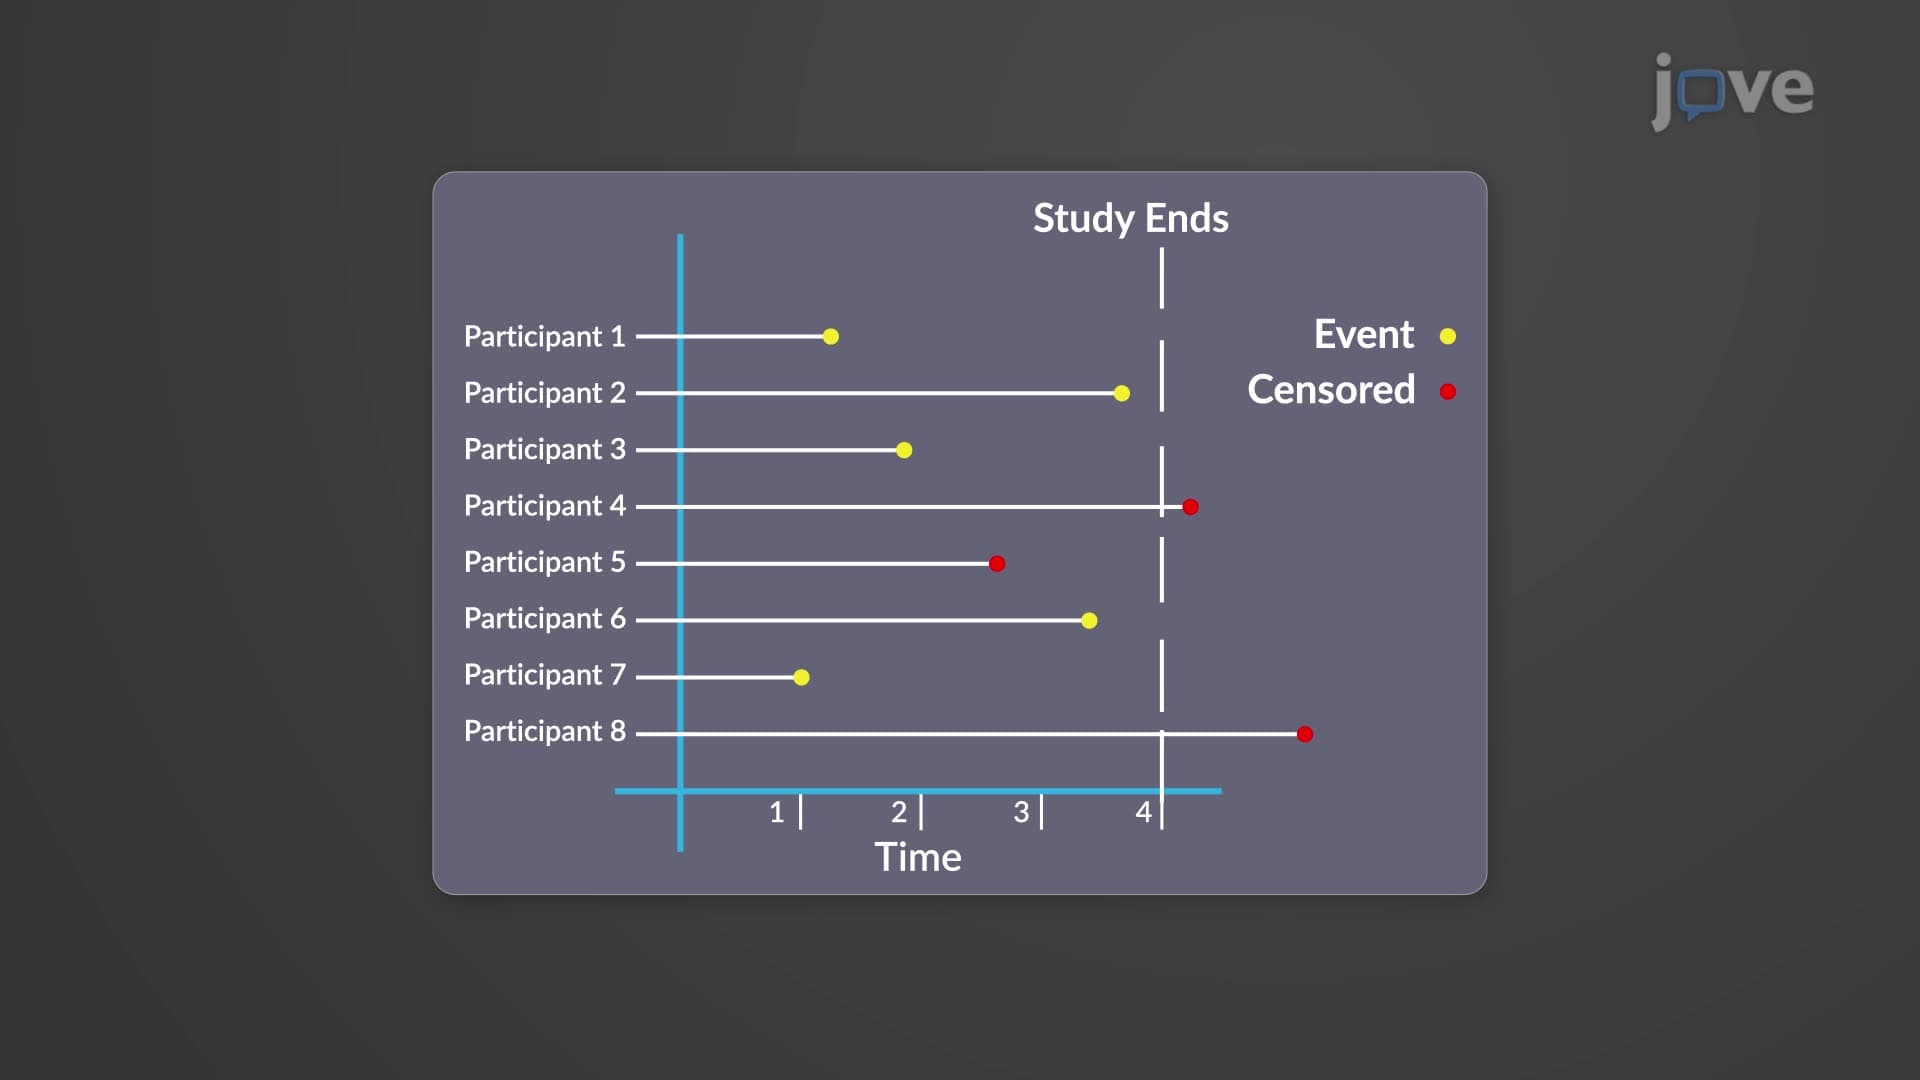
The Kaplan-Meier estimator serves as the foundation for comparing survival experiences across different groups. When researchers at institutions like the National Cancer Institute compare chemotherapy regimens, they create step-wise survival curves that show the probability of survival at each time point. These curves provide immediate visual insight into which treatment maintains higher survival rates over time. The method elegantly handles censored observations-patients who drop out of studies or remain event-free at study completion-without biasing results.
For students preparing for the MCAT or advanced placement biology exams, understanding these curves is essential. The curves typically start at 100% survival and decline in steps each time an event occurs. When comparing multiple treatment groups, researchers look for curve separation and the timing of when differences emerge.
Statistical Testing: The Log-Rank Test
The log-rank test provides the statistical foundation for determining whether observed differences between survival curves are statistically significant. This non-parametric test compares the entire survival experience between groups without making assumptions about the underlying survival distributions. In clinical practice, a significant log-rank test (typically p < 0.05) suggests that the treatments have genuinely different effects on survival time.
Students studying for college-level biostatistics courses should recognize that the log-rank test evaluates the null hypothesis that all groups have identical survival distributions. The test statistic follows a chi-square distribution, making it accessible for undergraduate statistics students.
Cox Proportional Hazards Model: Adjusting for Multiple Factors
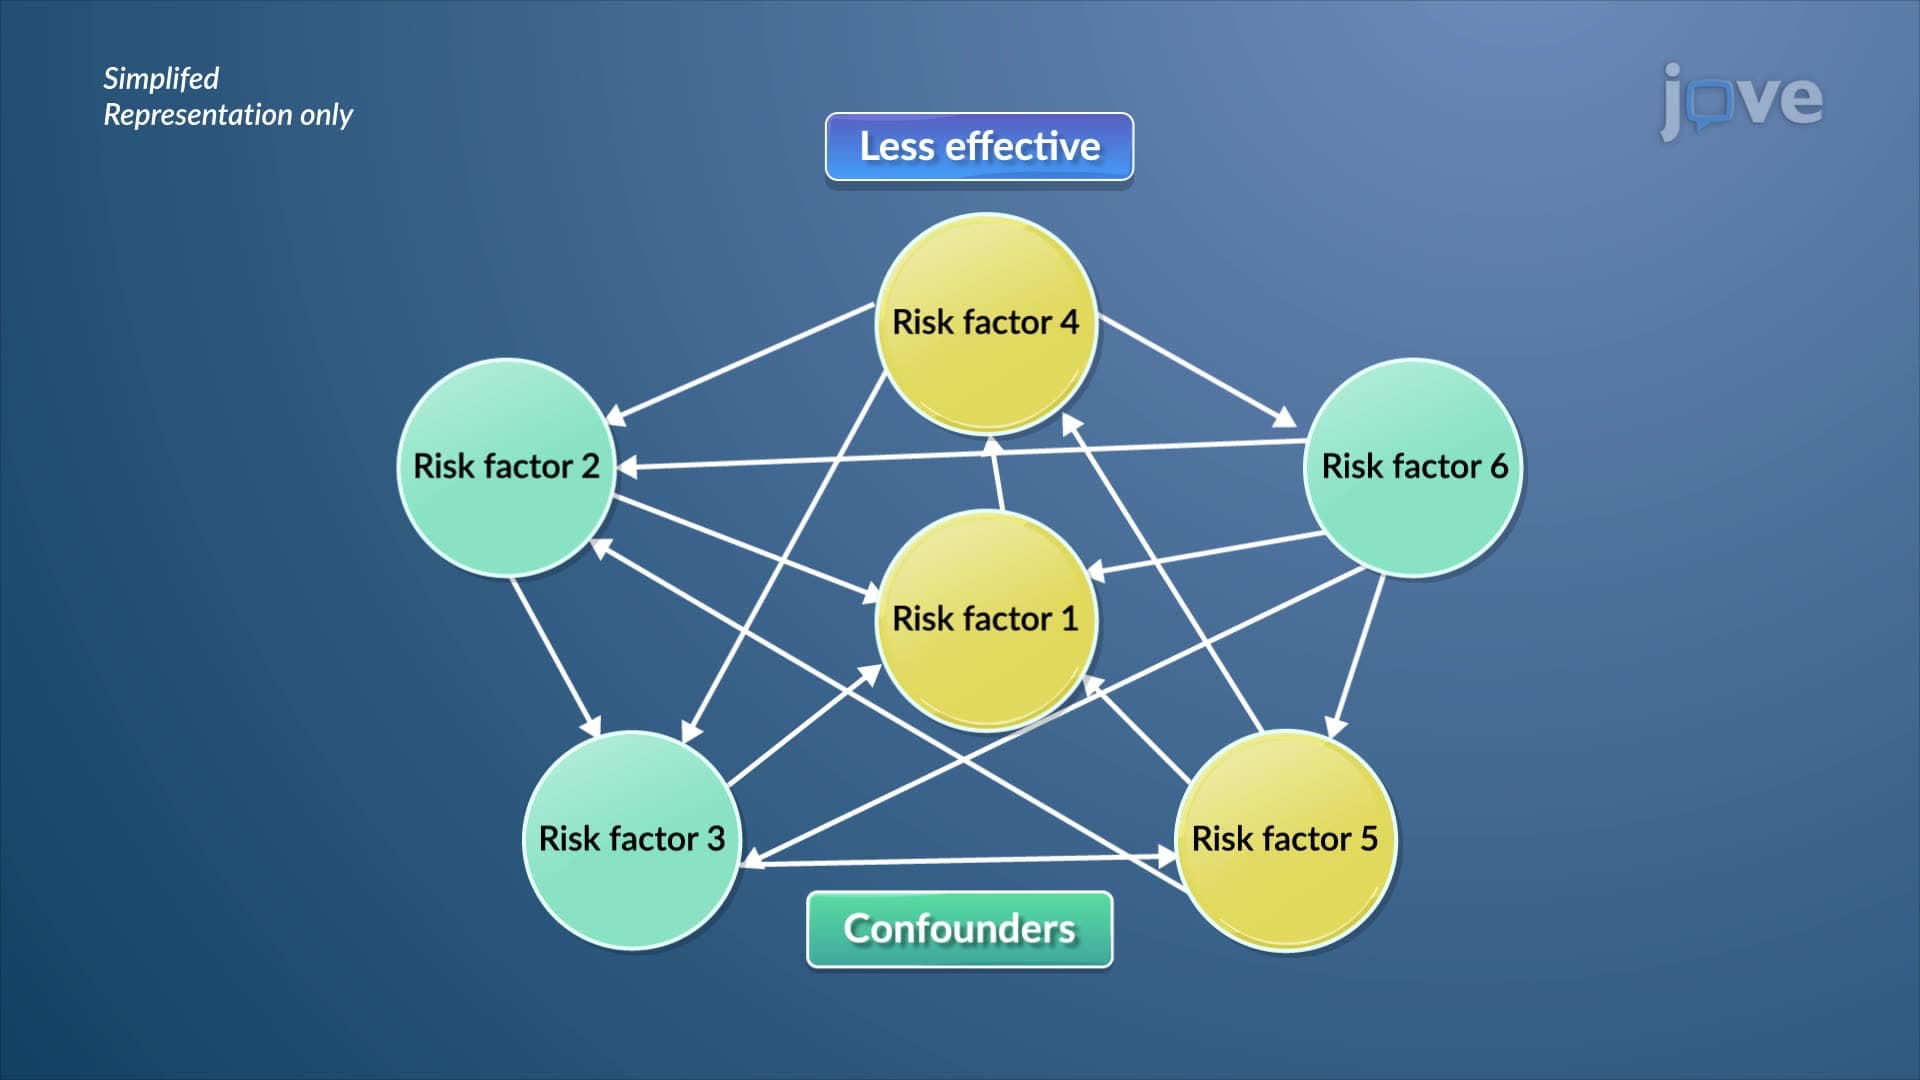
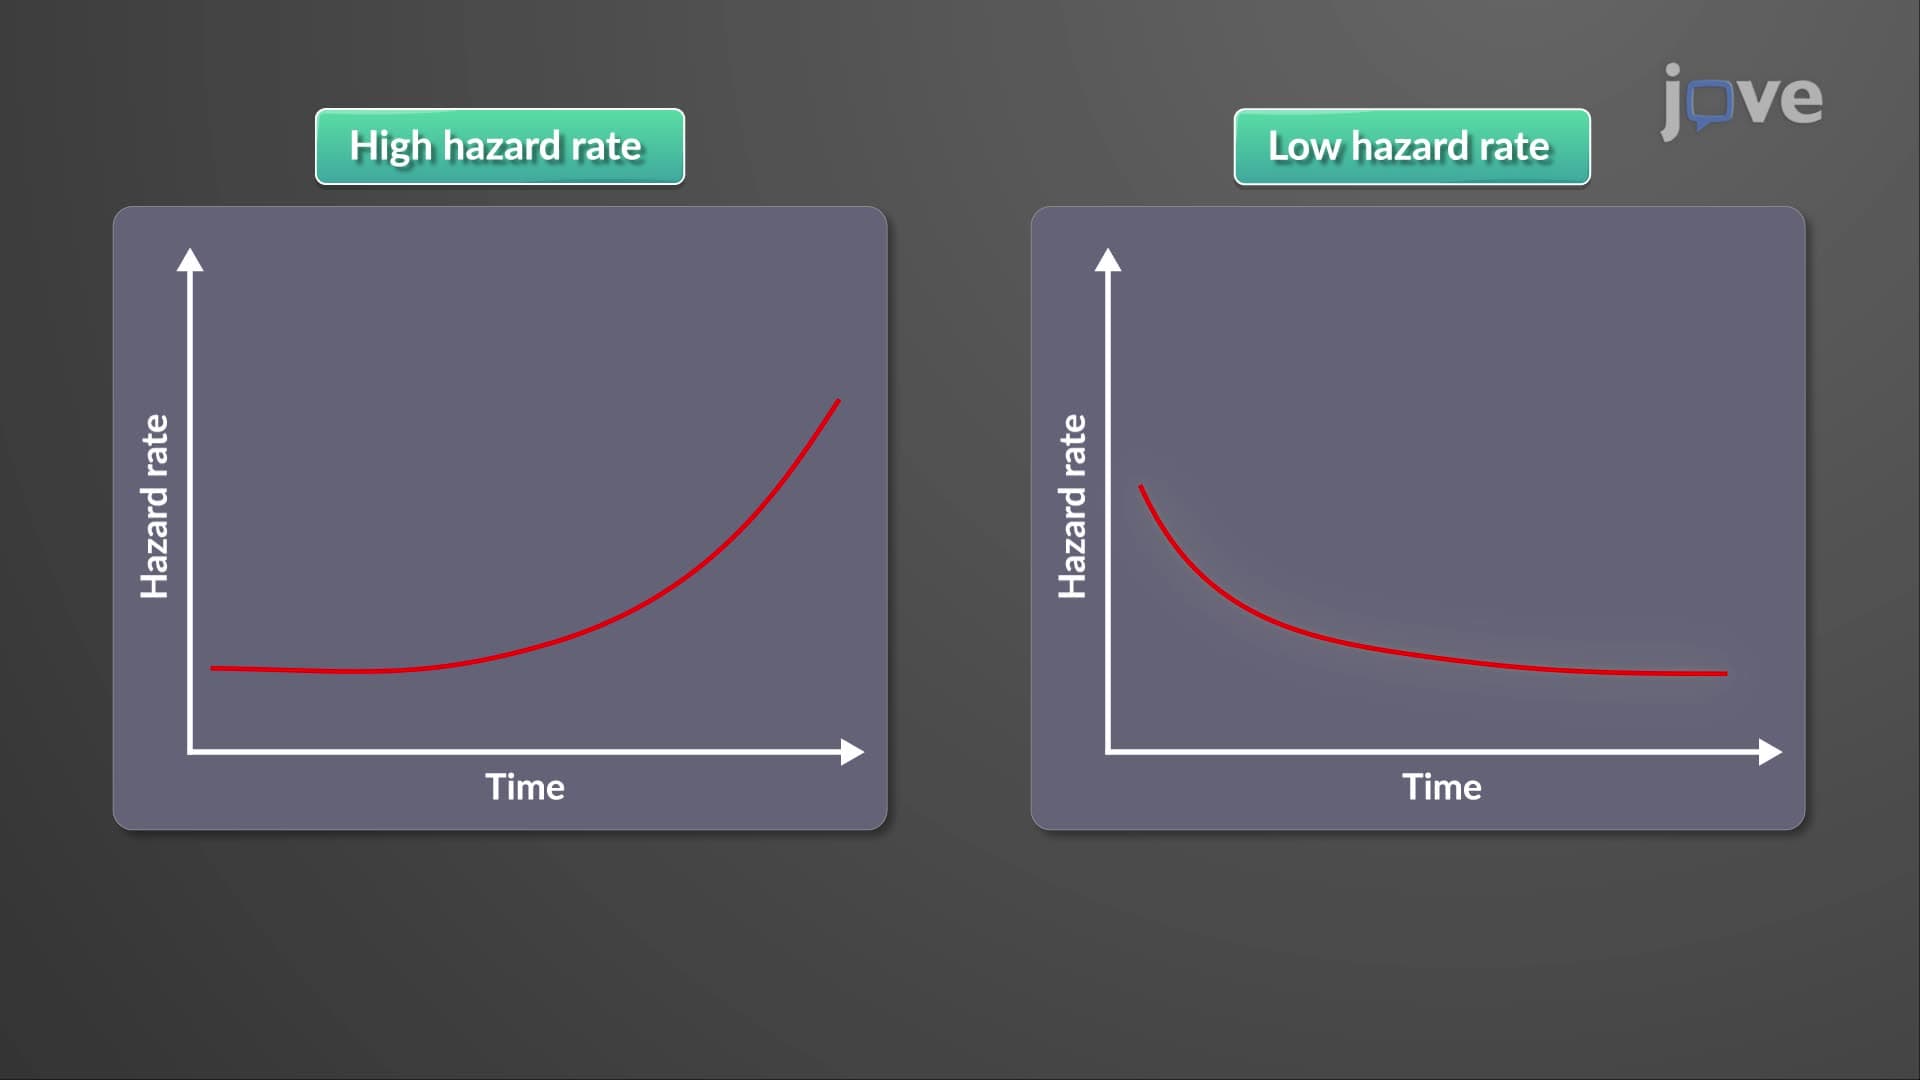
The Cox regression model represents the most sophisticated approach to comparing survival analysis outcomes while controlling for confounding variables. This semi-parametric model estimates hazard ratios-the relative risk of experiencing the event at any given time-while adjusting for factors like age, disease stage, or comorbidities. A hazard ratio of 0.5 indicates that the treatment group has half the risk of the event compared to the control group.
US medical schools emphasize Cox regression in epidemiology and biostatistics curricula because it mirrors real clinical decision-making, where multiple patient factors influence outcomes simultaneously.
Frequently Asked Questions
Comparing the survival analysis of treatment groups means using statistical methods to determine which interventions provide better patient outcomes over time. This approach accounts for incomplete follow-up data and timing of events, providing more accurate treatment comparisons than simple mortality rates. It's essential for evidence-based medicine and regulatory drug approvals by the FDA.
The MCAT includes survival analysis concepts in the Psychological, Social, and Biological Foundations section, particularly when testing interpretation of clinical research studies. Students must understand Kaplan-Meier curves, hazard ratios, and how to identify which treatment shows superior outcomes. AP Biology and college biostatistics courses also emphasize these concepts for understanding clinical trial design.
Students often struggle with interpreting censored data and understanding why traditional statistical tests can't handle time-to-event outcomes. Exam questions frequently test the ability to read Kaplan-Meier curves, interpret hazard ratios, and explain why certain patients contribute different amounts of information to the analysis. Practice with real clinical trial examples improves performance significantly.
Clinical researchers use survival analysis to compare new cancer treatments against standard therapies, evaluate surgical techniques, and assess medical device effectiveness. For example, cardiac surgeons compare long-term survival rates between different valve replacement procedures, while oncologists determine optimal chemotherapy combinations based on progression-free survival data from multi-center trials.
No advanced calculus is required to grasp the fundamental concepts and interpret results. High school students with solid algebra and basic statistics knowledge can understand Kaplan-Meier curves and hazard ratio interpretation. The mathematical complexity lies in the derivations, which aren't necessary for most pre-med and undergraduate applications.
Focus on interpreting graphical displays and understanding practical significance rather than memorizing formulas. Practice reading published clinical trial results from journals like JAMA or New England Journal of Medicine. Create flashcards for key terms like censoring, hazard ratios, and confidence intervals. Work through sample problems that require comparing multiple survival curves.
Advanced students should explore competing risks analysis for situations with multiple possible outcomes, time-dependent covariates in Cox models, and propensity score matching for observational studies. These concepts appear in graduate-level biostatistics and epidemiology courses and are increasingly important for understanding modern clinical research methodology.
Related Micro-courses


