Loading video…


 16 Concepts
 6K views

Video Summary: What are Life Tables
Ever wondered how insurance companies predict when people might die, or how epidemiologists track disease outbreaks? Life tables are powerful statistical tools that map survival patterns across entire populations, revealing hidden trends in mortality data. The CDC uses life tables to calculate national life expectancy rates, helping guide public health policy across America. These comprehensive charts organize survival data into columns showing time intervals, participant numbers, deaths, withdrawals, and cumulative survival probabilities. Watch the full video on JoVE Coach to master this concept with expert-led visuals and step-by-step explanations.
Life tables serve as essential epidemiological tools that systematically organize survival data to reveal population mortality patterns. Also known as mortality tables, these statistical frameworks transform raw survival data into meaningful insights about death rates, life expectancy, and disease progression. Students encounter life tables in AP Statistics, college biostatistics courses, and pre-med curricula, making them crucial for MCAT preparation and advanced healthcare studies.
The fundamental structure consists of strategically arranged columns, each serving specific analytical purposes. The first column establishes time intervals (often years, months, or specific follow-up periods), while subsequent columns track participant flow throughout the study. This systematic organization enables researchers to calculate precise survival probabilities and identify mortality trends across different populations or treatment groups.
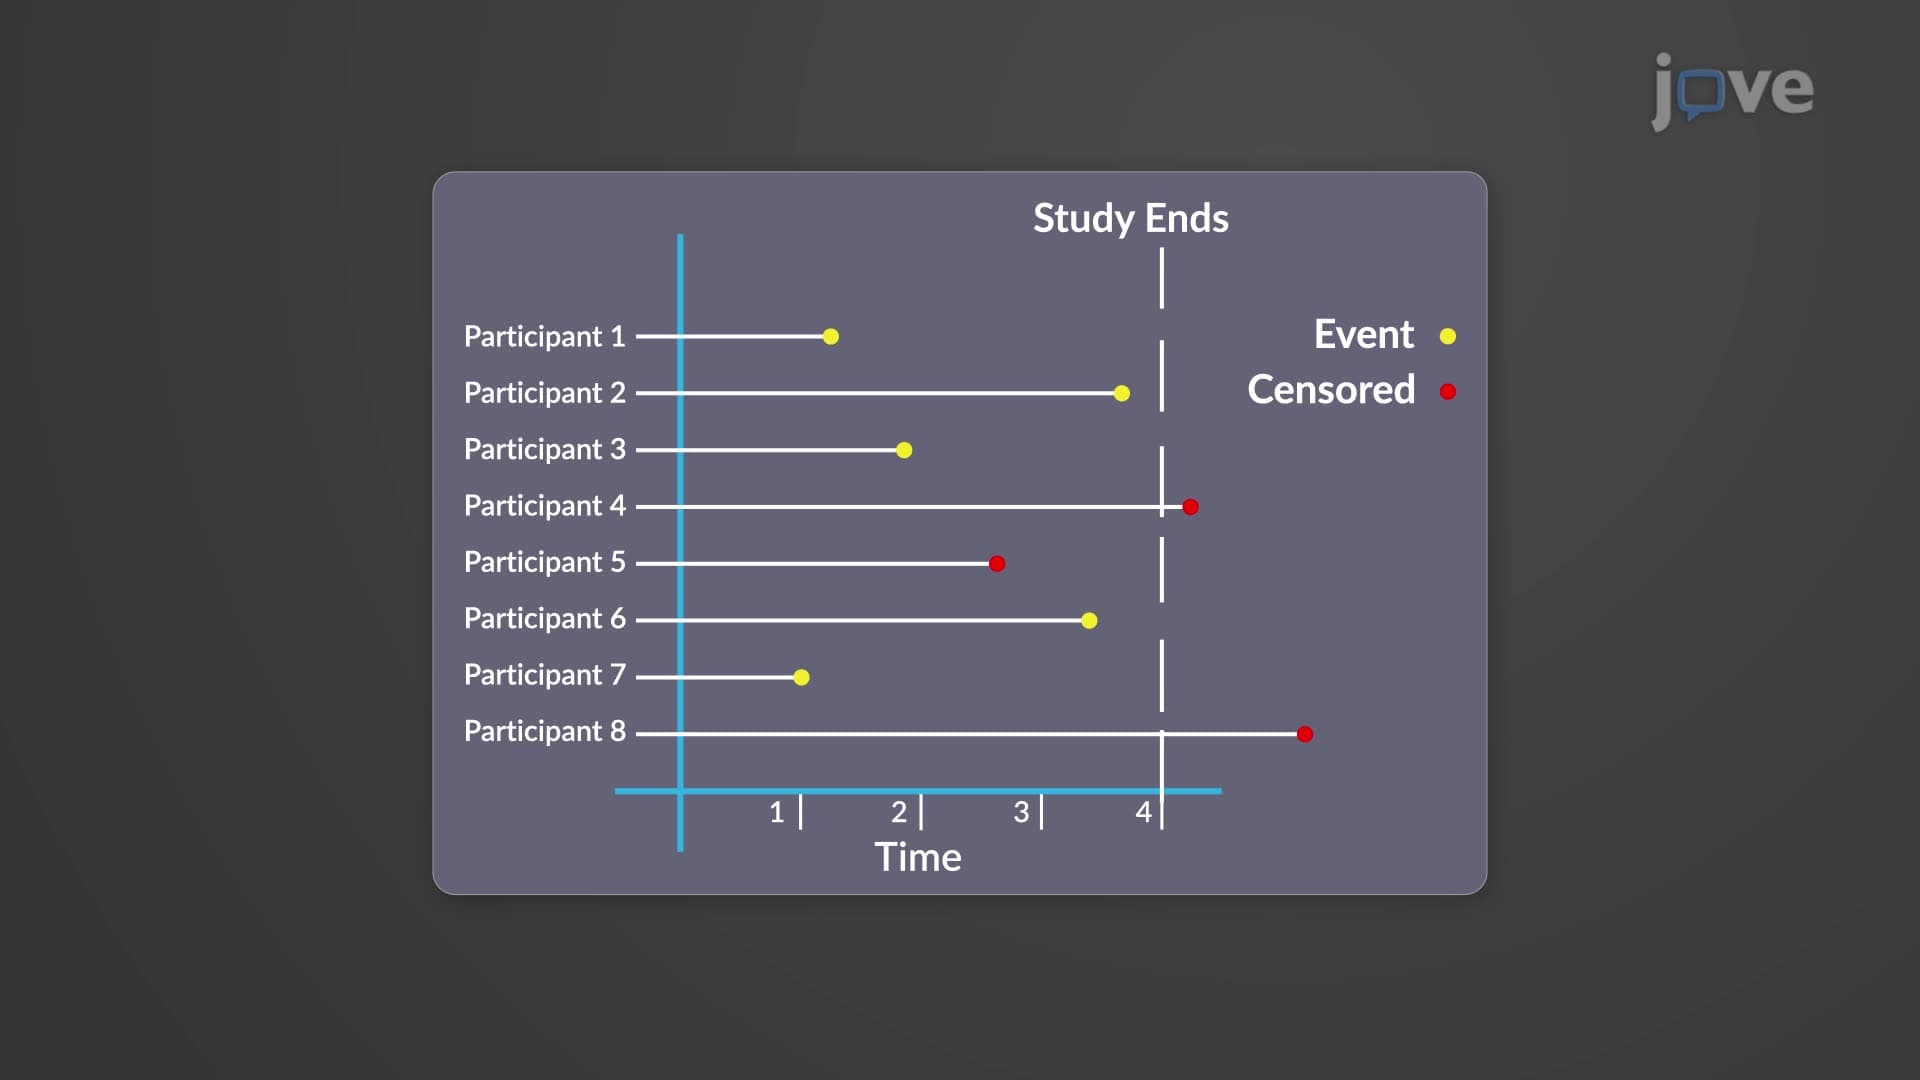
Each life table column contributes vital information for survival analysis. The second column records initial participant numbers at each interval's start, establishing the baseline population at risk. The third column documents deaths occurring during that specific interval, providing the numerator for mortality rate calculations. The fourth and fifth columns track participants lost to follow-up and those who withdrew alive, respectively-critical factors that could bias results if not properly accounted for.
The sixth column presents the "effective number exposed," a sophisticated adjustment that assumes withdrawals occur uniformly throughout each interval. This assumption leads to the practical rule of reducing the denominator by half when calculating risk, acknowledging that withdrawn participants were only exposed to risk for approximately half the interval period.
Life tables generate two fundamental probability types: conditional and cumulative. Conditional probabilities calculate the likelihood of death or survival within specific intervals, given that participants survived to that interval's beginning. These probabilities form the building blocks for more complex survival analyses used in clinical trials and epidemiological studies.
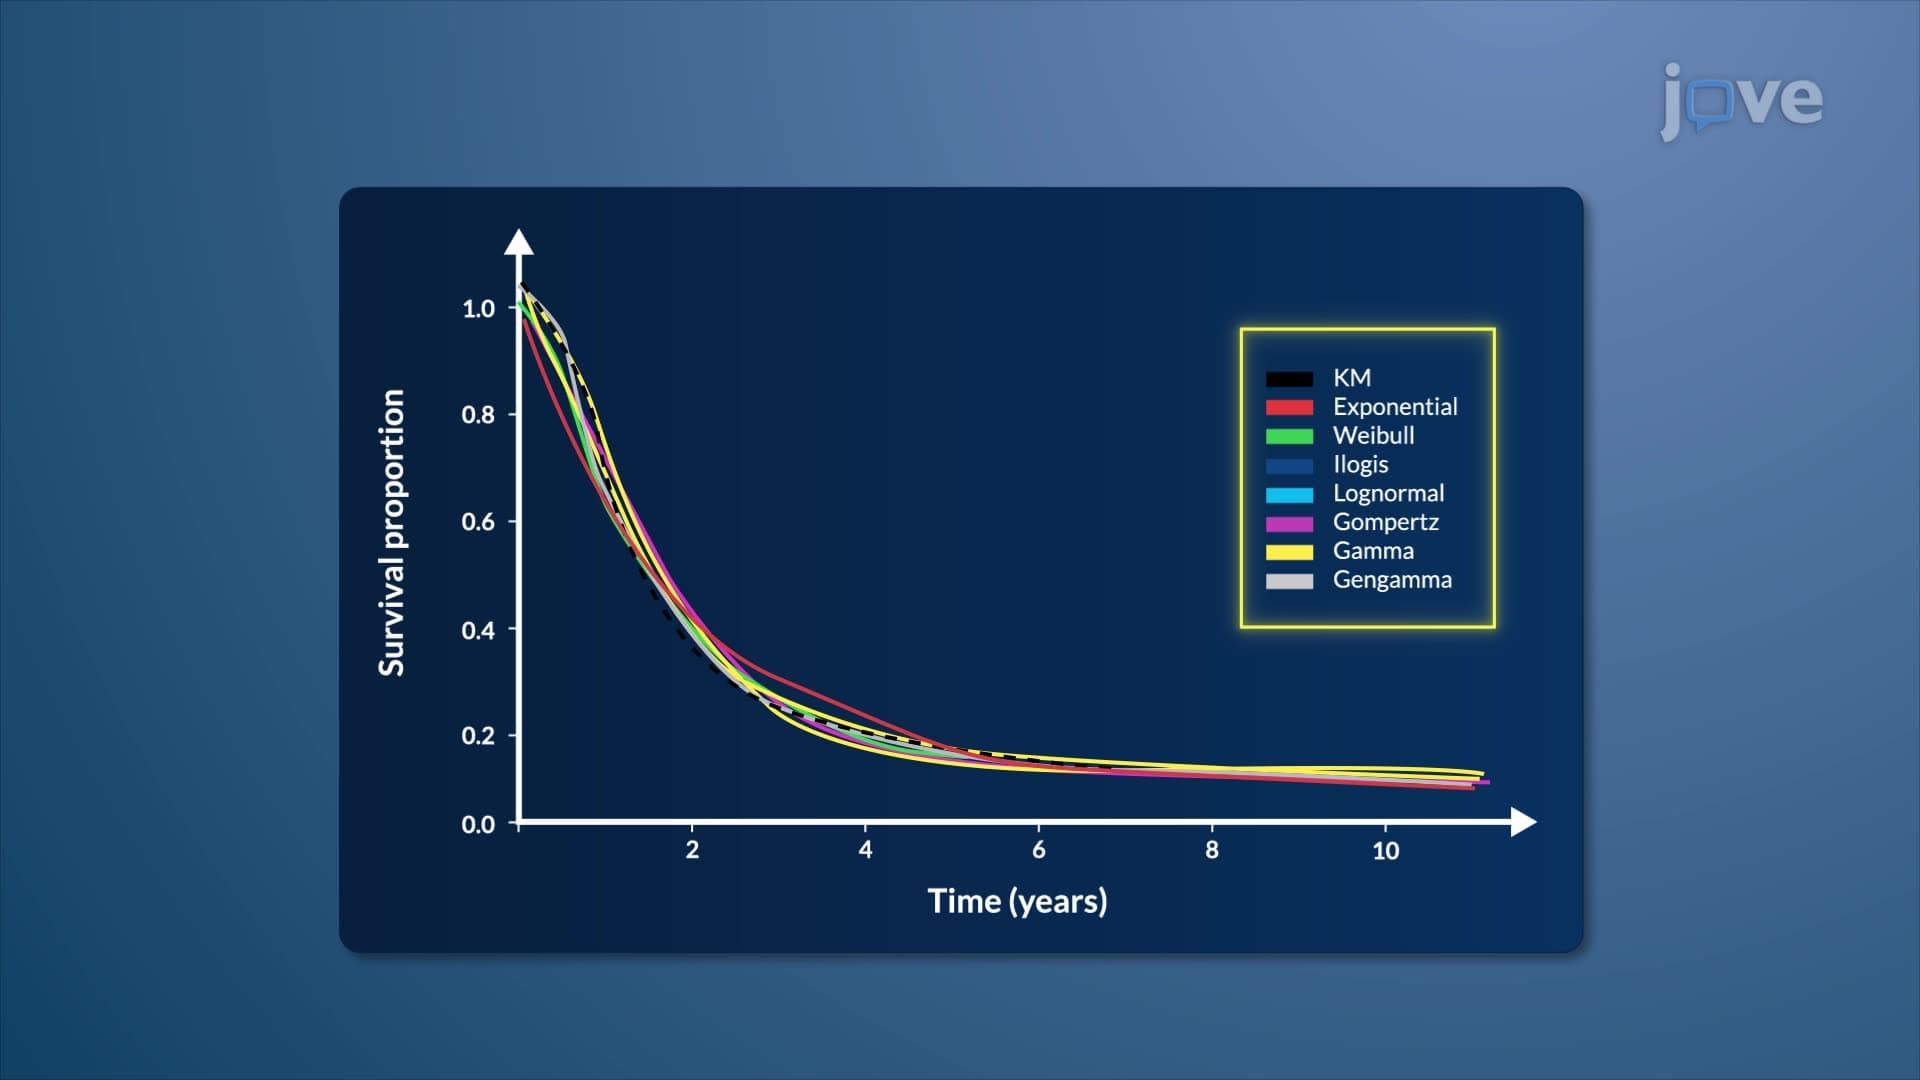
Cumulative survival rates, displayed in the final column, represent the probability of surviving from study initiation through each successive interval. These cumulative measures prove invaluable for long-term prognosis, treatment planning, and public health policy development.
Life tables extensively support American healthcare systems and research institutions. The National Center for Health Statistics uses life tables to calculate national life expectancy figures, while the American Cancer Society employs them for cancer survival statistics. Medical schools integrate life table concepts into epidemiology curricula, and the USMLE frequently tests these principles in clinical scenarios.
Insurance companies rely heavily on actuarial life tables for premium calculations, while pharmaceutical companies use survival analysis during FDA drug approval processes. Understanding life tables prepares students for careers in biostatistics, epidemiology, public health, and clinical research throughout American healthcare institutions.
Related Micro-courses