Loading video…


 16 Concepts
 6K views

Video Summary: What Is Cancer Survival Analysis
Did you know that cancer survival analysis helped prove that early breast cancer detection increases five-year survival rates from 85% to 99%? Cancer survival analysis is a statistical method that measures the time between cancer diagnosis and critical events like recurrence or death. This powerful tool guides treatment decisions at major US cancer centers like MD Anderson and Memorial Sloan Kettering, helping doctors evaluate new therapies and predict patient outcomes. What is cancer survival analysis becomes clearer when you see how it transforms raw patient data into life-saving insights. Watch the full video on JoVE Coach to master this concept with expert-led visuals and step-by-step explanations.
Cancer survival analysis represents one of medicine's most critical statistical tools, measuring the duration between cancer diagnosis or treatment initiation and specific outcomes like disease recurrence, metastasis, or death. Unlike traditional statistical methods that analyze fixed outcomes, survival analysis accounts for time-dependent events and incomplete data-essential features when studying diseases that unfold over months or years.
This methodology emerged from the urgent need to evaluate cancer treatments objectively. When the National Cancer Institute began systematic clinical trials in the 1960s, researchers needed robust methods to compare treatment effectiveness across different patient populations and time periods. Today, every FDA cancer drug approval relies heavily on survival analysis data.
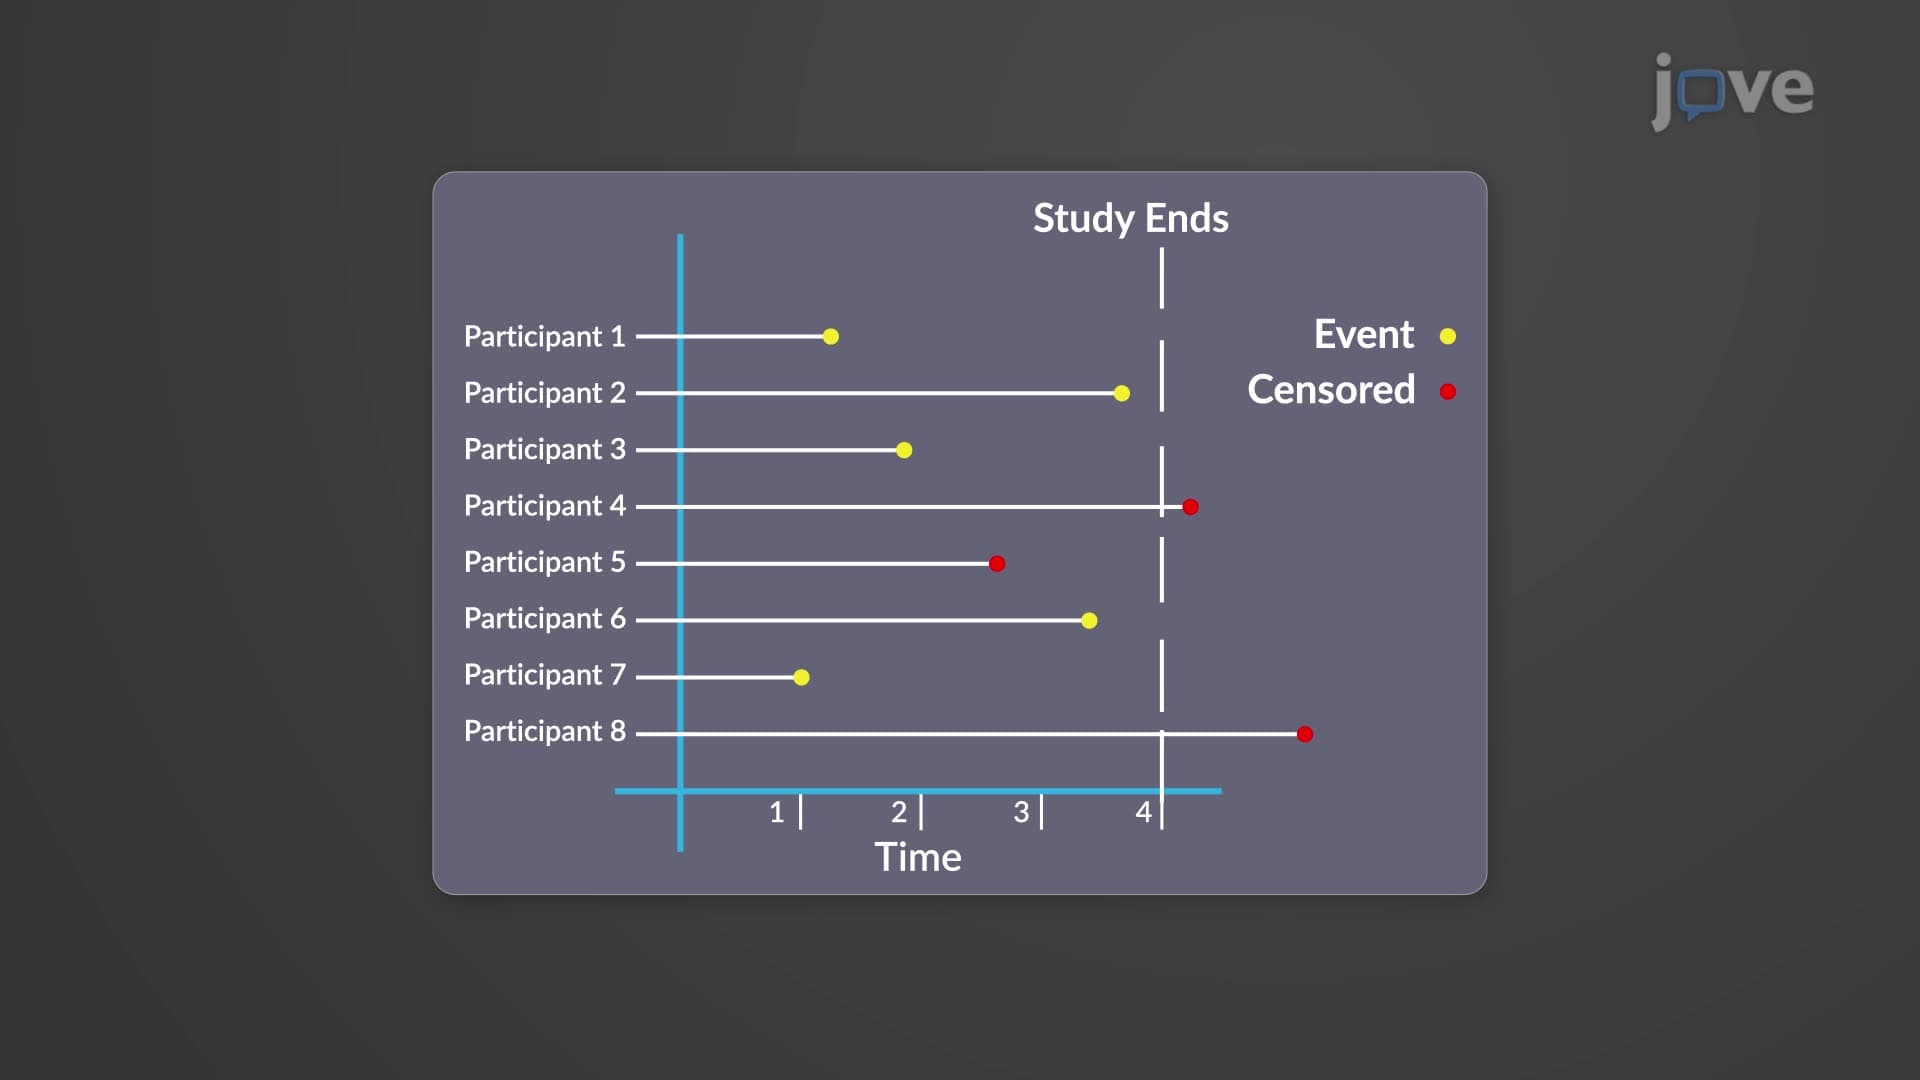
The cancer survival analysis definition encompasses several key elements that distinguish it from other statistical approaches. First, it measures "time-to-event" rather than simple yes/no outcomes. Second, it handles "censored" data-information about patients who drop out of studies, move away, or whose studies end before experiencing the target event.
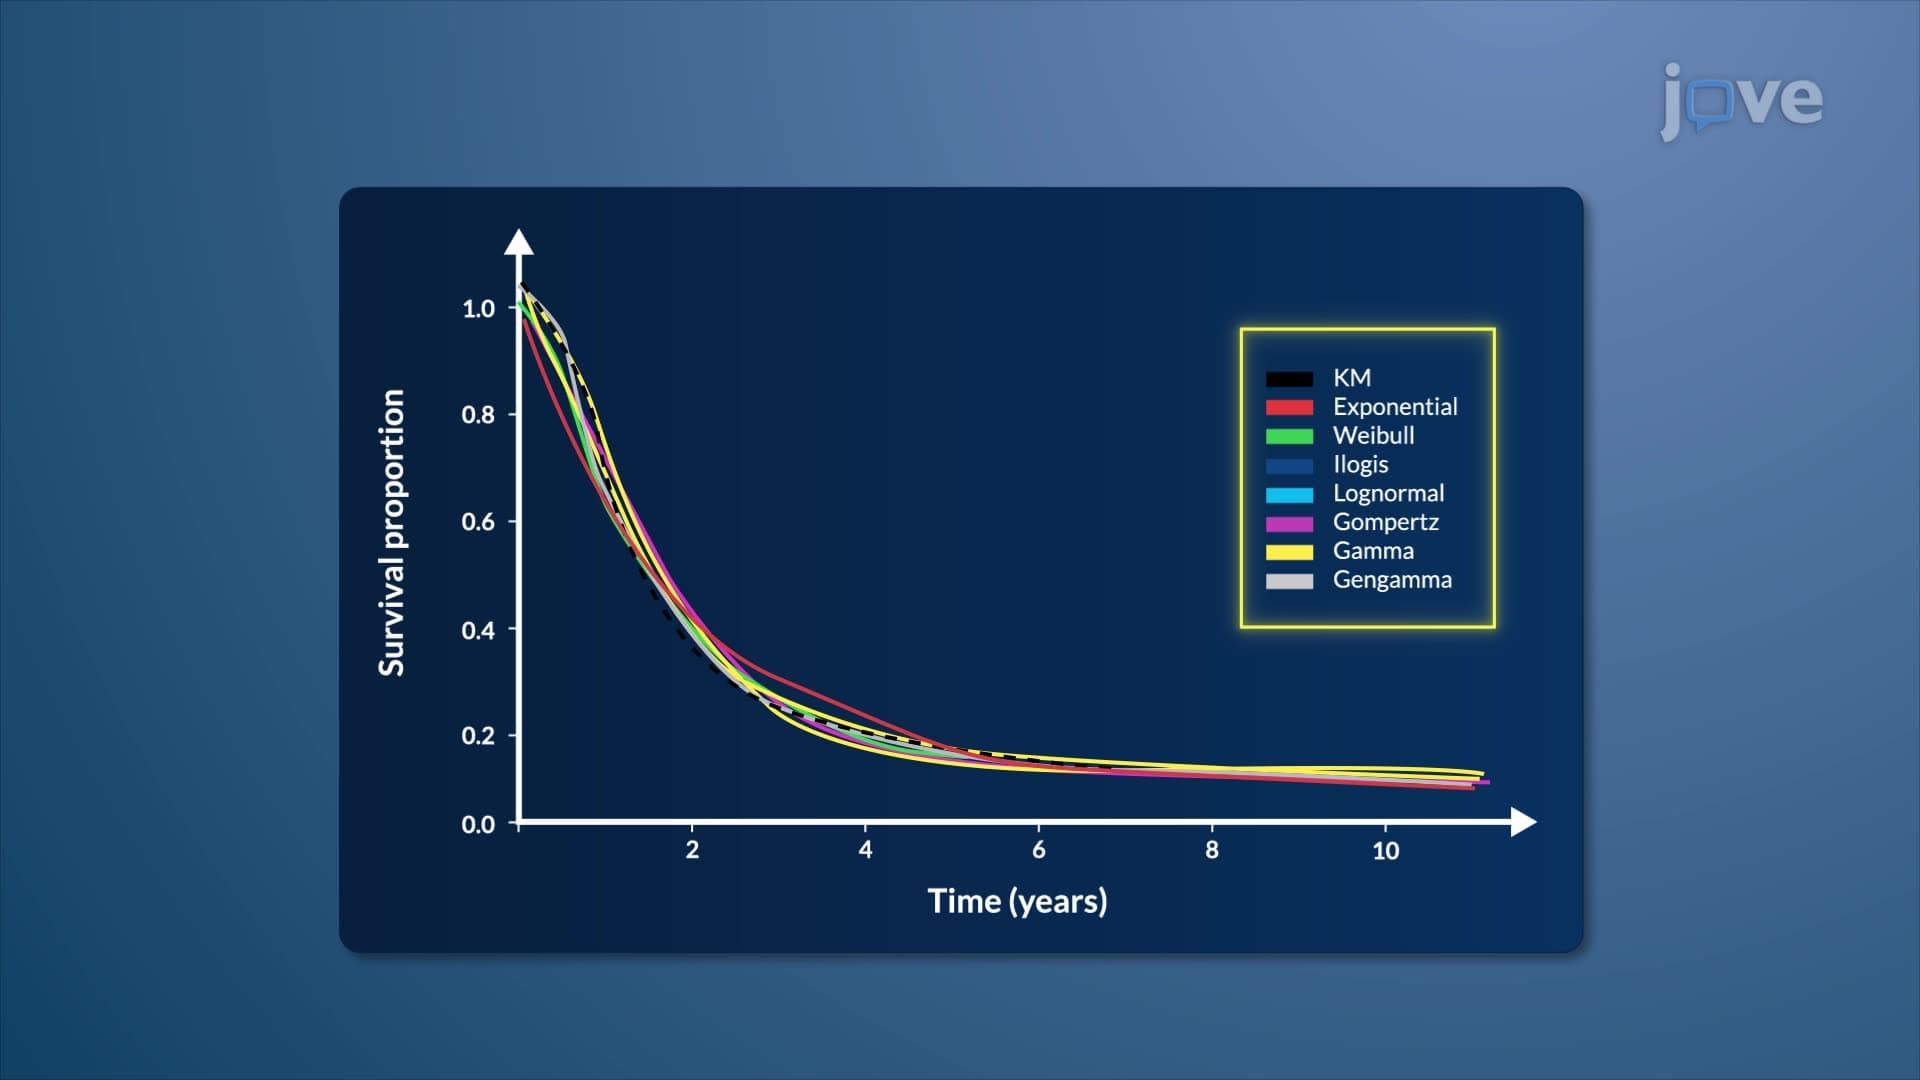
The most fundamental tool is the Kaplan-Meier estimator, which creates step-like survival curves showing the probability of survival at any given time point. These curves appear in virtually every cancer research paper and clinical trial report. For example, when Johns Hopkins researchers studied pancreatic cancer treatments, their Kaplan-Meier curves revealed that combination therapy improved median survival from 6.2 to 11.1 months-a finding that changed treatment protocols nationwide.
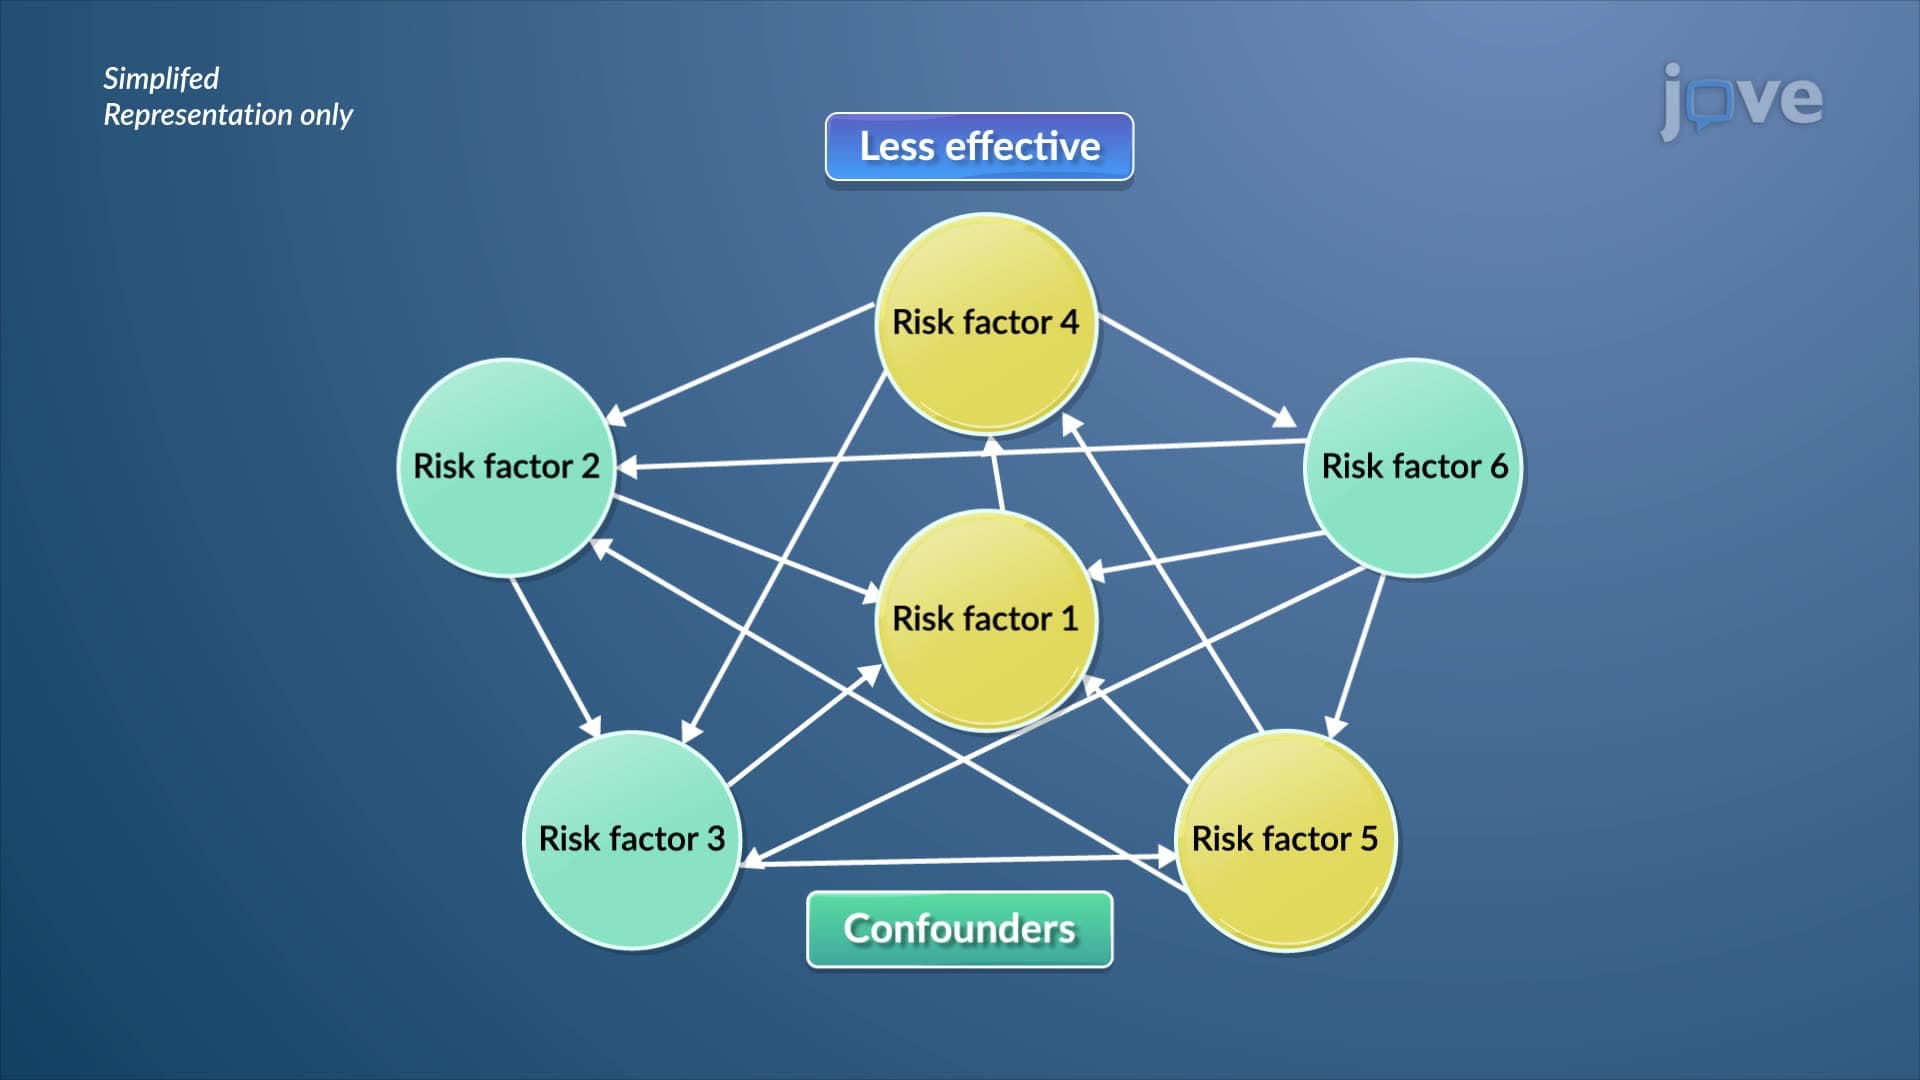
Cox regression models add another layer of sophistication by adjusting for multiple risk factors simultaneously. While Kaplan-Meier curves show raw survival patterns, Cox models can determine whether age, tumor stage, or genetic markers independently influence survival, even when controlling for other variables.
What is cancer survival analysis in detail becomes clearer through concrete examples from American medical institutions. At Stanford Cancer Institute, researchers used survival analysis to demonstrate that immunotherapy combinations significantly improved outcomes in melanoma patients, leading to new treatment guidelines. The analysis revealed that patients receiving the combination therapy had a 42% lower risk of disease progression compared to standard treatment.
Similarly, the Women's Health Initiative used survival analysis to evaluate hormone replacement therapy's cancer risks, discovering increased breast cancer rates that prompted nationwide policy changes. This study exemplifies how survival analysis informs not just individual treatment decisions but public health recommendations affecting millions of Americans.
For students preparing for the MCAT or college-level biostatistics courses, understanding these applications proves crucial. AP Statistics students often encounter simplified survival analysis problems, while pre-med students must grasp how these concepts apply to evidence-based medicine and clinical decision-making.
Related Micro-courses