Loading video…


 16 Concepts
 6K views

Video Summary: Parametric Survival Analysis Weibull and Exponential Models
Did you know that the same mathematical models used to predict when medical devices fail are also used to analyze patient survival rates in clinical trials? Parametric survival analysis: Weibull and exponential models provide powerful statistical tools for understanding time-to-event data across healthcare and engineering applications. The FDA regularly uses these models to evaluate medical device reliability and drug efficacy in clinical studies, helping determine whether new treatments extend patient survival compared to existing therapies. Watch the full video on JoVE Coach to master this concept with expert-led visuals and step-by-step explanations.
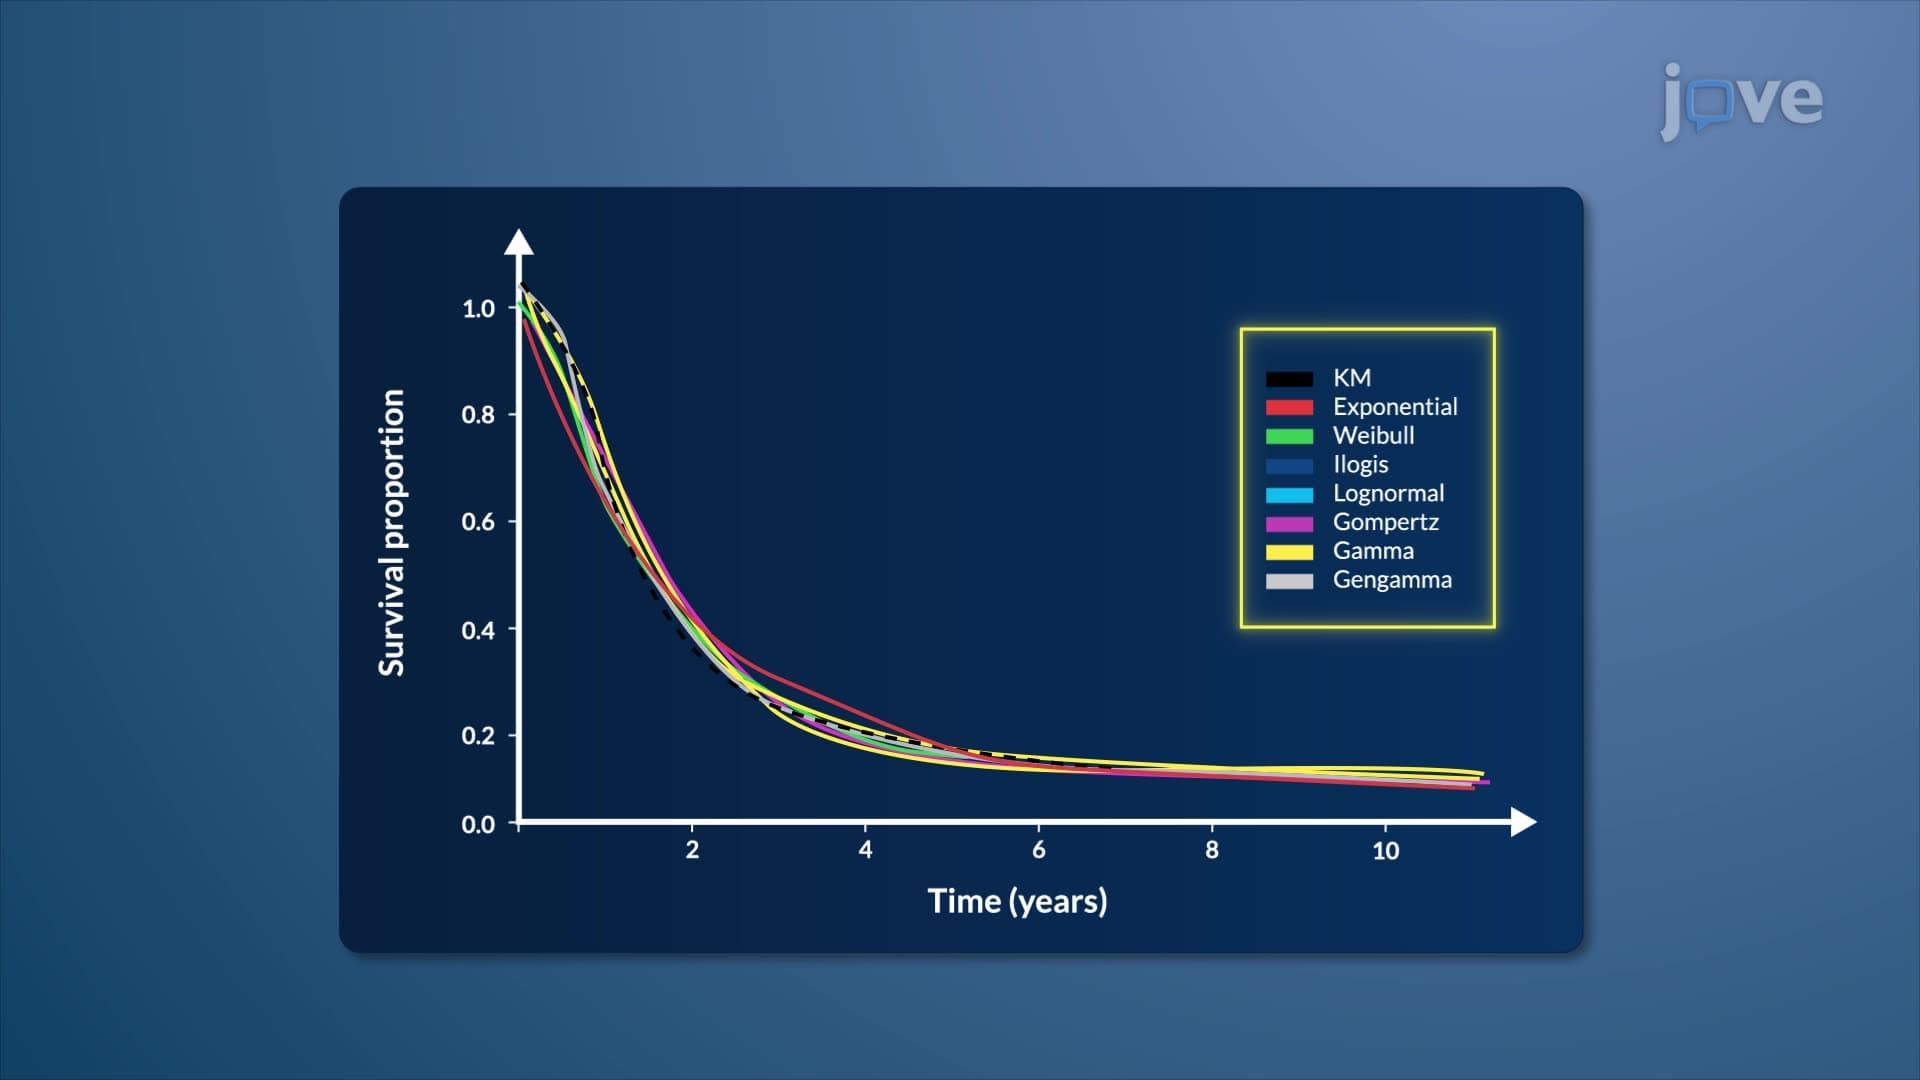
Parametric survival analysis: Weibull and exponential models form the foundation of time-to-event statistical analysis, providing researchers with powerful tools to model and predict survival times across diverse fields. Unlike non-parametric methods, these parametric approaches assume specific probability distributions, offering greater statistical power when the underlying assumptions are met.
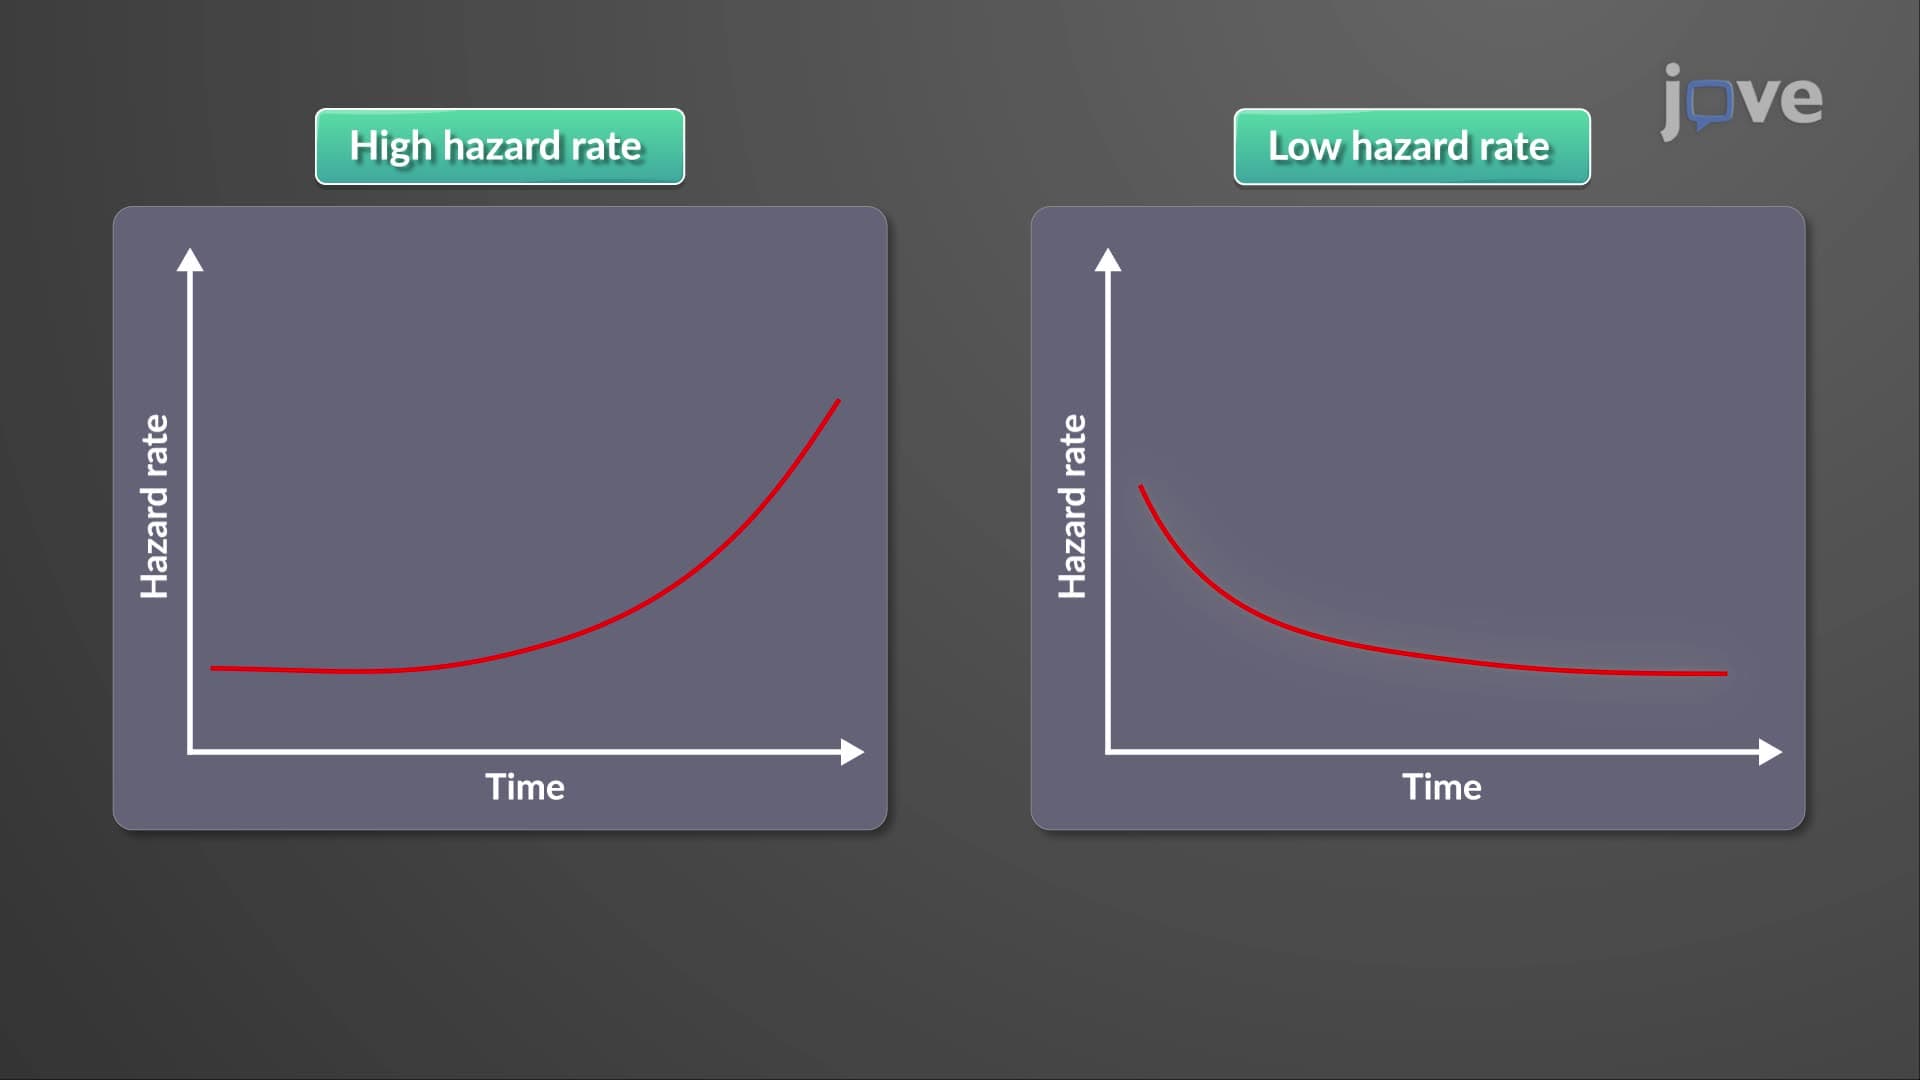
The two-parameter Weibull distribution excels in modeling various hazard patterns through its shape parameter beta (β). When β > 1, the hazard rate increases over time, reflecting scenarios like cancer progression where risk accelerates. The National Cancer Institute frequently employs this pattern when analyzing late-stage tumor growth data. Conversely, β < 1 indicates decreasing hazard rates, common in pediatric medicine where early intervention reduces long-term complications. This flexibility makes Weibull models invaluable for FDA drug approval processes, where understanding changing risk profiles determines treatment protocols.
When β equals exactly 1, the Weibull distribution simplifies to the exponential model, characterized by constant hazard rates. While human populations rarely maintain truly constant risk over decades, this assumption proves reasonable for shorter study periods of 5-10 years. The CDC uses exponential models in epidemiological studies tracking disease outbreaks, where transmission rates remain relatively stable over limited timeframes. College biostatistics courses emphasize this model's mathematical elegance and computational simplicity, making it ideal for introductory survival analysis.
Determining model appropriateness involves logarithmic survival curve analysis. If log S(t) versus time produces a straight line, the exponential model fits well, with the slope representing the hazard rate. This graphical approach appears frequently in AP Statistics and college-level biostatistics exams. Johns Hopkins School of Public Health teaches students to recognize these patterns when analyzing clinical trial data, particularly in cardiovascular research where treatment effects often remain constant over study periods.
Modern statistical software like R and SAS automatically generate these diagnostic plots, enabling researchers at institutions like the Mayo Clinic to quickly assess model validity. Understanding both models prepares students for advanced coursework in biostatistics, reliability engineering, and health economics, where survival analysis drives critical decision-making in healthcare policy and medical device development.
Related Micro-courses