Loading concepts…


15 Concepts
15 Concepts
13 Concepts
11 Concepts
9 Concepts
14 Concepts
11 Concepts
15 Concepts
13 Concepts
7 Concepts
10 Concepts
10 Concepts
22 Concepts
19 Concepts
16 Concepts
16 Concepts
7 Concepts
 15 Concepts
 340.6K Views
 Popular topics




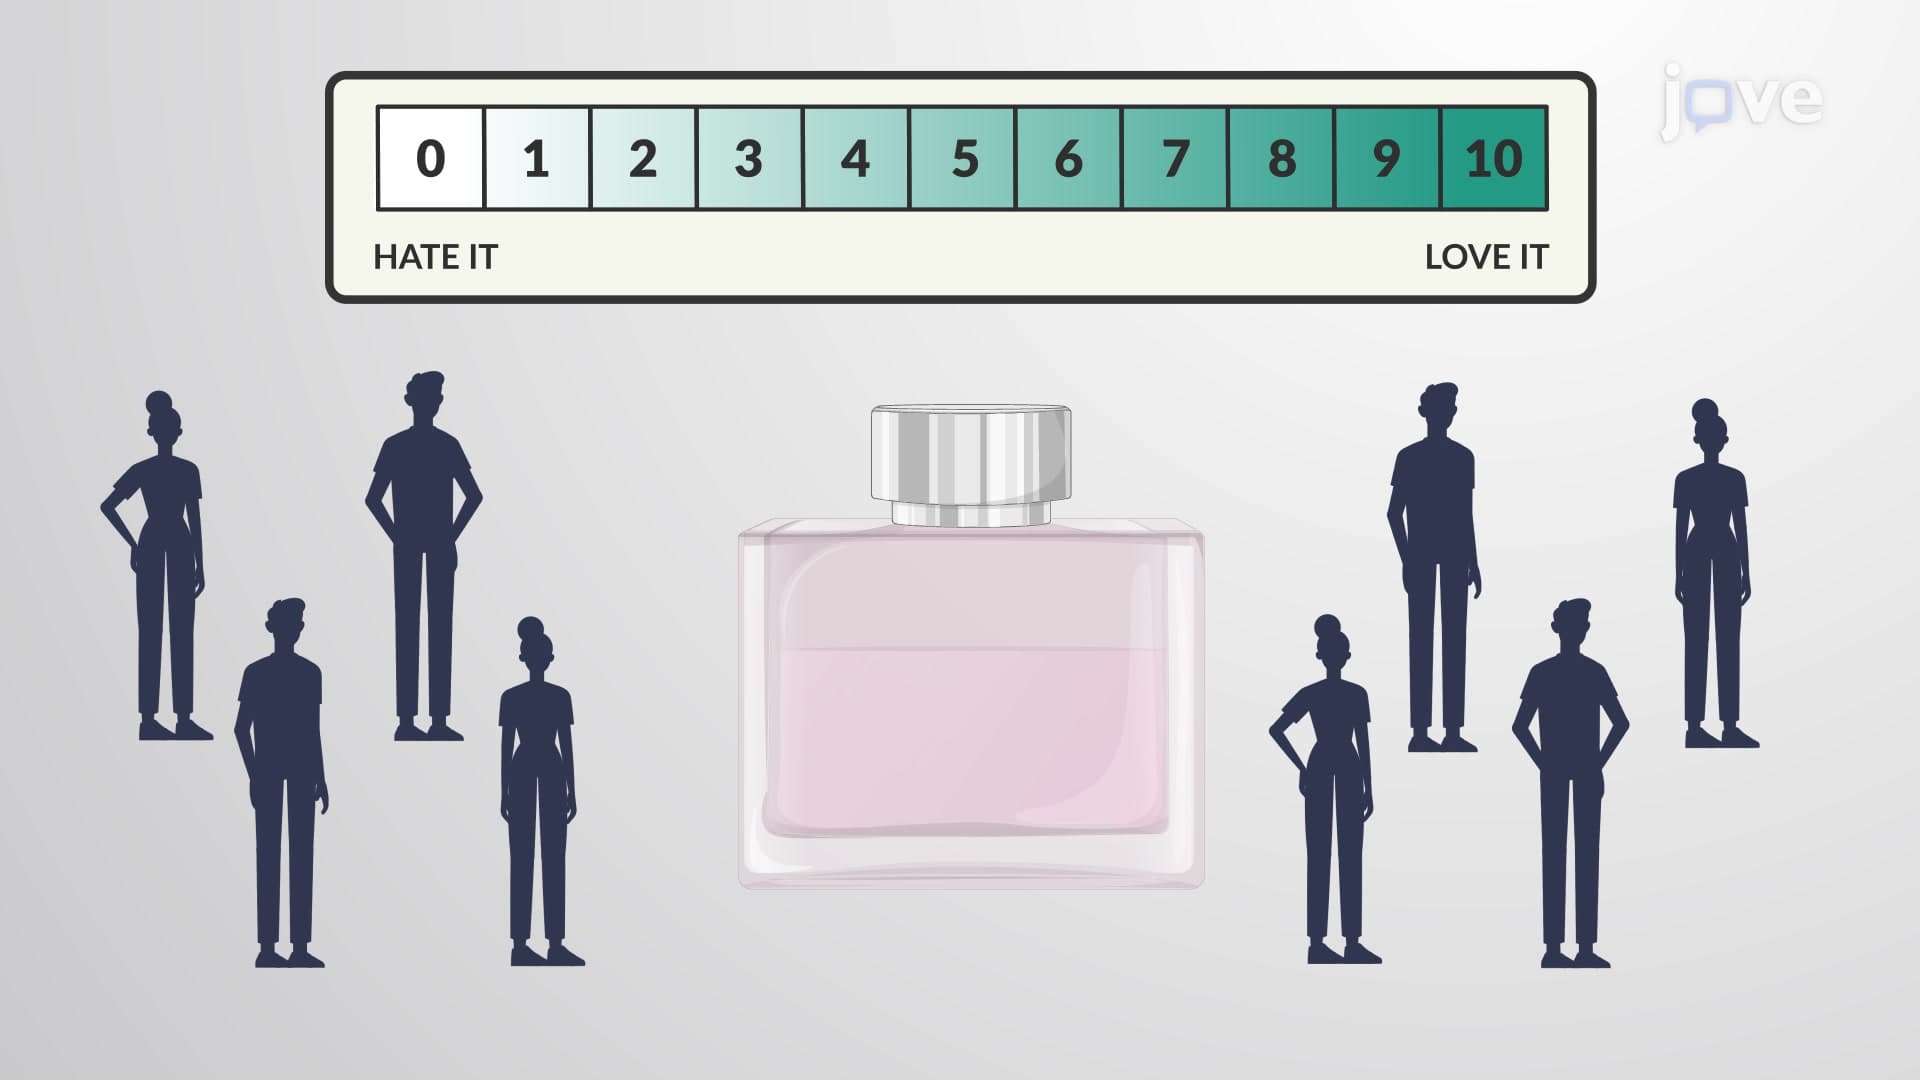



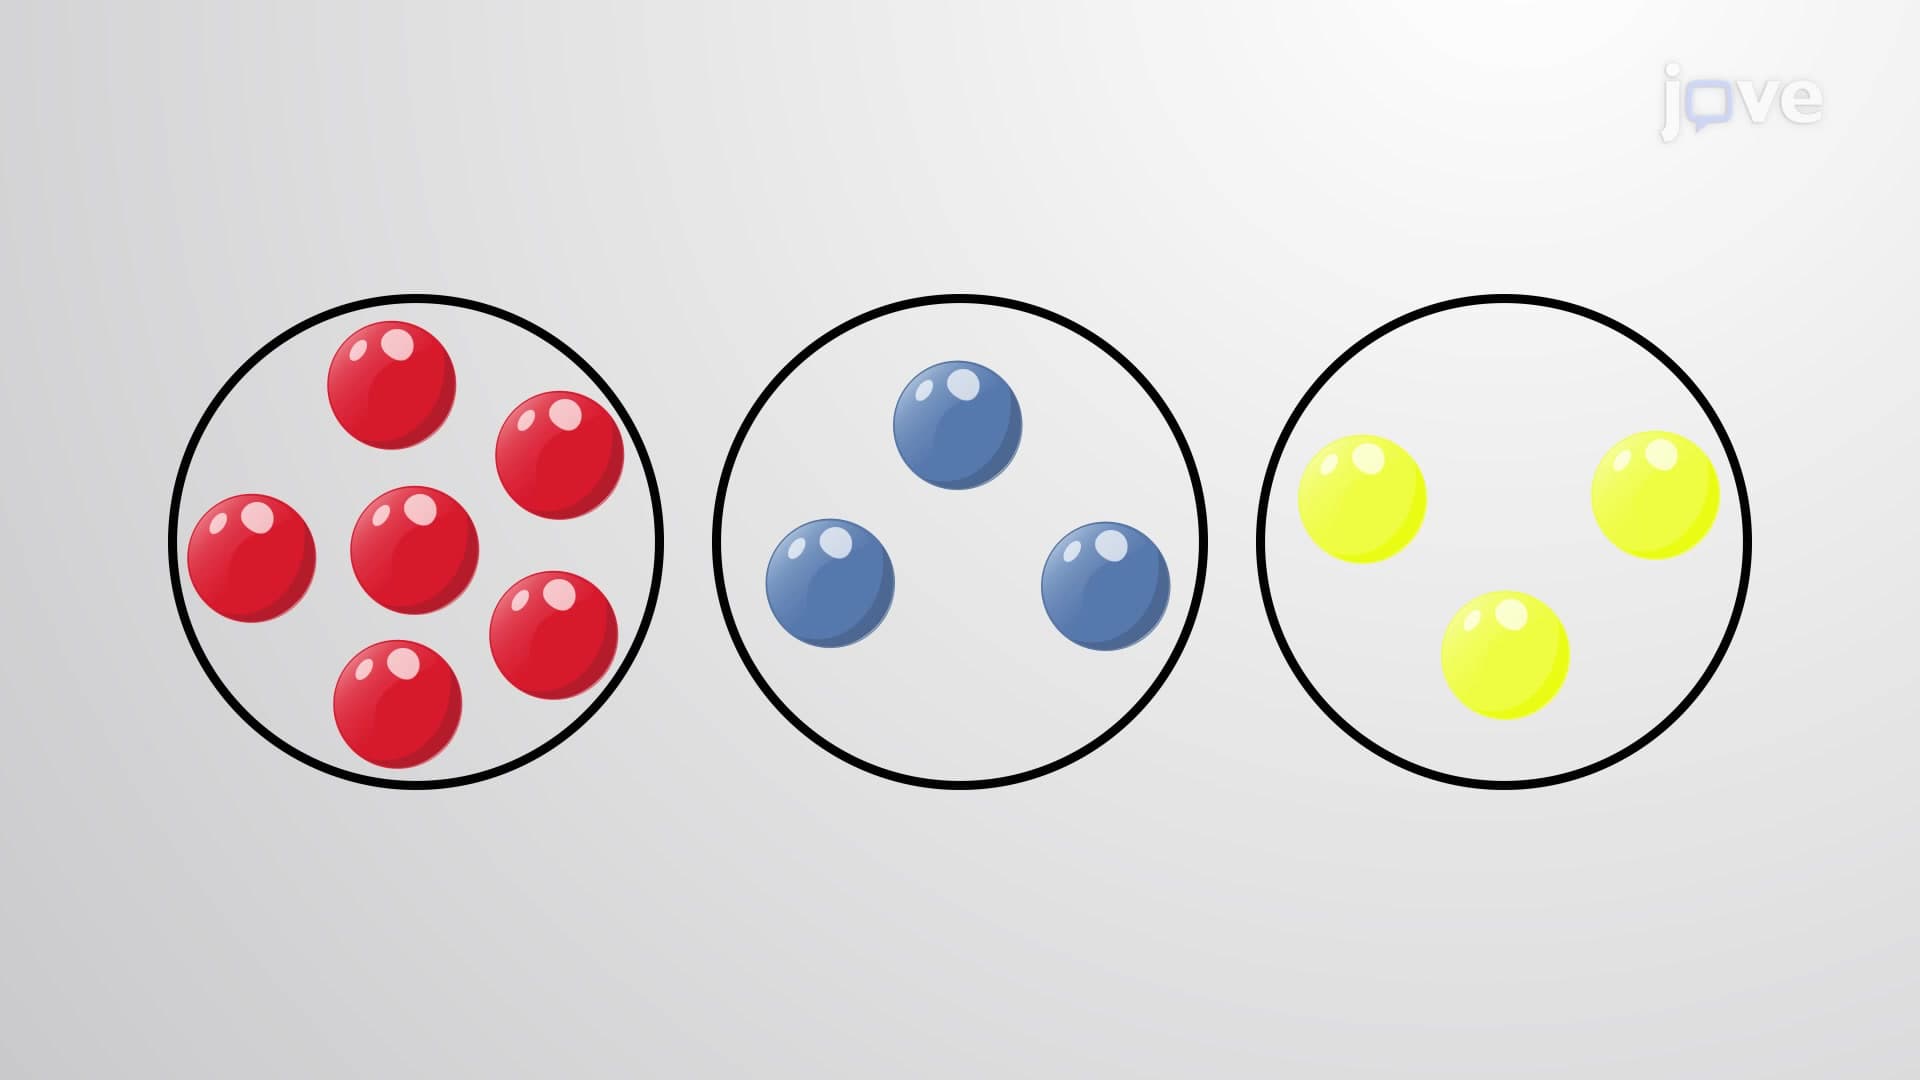
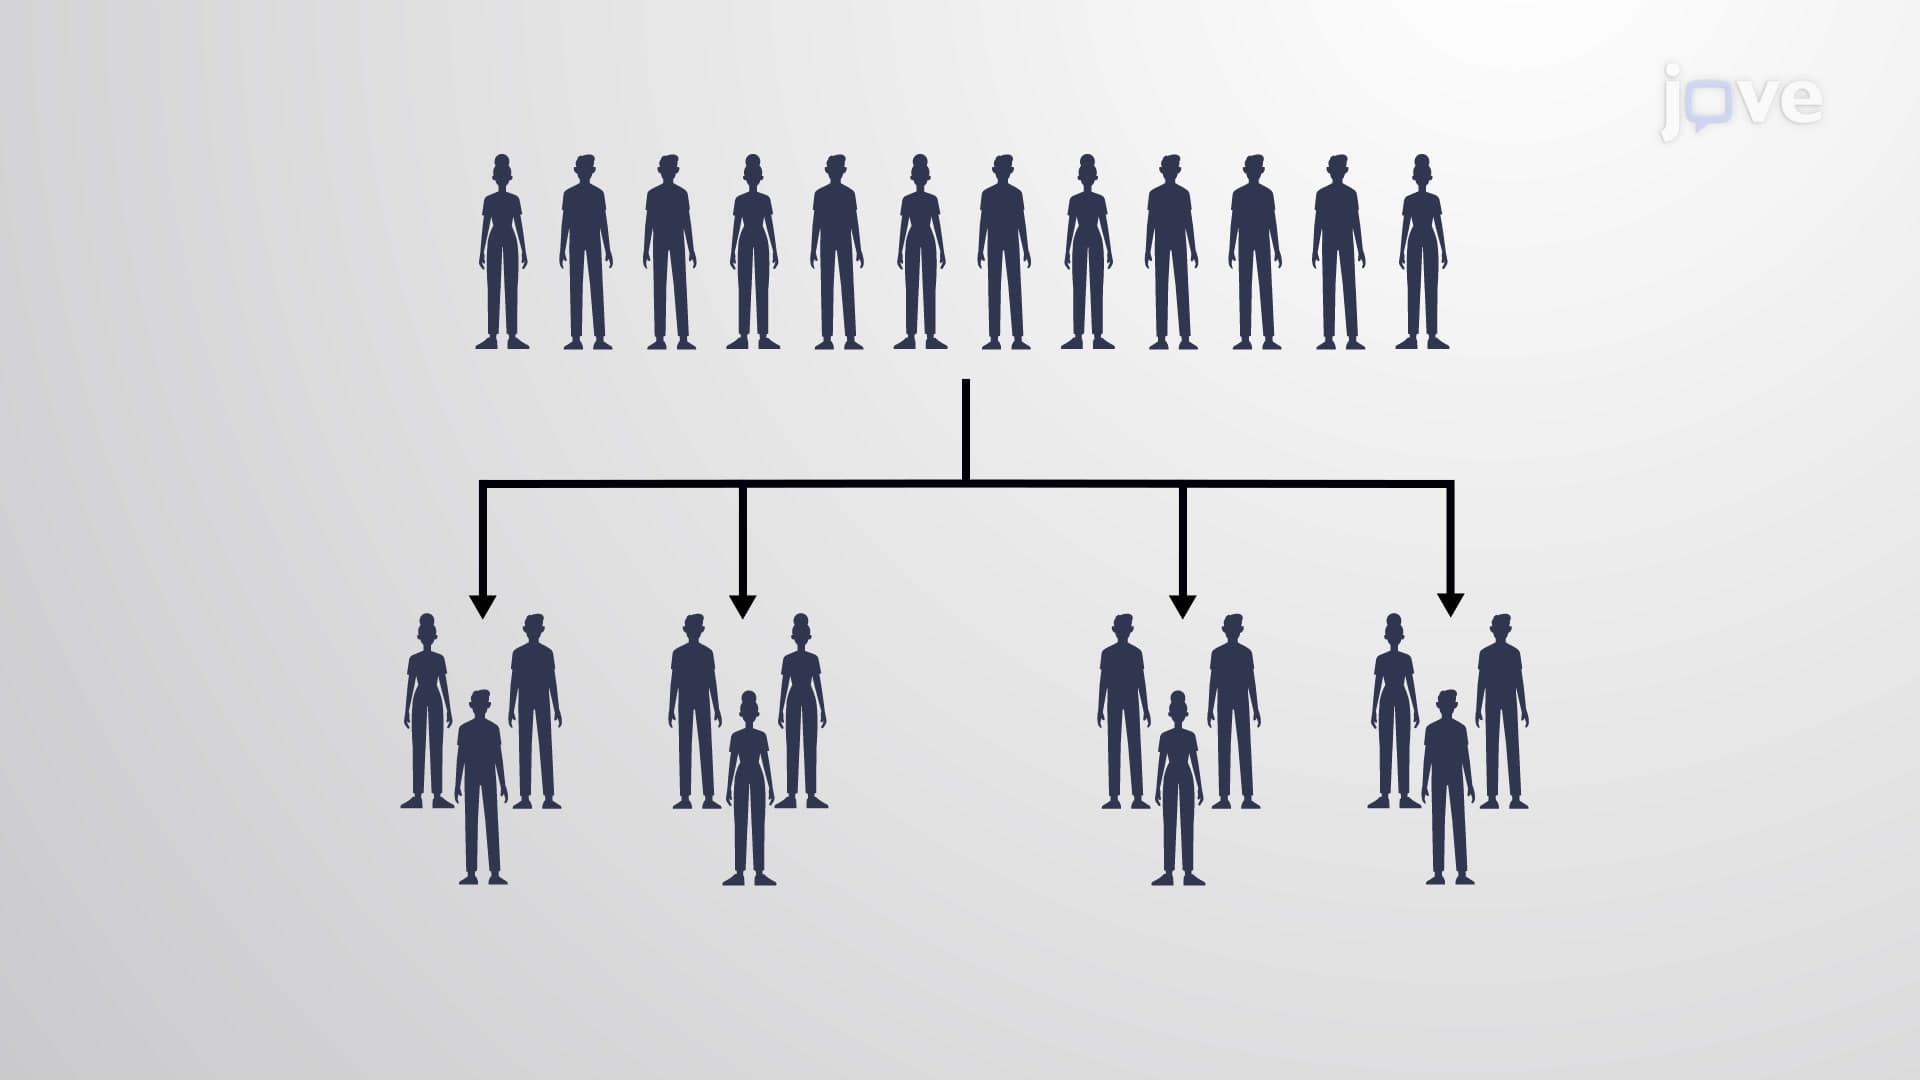
Understanding statistics begins with mastering the fundamental concepts of data collection, classification, and analysis. This comprehensive introduction covers descriptive and inferential statistics, data types (categorical and numerical), measurement levels, and essential sampling methods used in real-world applications. Students will explore how statistical thinking applies to everything from U.S. Census data to clinical trials, building a solid foundation with JoVE Coach for advanced quantitative analysis in academic and professional settings.
1. Fundamental Statistical Framework: Statistics serves as the science of collecting, organizing, and extracting meaningful information from data. The distinction between population (all individuals being studied) and sample (subset of the population) forms the foundation of statistical analysis. Understanding parameters (population characteristics) versus statistics (sample measurements) enables proper interpretation of research findings. For example, when the U.S. Census Bureau surveys American households, they use sample data to estimate national population characteristics like median income or educational attainment levels.
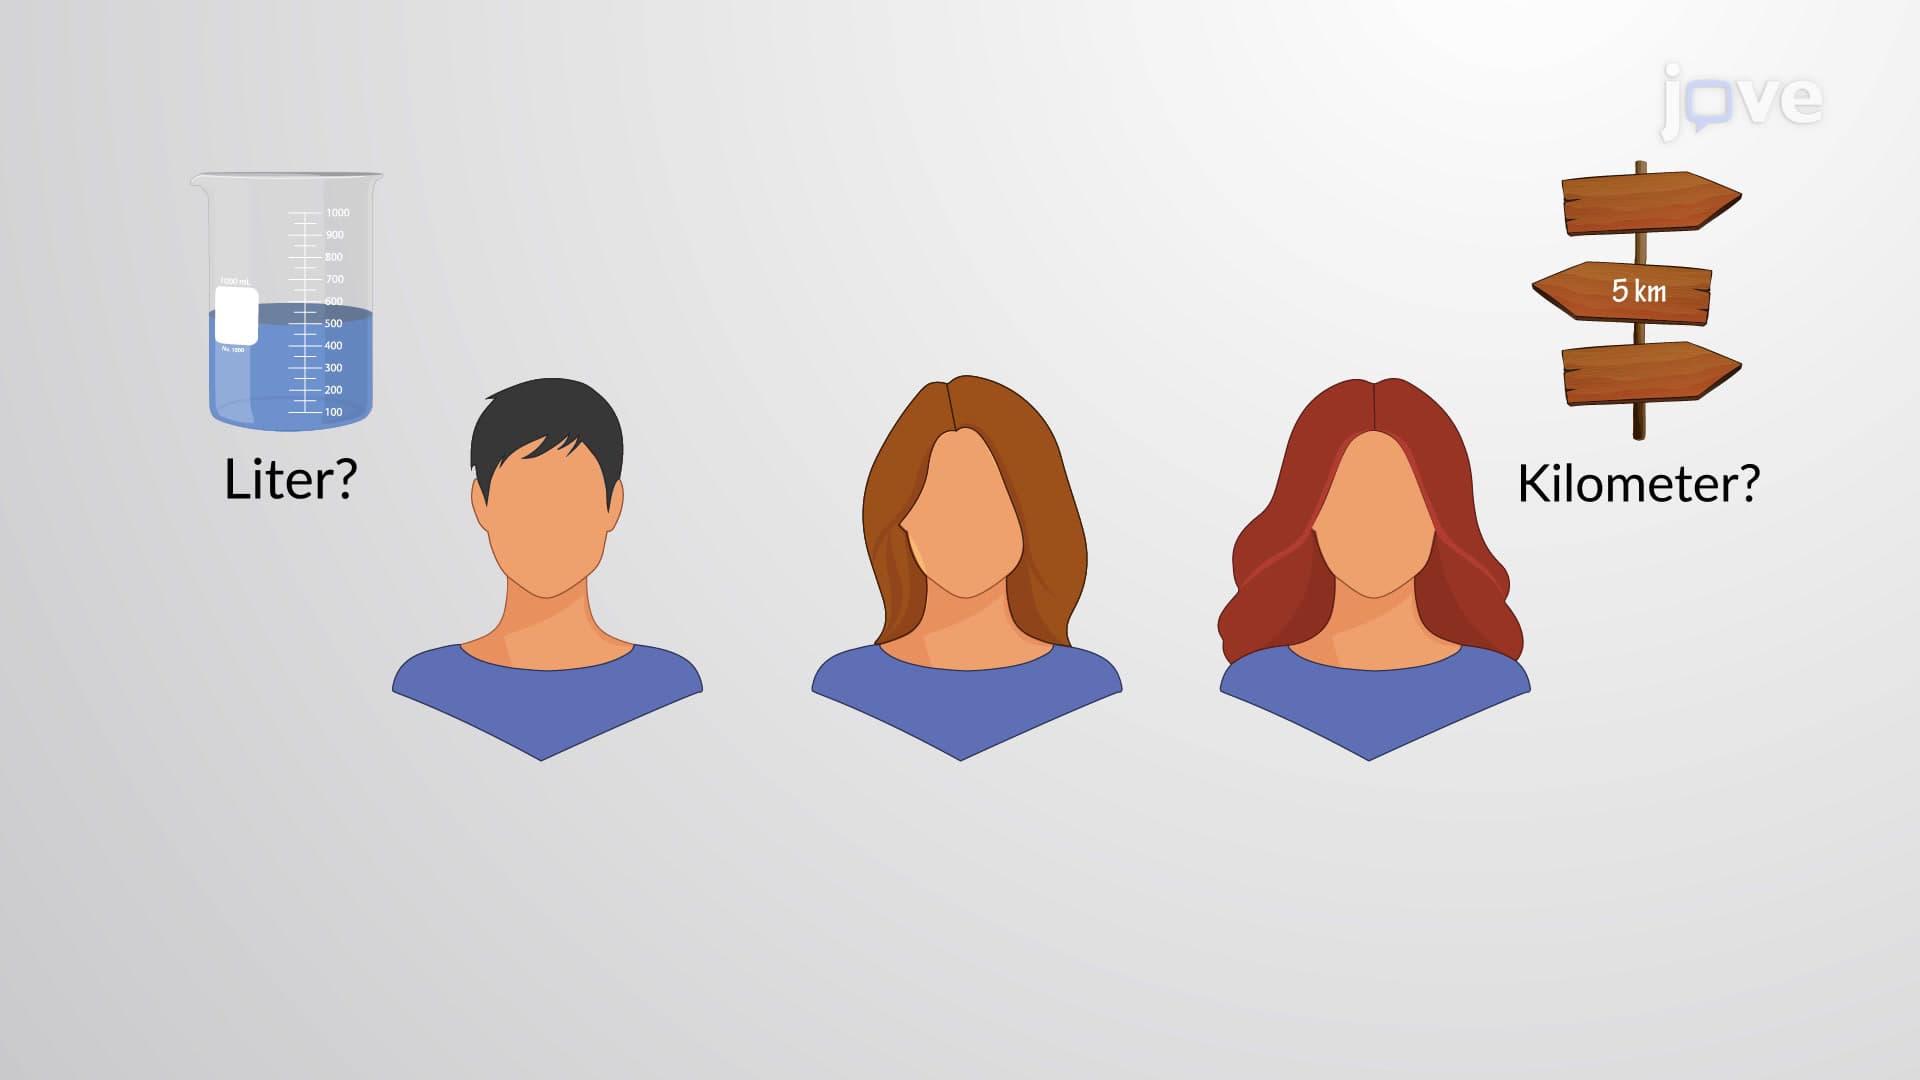
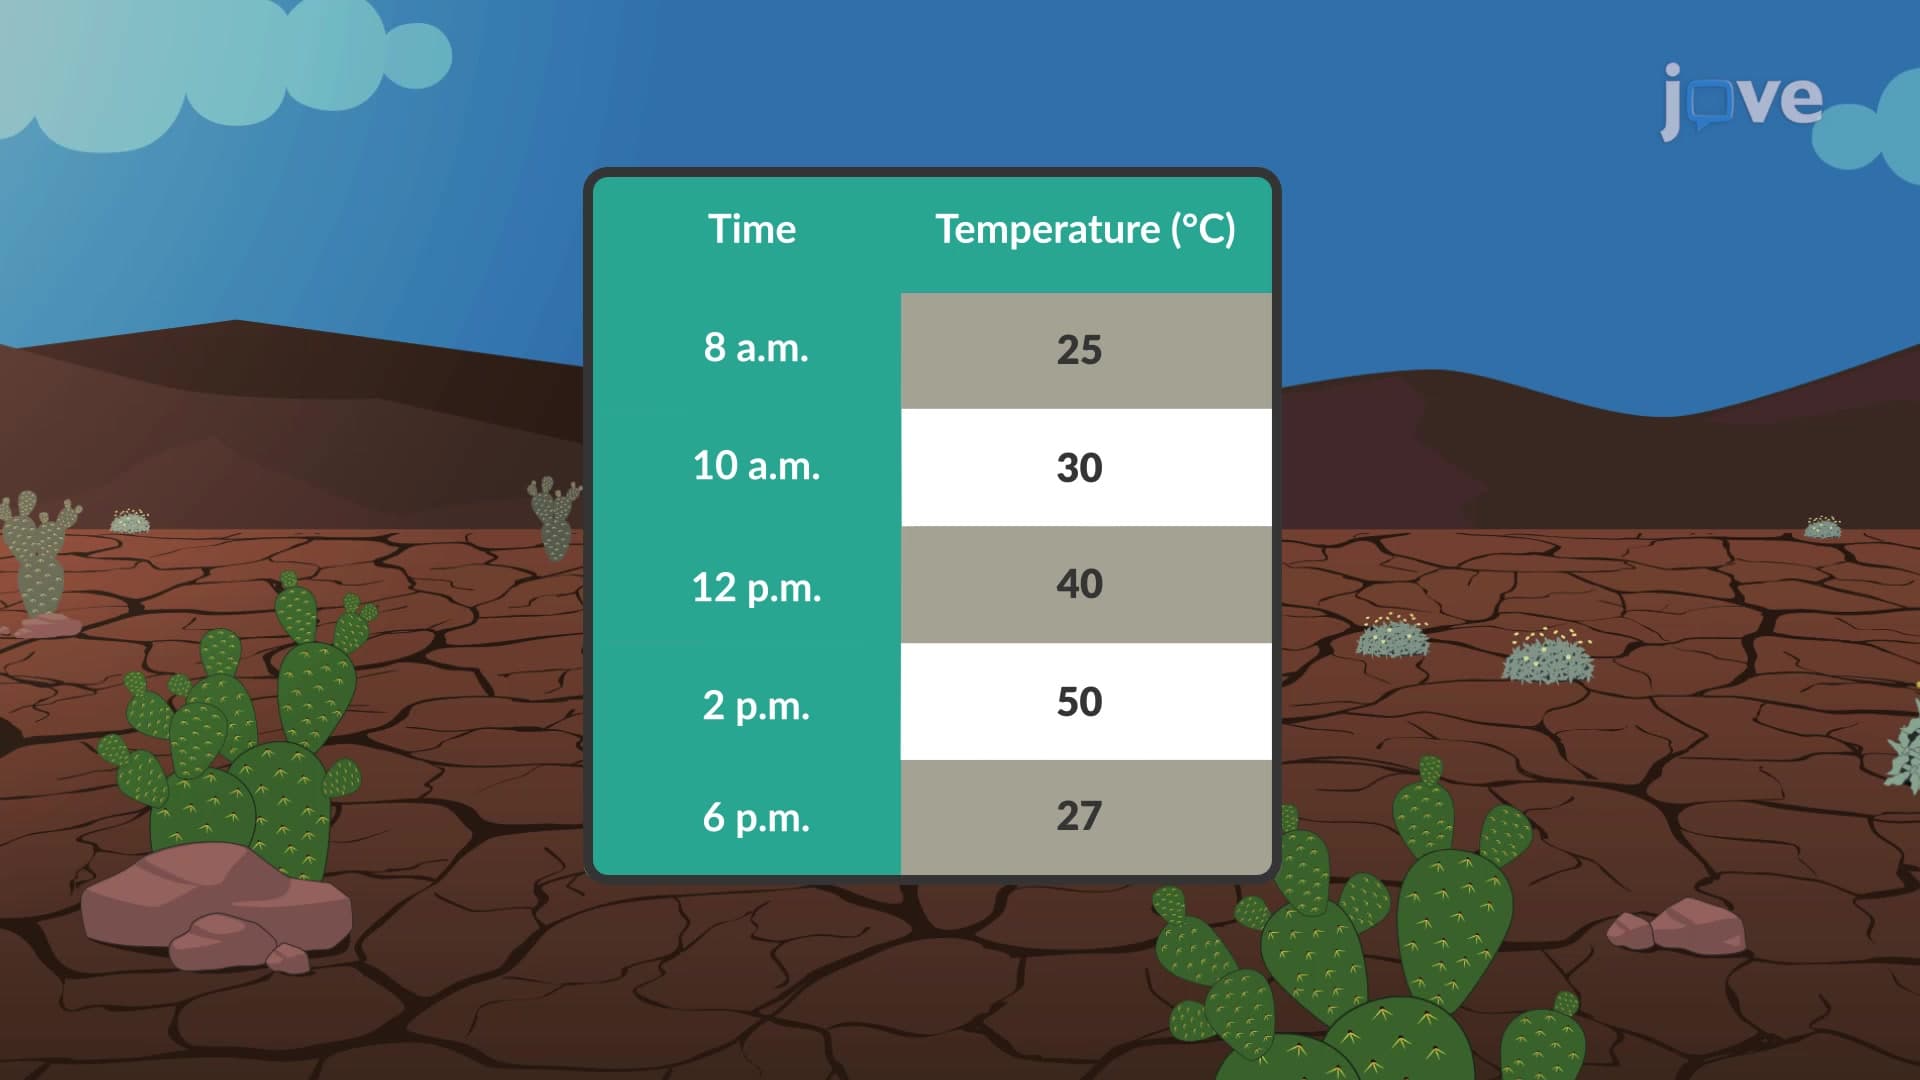
2. Data Classification Systems: Data classification into categorical (qualitative) and numerical (quantitative) types determines appropriate analytical approaches. Categorical data includes examples like political party affiliation in U.S. elections or blood types in medical records, which cannot be measured but can be grouped into distinct categories. Numerical data encompasses countable discrete values (number of students in American universities) and continuous measurements (temperatures recorded by National Weather Service stations). This classification directly impacts statistical method selection and interpretation strategies.
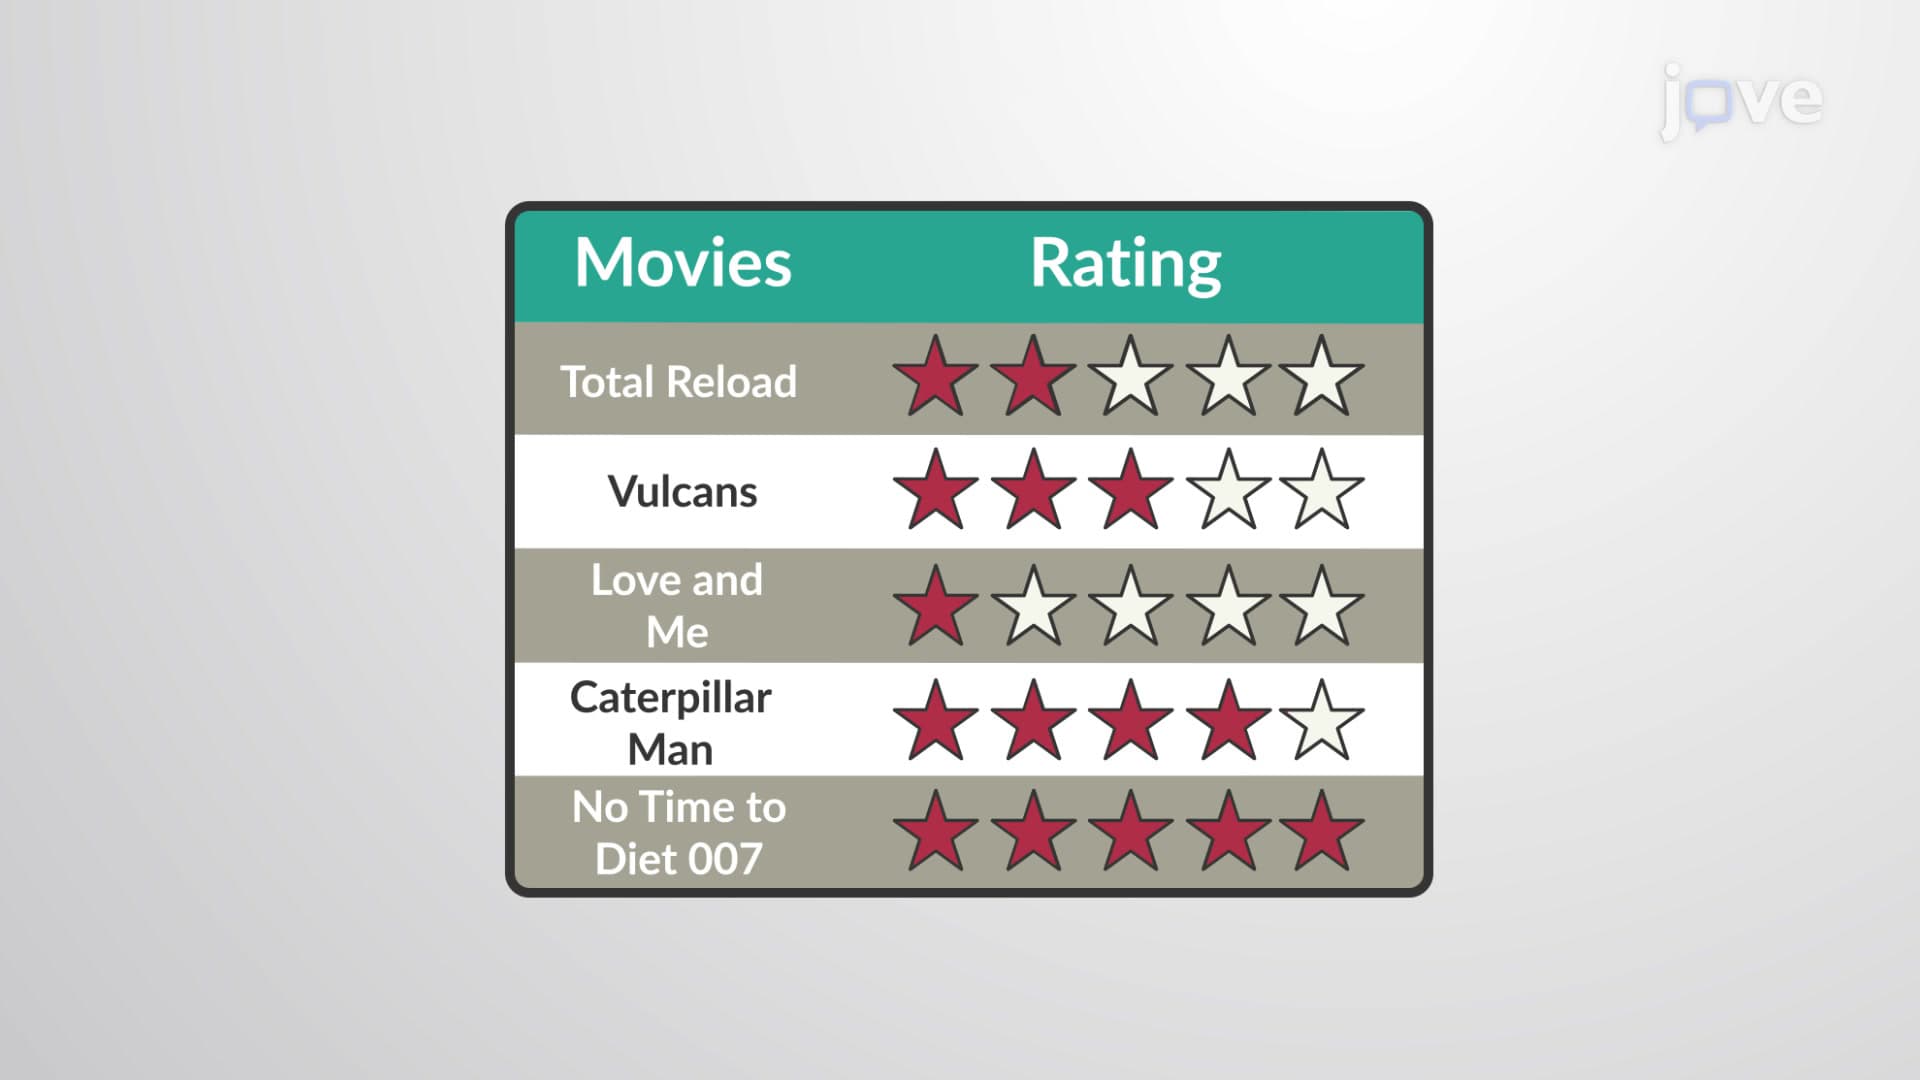
3. Levels of Measurement Hierarchy: The four measurement levels-nominal, ordinal, interval, and ratio-establish analytical possibilities and limitations. Nominal data like U.S. state names allows only categorization without meaningful ordering. Ordinal data such as military ranks (Private, Sergeant, Lieutenant) permits ordering but not meaningful differences between categories. Interval data like Fahrenheit temperatures enables meaningful differences but lacks true zero points. Ratio data including exam scores or income measurements provides complete mathematical operations including meaningful ratios and proportions.
4. Data Collection Methodologies: Three primary collection methods serve different research purposes and constraints. Observational studies, like tracking graduation rates across American high schools, gather data without manipulation or interference. Experimental studies manipulate variables systematically, such as FDA clinical trials testing new medications with treatment and control groups. Survey methods collect opinions and experiences, exemplified by Gallup polls measuring American public opinion on political candidates or social issues during election cycles.
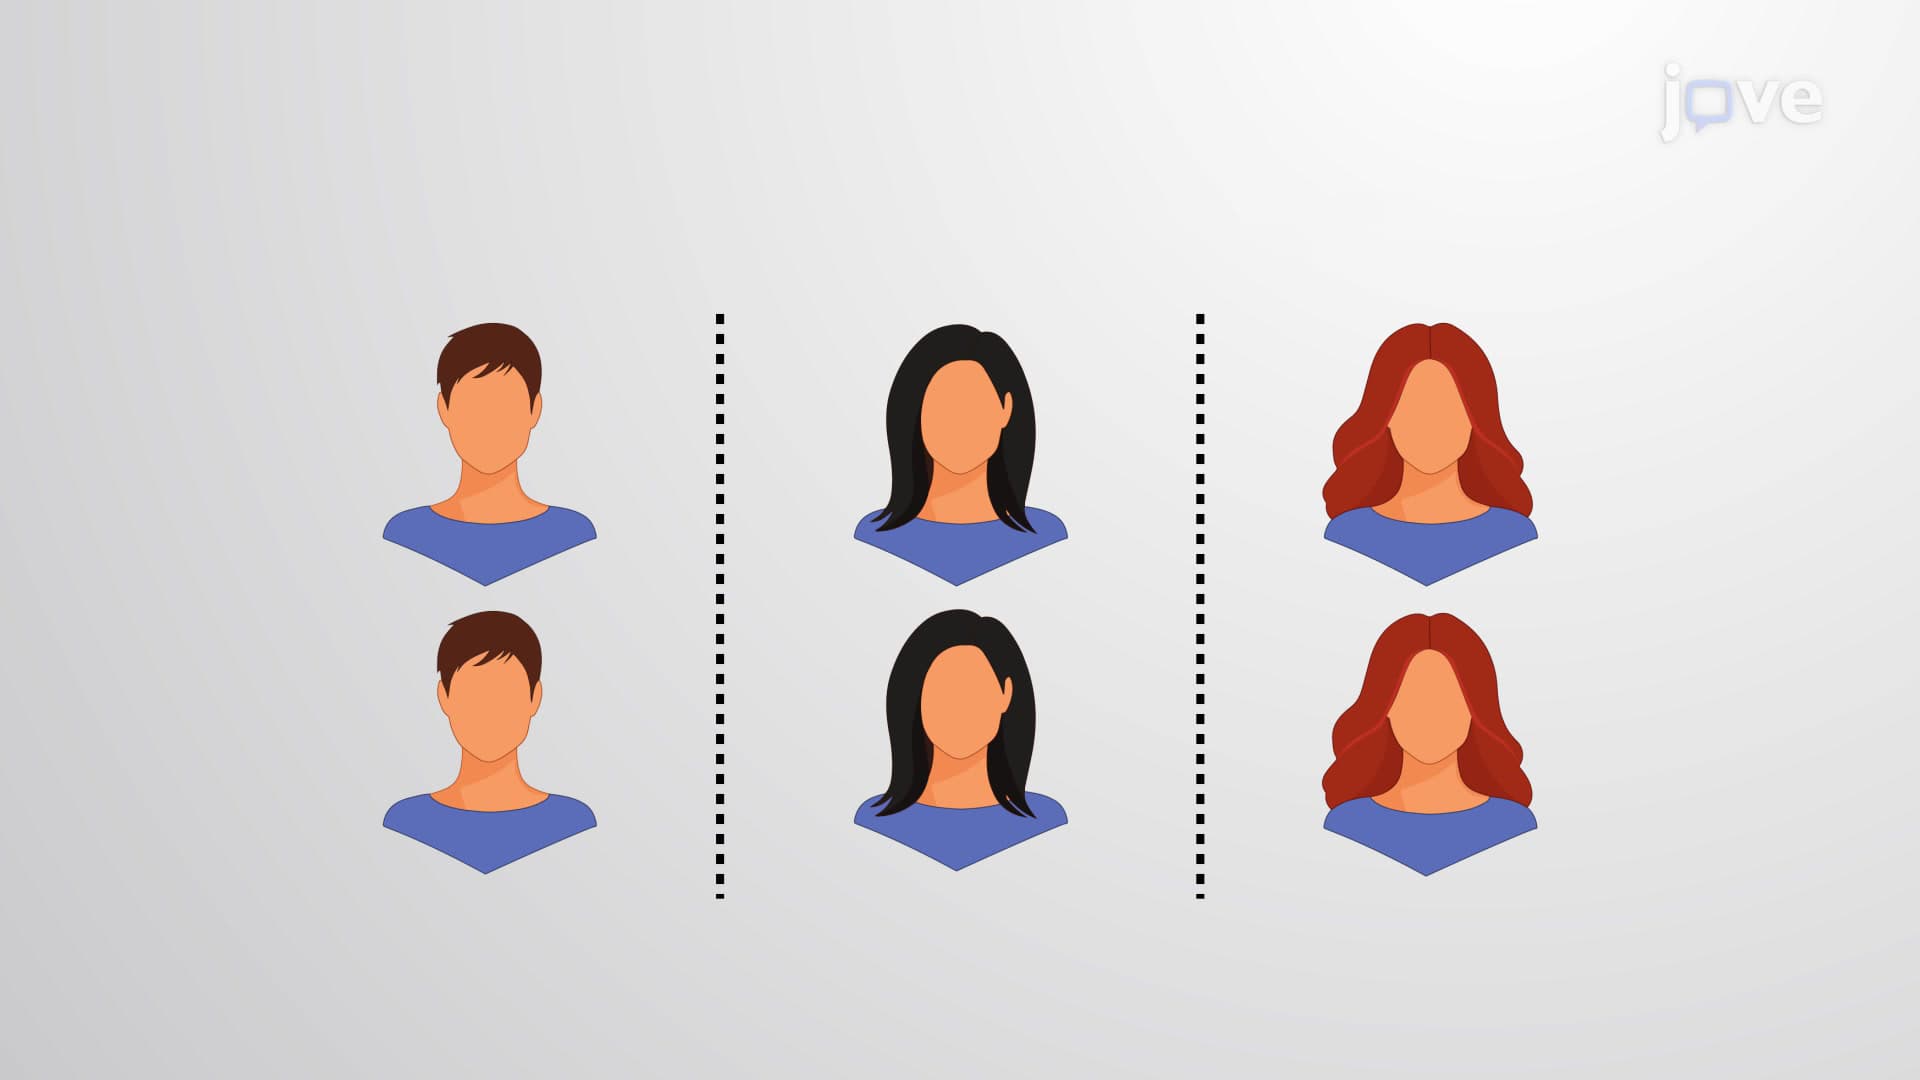
5. Sampling Techniques and Applications: Five essential sampling methods address different research scenarios and population characteristics. Random sampling ensures equal selection probability, like lottery drawings for military draft numbers. Systematic sampling uses fixed intervals, such as selecting every 10th student from university enrollment lists. Convenience sampling targets easily accessible subjects, like polling shoppers at local malls. Stratified sampling divides populations into homogeneous groups, such as surveying equal numbers from each income bracket in community studies. Cluster sampling selects entire groups, like choosing specific school districts for statewide educational assessments.