Loading concepts…


15 Concepts
15 Concepts
13 Concepts
11 Concepts
9 Concepts
14 Concepts
11 Concepts
15 Concepts
13 Concepts
7 Concepts
10 Concepts
10 Concepts
22 Concepts
19 Concepts
16 Concepts
16 Concepts
7 Concepts
 10 Concepts
 65.9K Views
 Popular topics





Statistics correlation measures the relationship between variables, while regression analysis statistics helps predict outcomes based on these relationships. This course covers correlation coefficients, Pearson correlation methods, least squares regression, and R-squared interpretation through real-world applications like temperature-ice cream sales relationships and investment-profit predictions. Master these essential statistical concepts with JoVE Coach's comprehensive approach.
1. Correlation Fundamentals and Types: Correlation measures how two variables move together, with positive correlation showing variables increasing together (like temperature and ice cream sales), negative correlation showing inverse relationships (like temperature and hot chocolate sales), and non-linear correlations following curved patterns (like exponential COVID case growth). Understanding these patterns helps identify relationships in real-world data from healthcare outcomes to economic indicators.
2. Linear Correlation Coefficient Calculation: The Pearson correlation coefficient (r) quantifies linear relationship strength between -1 and +1, where values closer to these extremes indicate stronger correlations. Calculate r using the formula involving sums of x², y², and xy values. For example, with athlete height-weight data, you'll determine correlation strength and compare against critical values from statistical tables to establish significance at chosen confidence levels.
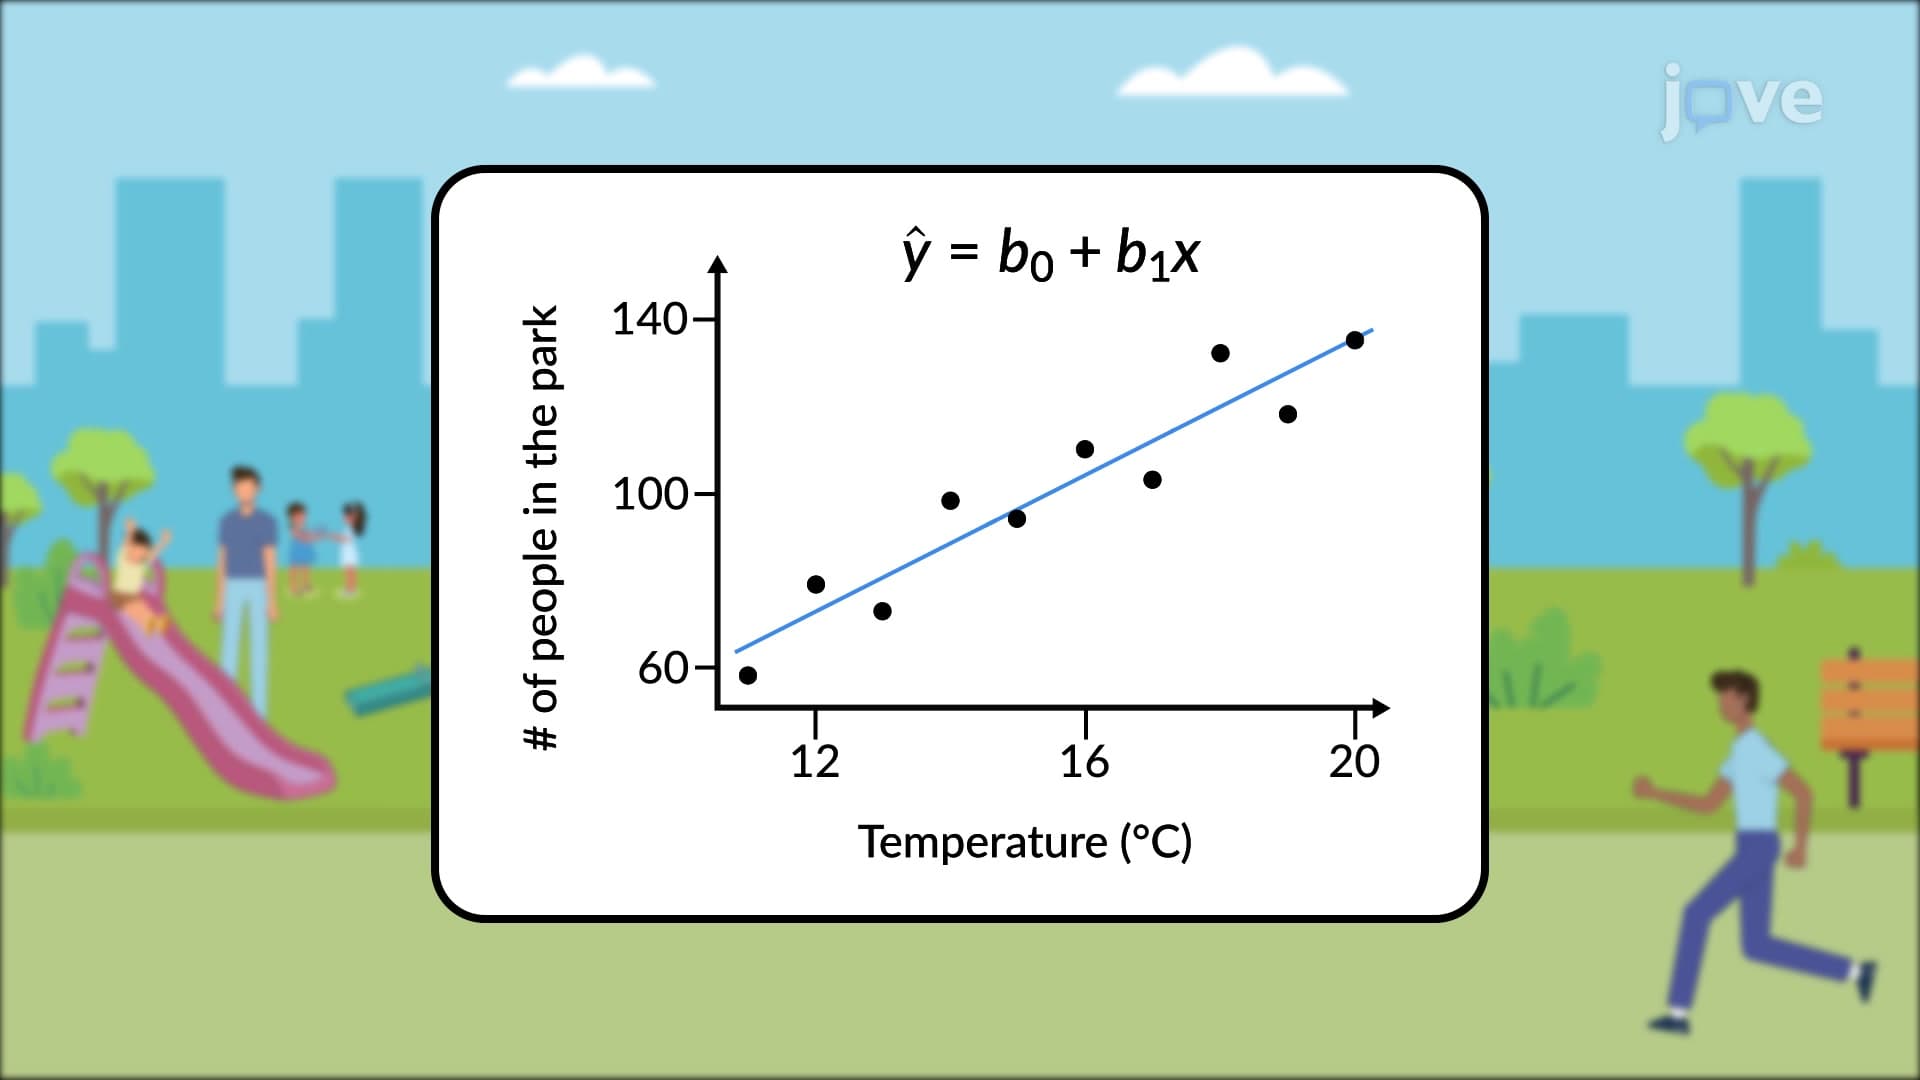
3. Regression Analysis and Prediction Models: Regression analysis statistics creates mathematical models expressing relationships between independent and dependent variables through best-fit lines. The regression equation y = b₀ + b₁x uses y-intercept (b₀) and slope (b₁) to predict outcomes. For instance, predicting annual temperature from CO₂ levels or estimating profits from investment amounts demonstrates practical regression applications in environmental science and business forecasting.
4. Outliers and Influential Points Impact: Outliers appear as data points significantly distant from regression lines vertically, while influential points lie far horizontally from other data. Both affect correlation strength and regression accuracy. Identify outliers using residual analysis-differences between observed and predicted values. Points beyond two residual standard deviations typically qualify as outliers, requiring careful consideration about data inclusion or exclusion in final analyses.
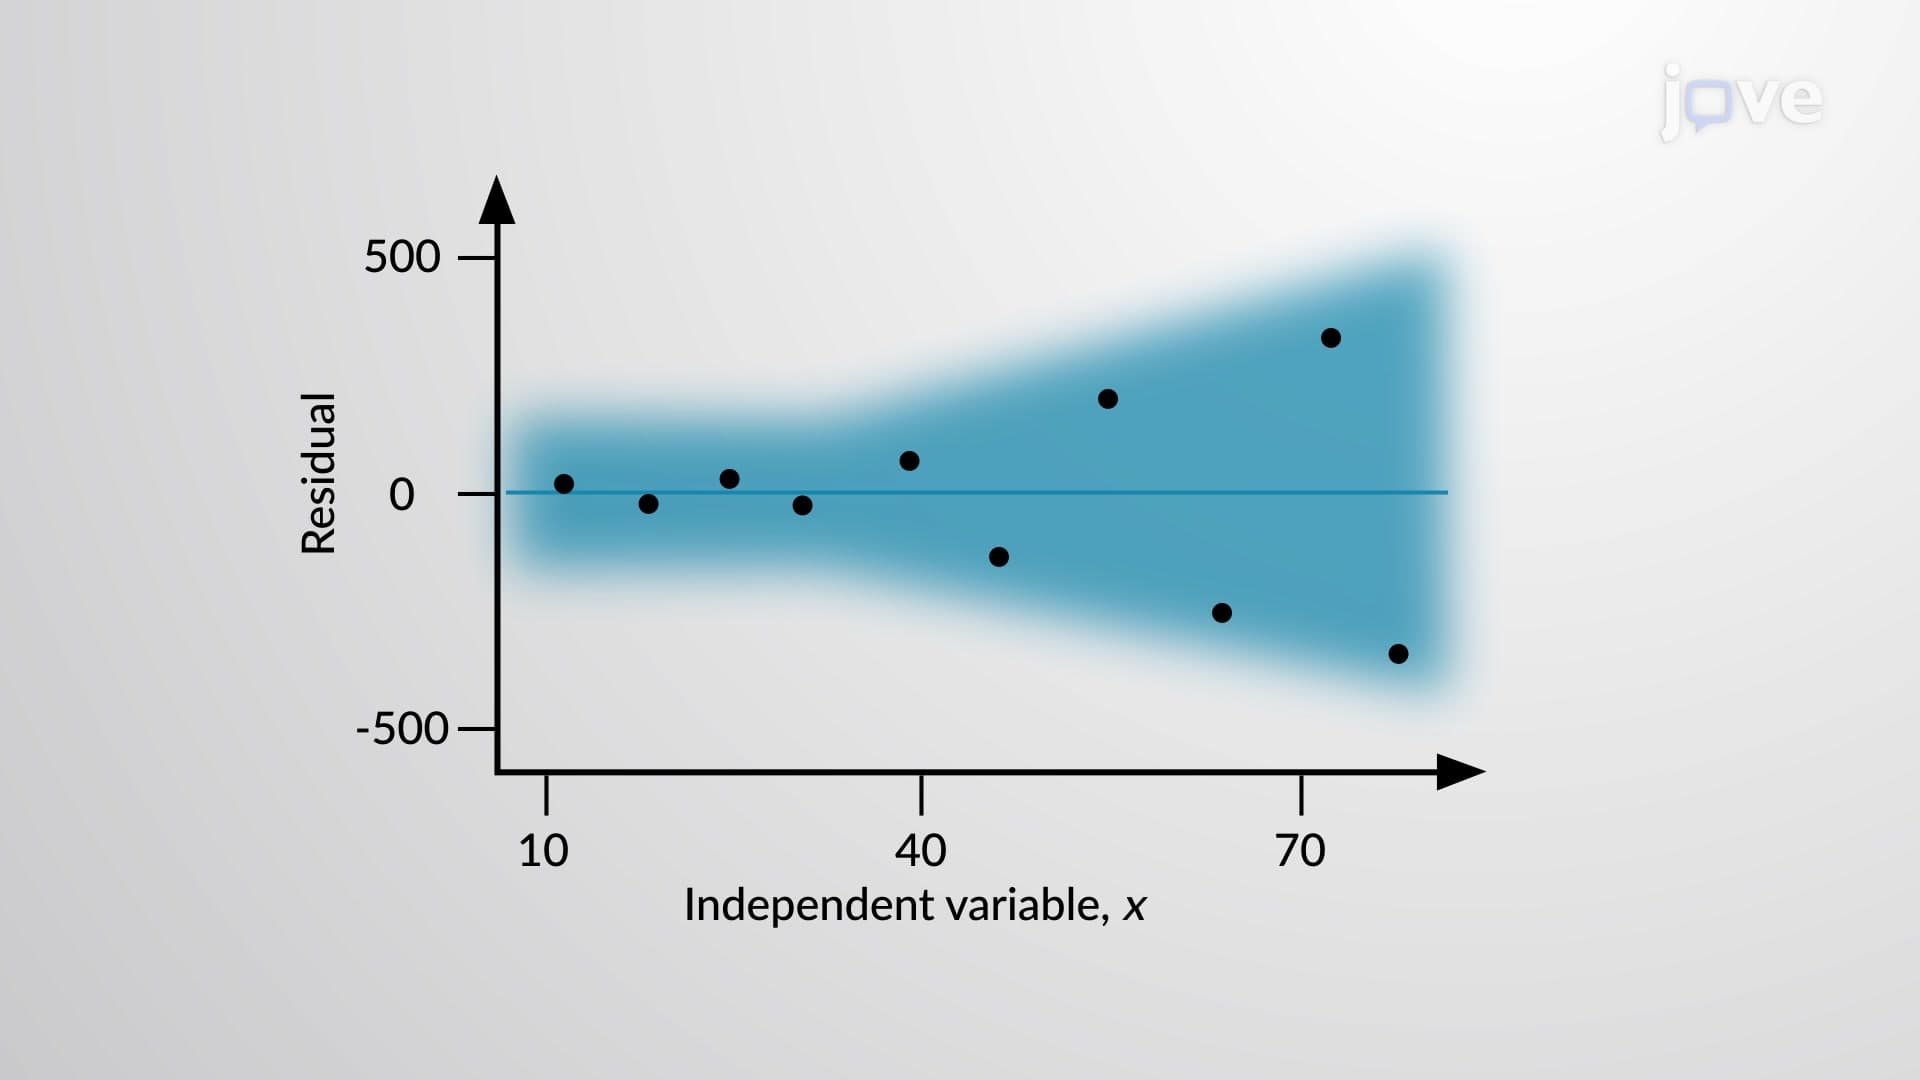
5. Least Squares Regression and Residual Analysis: The least-squares property ensures regression lines minimize the sum of squared residuals-vertical distances between actual data points and predicted values. Residual plots help evaluate model appropriateness by showing patterns that indicate good fits (random scatter) versus poor fits (curved patterns or increasing spread). This principle underlies most statistical software regression calculations.
6. Variation Analysis and R-squared Interpretation: Total variation splits into explained variation (attributable to the regression relationship) and unexplained variation (residuals from other factors or chance). R-squared values represent the proportion of total variation explained by the regression model, with higher values indicating better predictive power. For example, R² = 0.762 means the model explains 76.2% of outcome variation, while 23.8% remains unexplained.
7. Multiple Regression Applications: Multiple regression extends simple regression to analyze relationships between one dependent variable and multiple independent variables simultaneously. For example, athlete water consumption depends on both temperature and practice duration. Software typically handles complex calculations, producing multiple coefficient of determination (R²) values. Adjusted R² accounts for additional variables to prevent inflation from simply adding more predictors to models.