Loading concepts…


15 Concepts
15 Concepts
13 Concepts
11 Concepts
9 Concepts
14 Concepts
11 Concepts
15 Concepts
13 Concepts
7 Concepts
10 Concepts
10 Concepts
22 Concepts
19 Concepts
16 Concepts
16 Concepts
7 Concepts
 14 Concepts
 173.2K Views
 Popular topics






Probability distributions form the mathematical foundation for understanding how likely different outcomes are in statistical experiments. From analyzing coin tosses and dice rolls to predicting SAT scores and quality control in manufacturing, these distributions help students model real-world uncertainty. This comprehensive course through JoVE Coach covers discrete distributions like binomial normal distribution and continuous distributions, exploring their types and properties of probability distributions essential for AP Statistics and standardized test success.
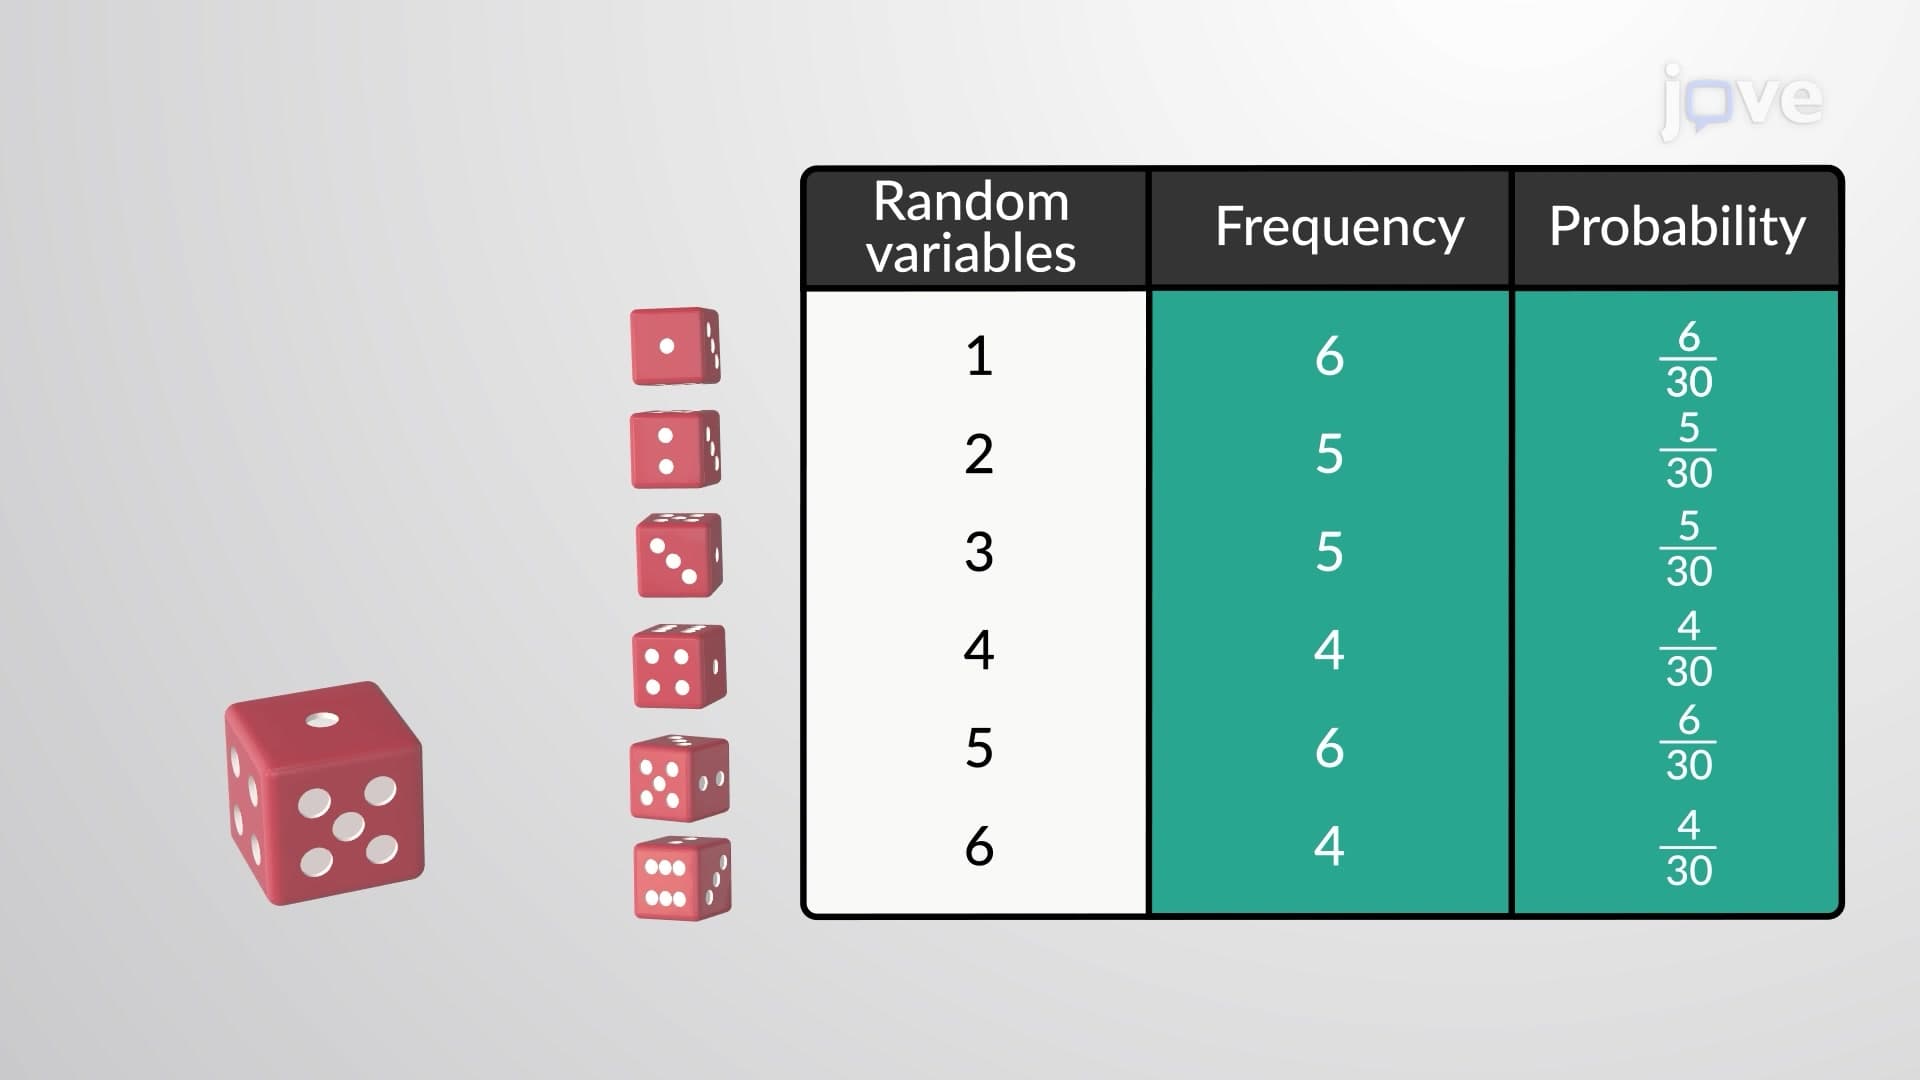
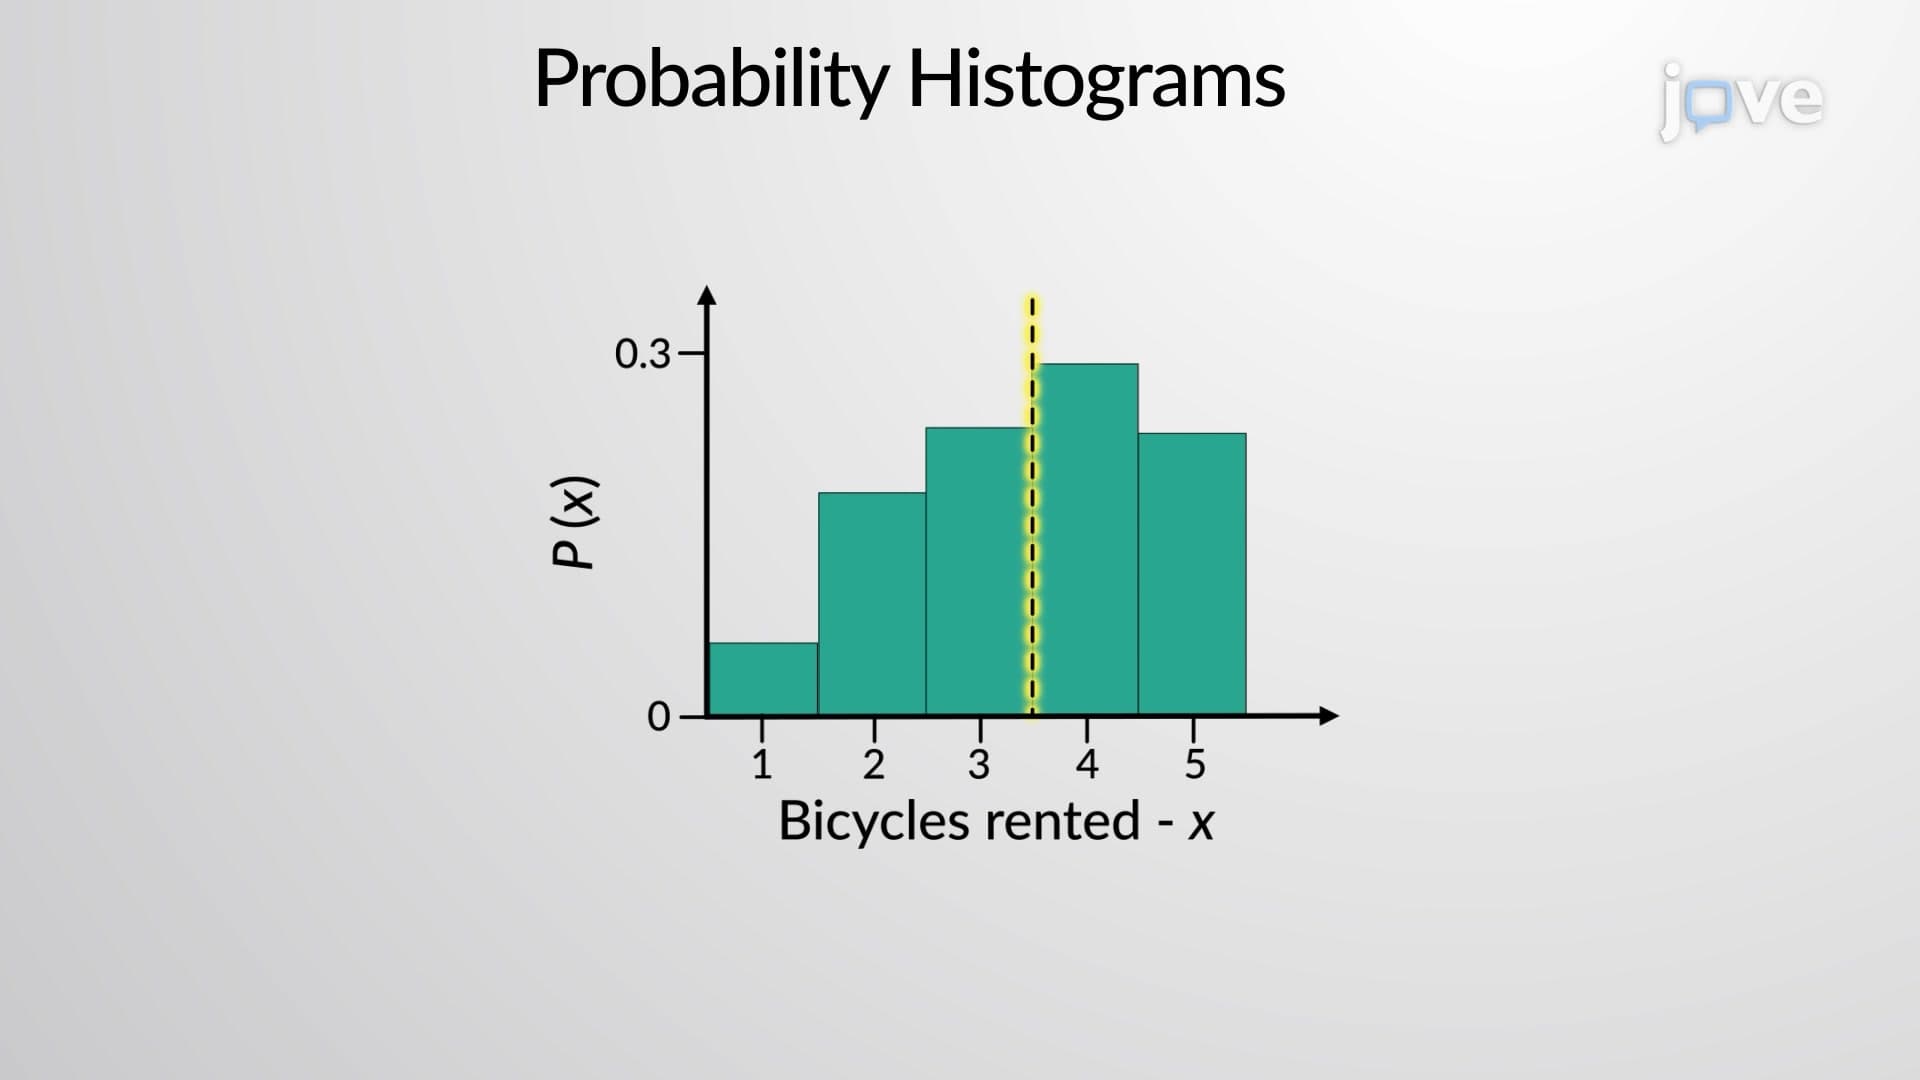
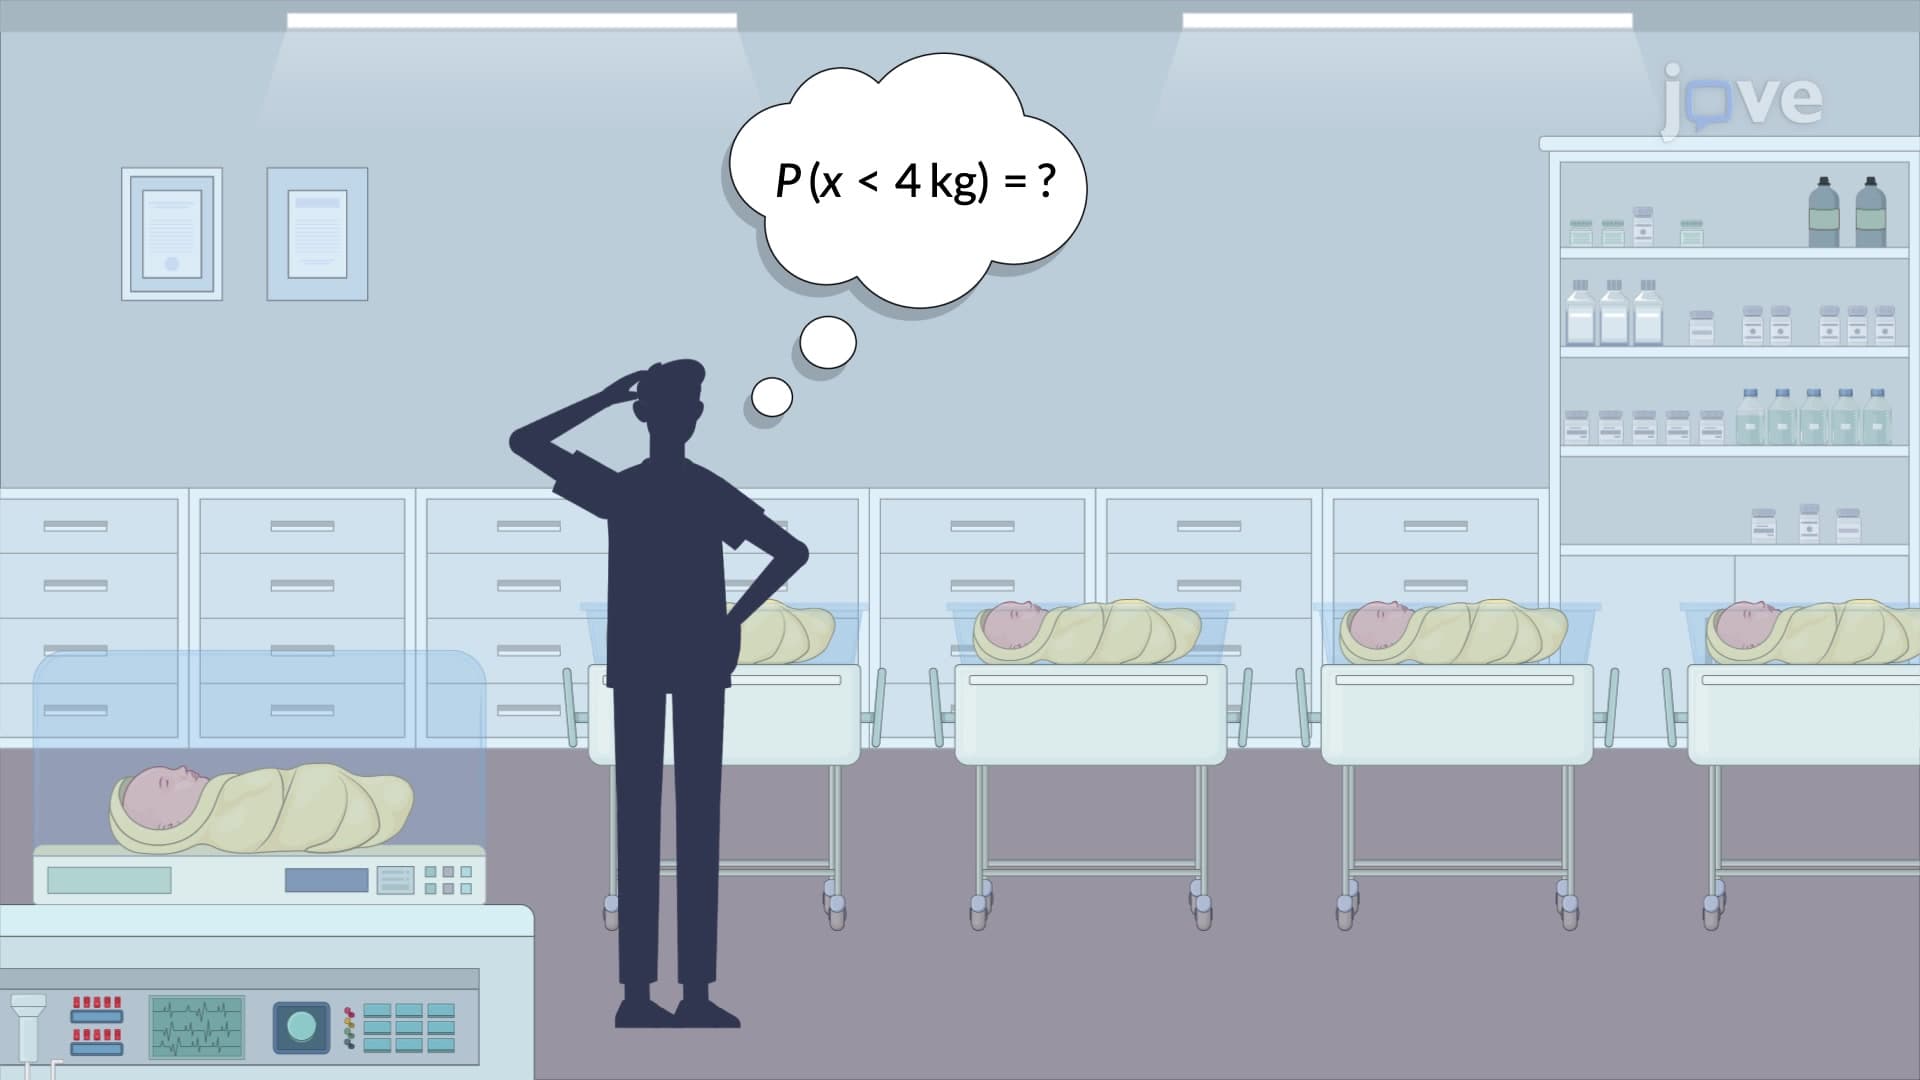
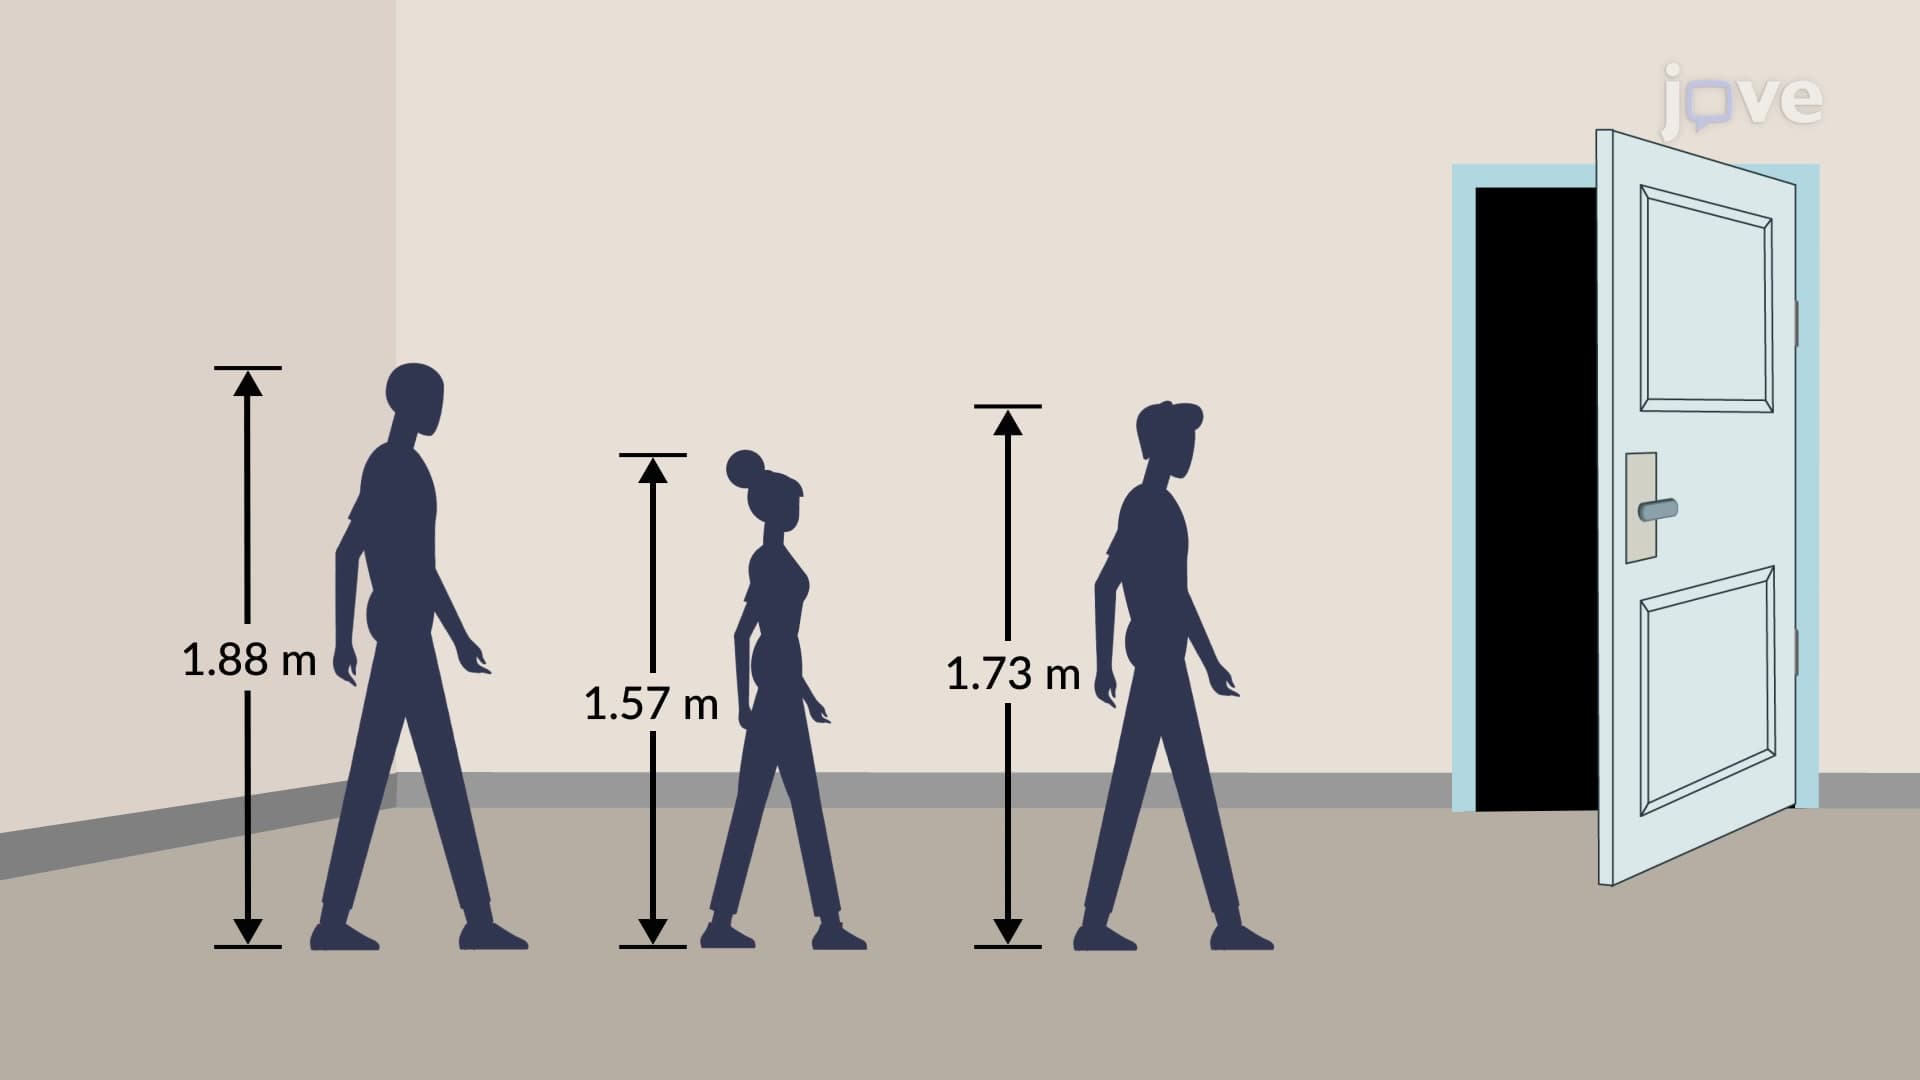
1. Fundamentals of Probability and Random Variables Understanding probability as the mathematical study of uncertainty, where events range from impossible (probability = 0) to certain (probability = 1). Random variables represent numerical outcomes determined by chance, classified as either discrete (like the number of students in a classroom) or continuous (like heights or test scores). Students explore how probability calculations form the foundation for statistical inference, using examples like analyzing free-throw shooting percentages in basketball or predicting election outcomes based on polling data.
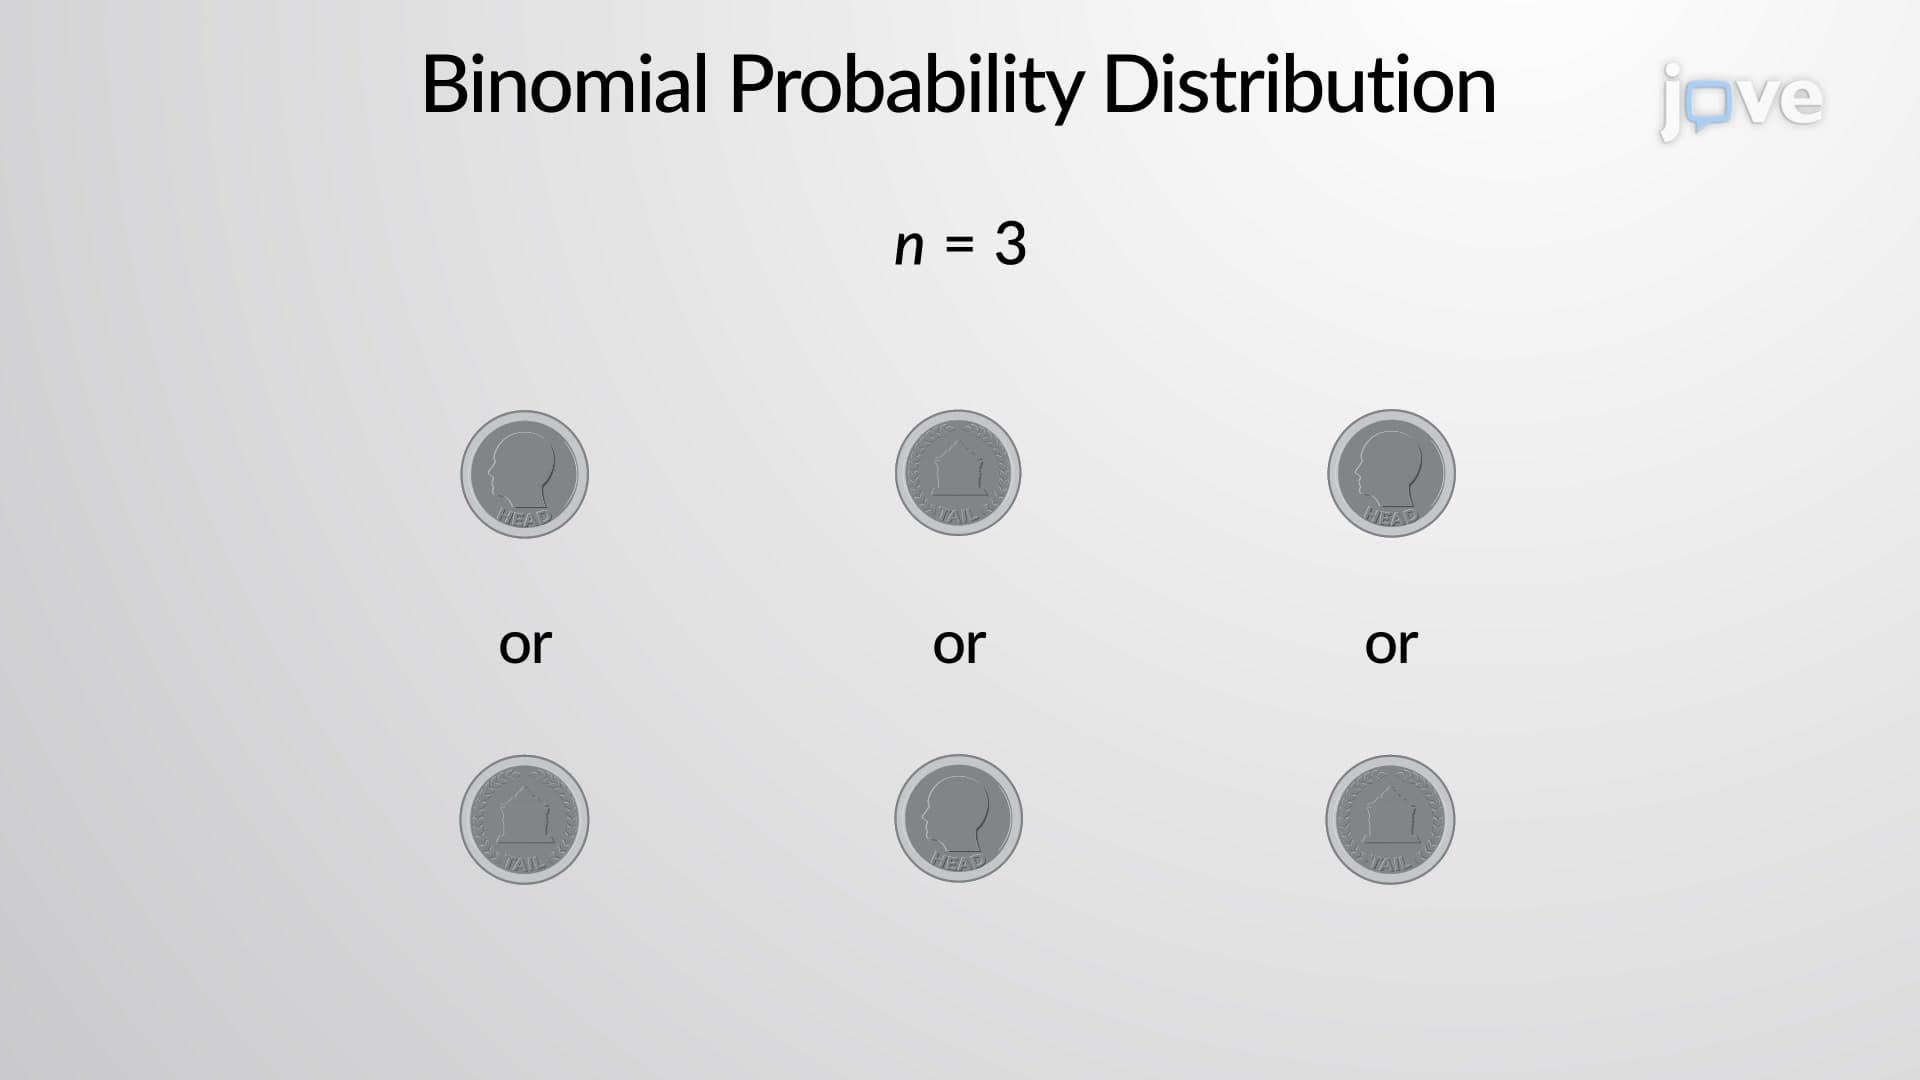
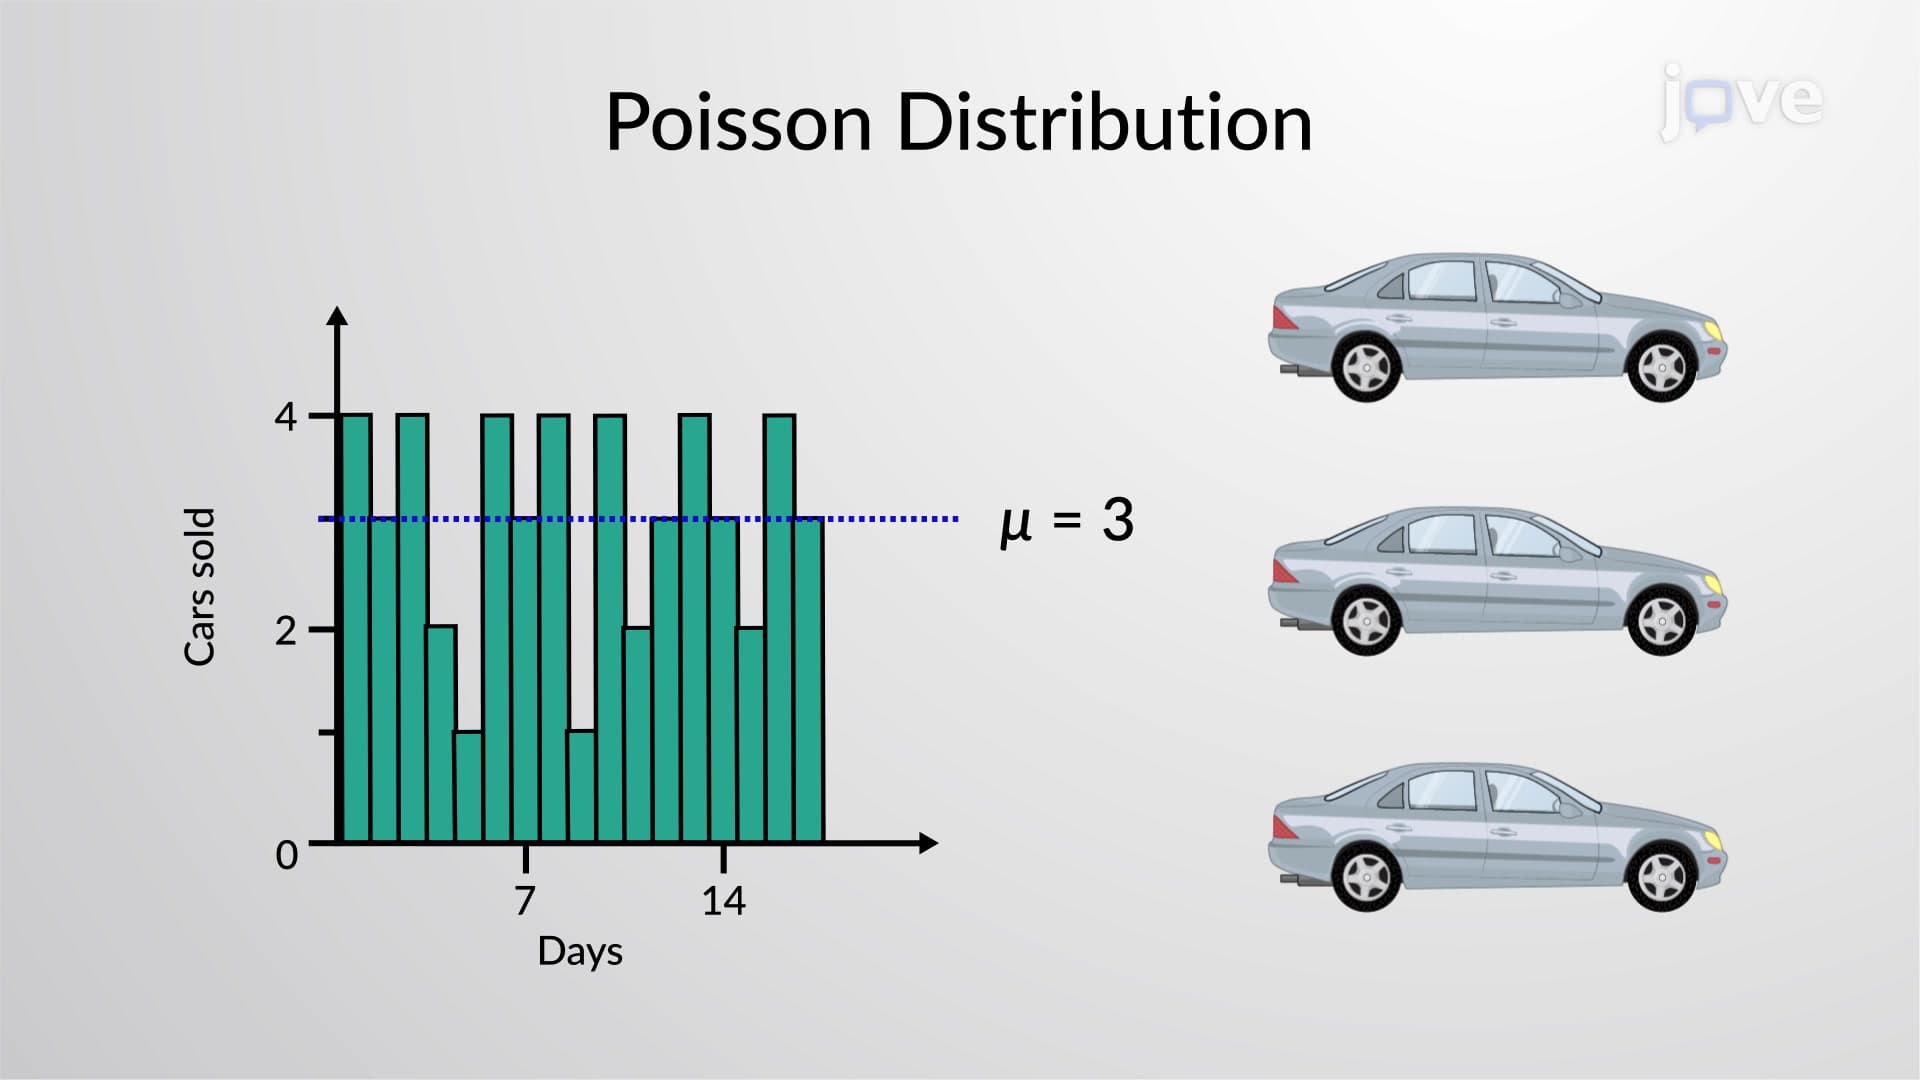
2. Binomial and Poisson Distributions The binomial normal distribution applies to scenarios with fixed trials and two possible outcomes, such as multiple-choice test questions or medical treatment success rates. Key requirements include independent trials with constant success probability, making it perfect for analyzing scenarios like SAT guessing strategies or quality control in manufacturing. Poisson distributions model rare events occurring over time intervals, such as emergency room arrivals per hour or website crashes per day, where events are independent and the average rate remains constant.
3. Continuous Distributions: Uniform and Normal Uniform distributions represent equally likely outcomes across a range, like random number generators or delivery time windows. The normal distribution, with its characteristic bell-shaped curve, appears throughout nature and human measurements-from standardized test scores to blood pressure readings. Students learn how the probability density function describes these continuous distributions, where areas under curves represent probabilities rather than individual point values, essential for understanding real-world phenomena like grade distributions or manufacturing tolerances.
4. Expected Value and Statistical Decision Making Expected value represents the long-term average outcome of repeated trials, crucial for financial planning, insurance calculations, and business decisions. Students calculate expected values using distribution parameters to evaluate scenarios like lottery tickets, investment returns, or sports betting odds. This concept bridges theoretical probability with practical applications, showing how mathematical models inform real-world choices from college major selection based on salary expectations to medical treatment decisions based on success rates.
5. Standard Normal Distribution and Z-Scores Converting any normal distribution to the standard normal distribution (mean = 0, standard deviation = 1) using z-scores enables standardized comparisons across different datasets. Students master z-score calculations to find percentiles, compare test performances across different exams, or determine manufacturing quality control limits. Understanding CDF PDF relationships allows students to calculate probabilities for ranges of values, essential for interpreting standardized test scores, medical reference ranges, or determining scholarship eligibility thresholds.
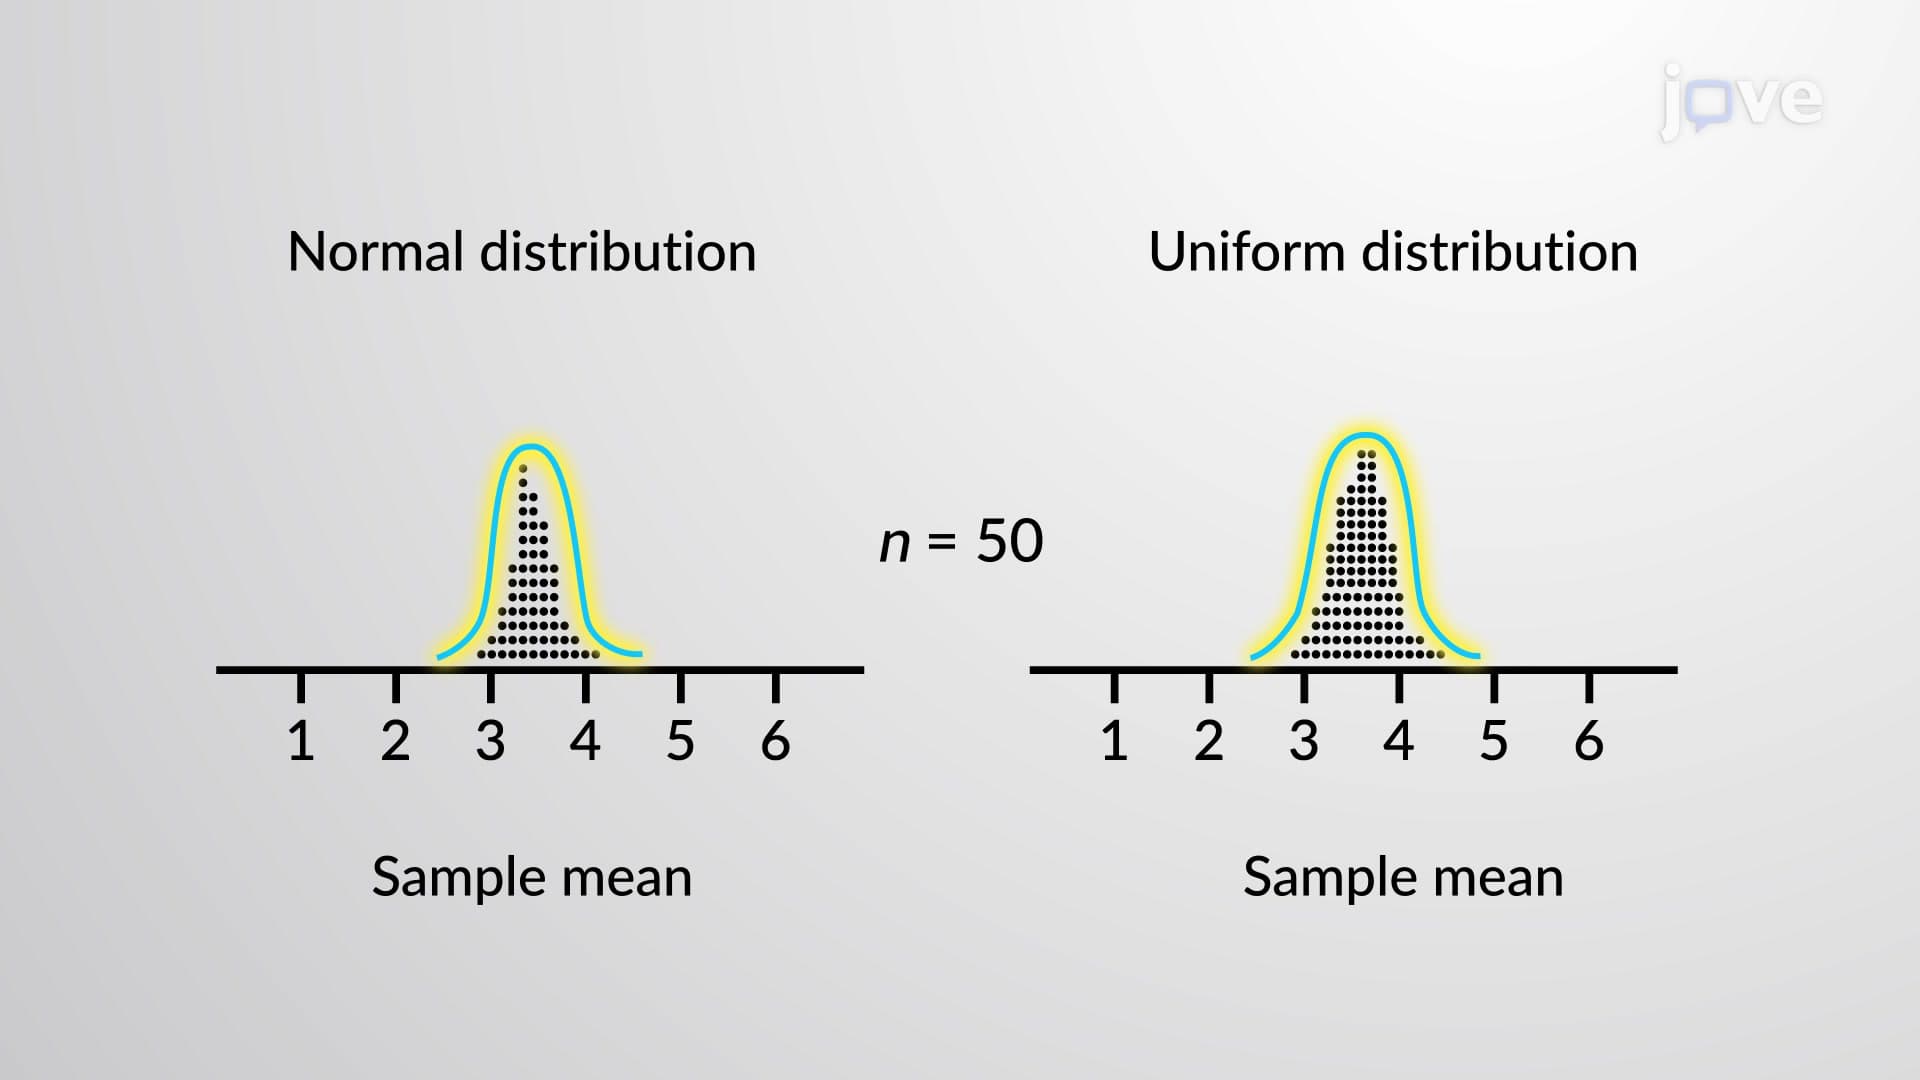
6. Sampling Distributions and Central Limit Theorem The Central Limit Theorem demonstrates how sample means approach normal distribution regardless of the original population shape, provided sufficient sample size (typically n ≥ 30). This fundamental principle underlies confidence interval construction and hypothesis testing, showing why polling organizations can make accurate predictions about entire populations based on relatively small samples. Students explore applications in quality control, medical research, and political polling, understanding how sample size affects the reliability of statistical conclusions drawn from surveys or experiments.