Loading video…


 14 Concepts
 173.2K views

Video Summary: What Is Expected Value
Did you know that every $10 roulette bet in Las Vegas mathematically costs you 53 cents? Expected value reveals the hidden mathematics behind games of chance, investment decisions, and risk assessment. This fundamental probability concept calculates the long-run average outcome when an experiment is repeated infinitely, like determining your average winnings from repeated casino bets or stock market investments. Understanding What is Expected Value helps students master probability theory and make informed decisions in uncertain situations. Watch the full video on JoVE Coach to master this concept with expert-led visuals and step-by-step explanations.
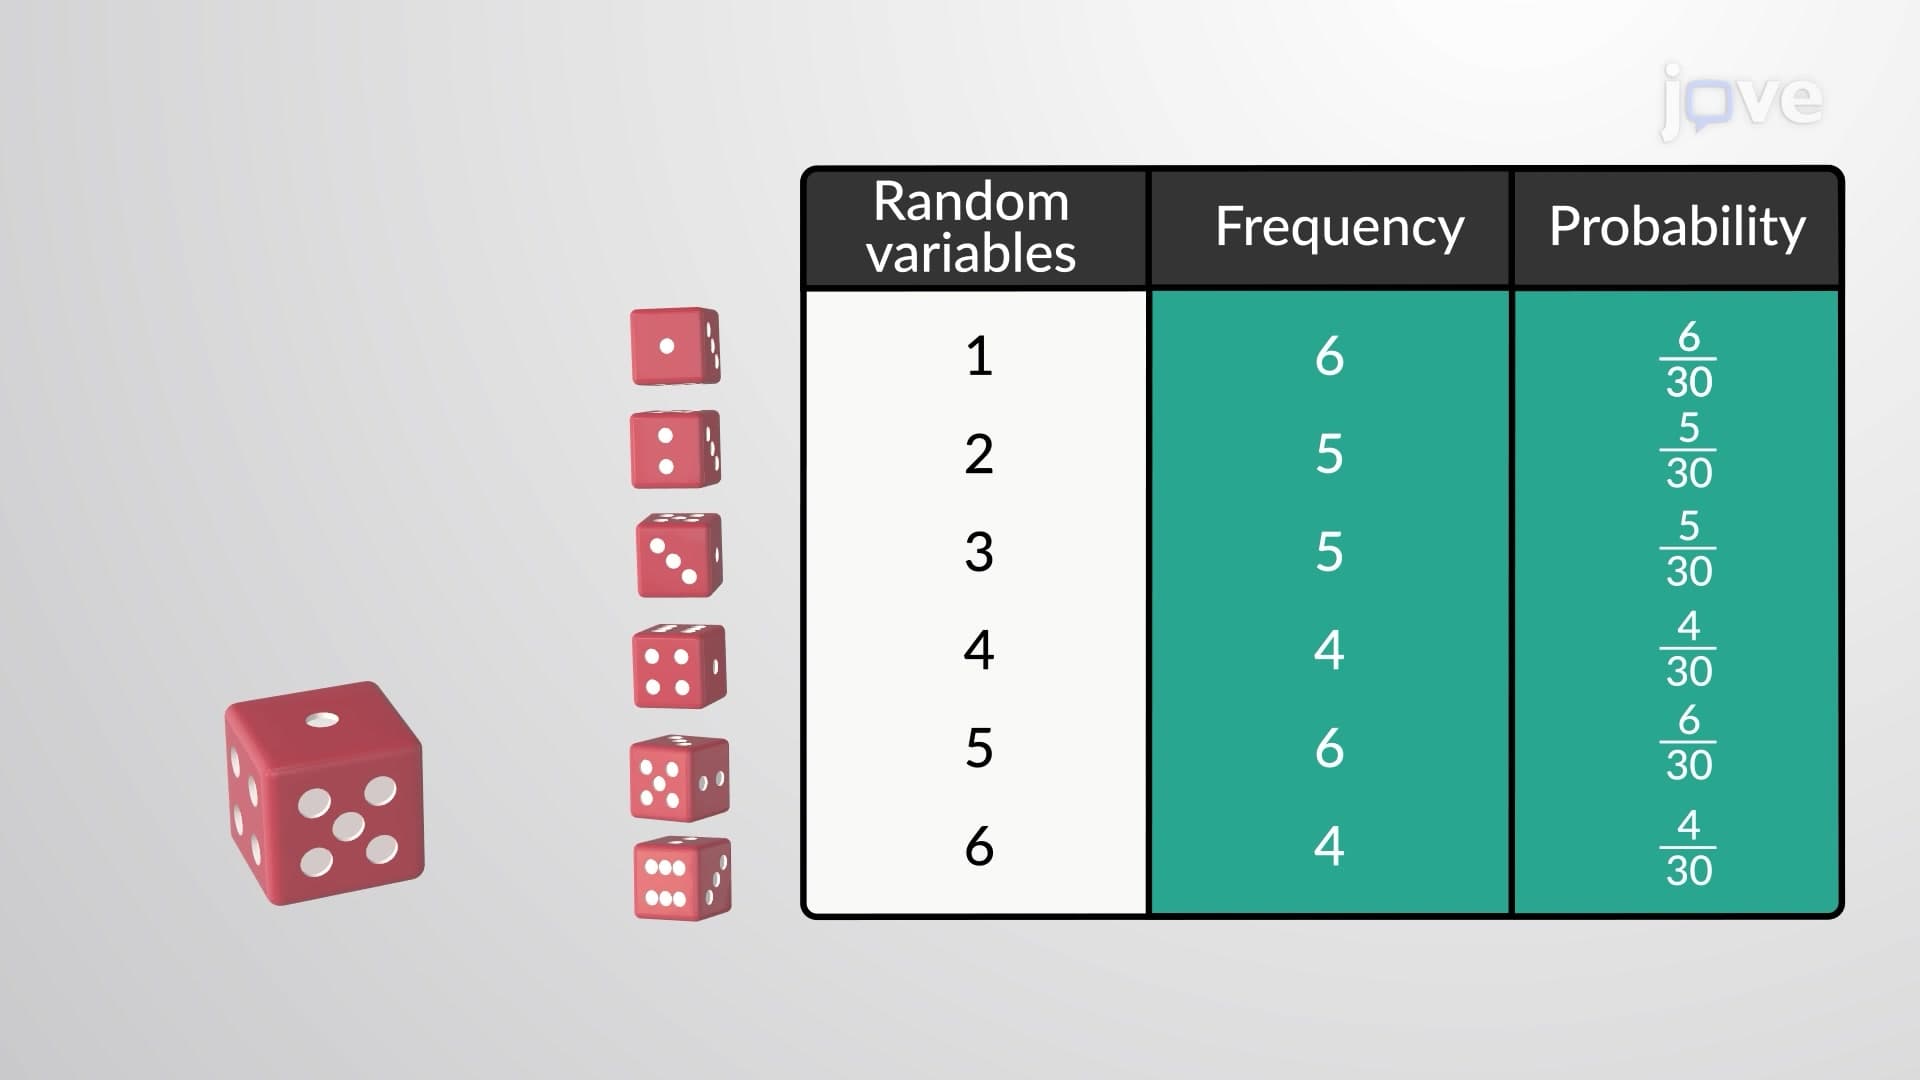
Expected value serves as one of the most crucial concepts in probability theory and statistics, representing the theoretical mean of a random variable when an experiment is repeated indefinitely. Unlike a simple average calculated from existing data, expected value predicts what we anticipate happening over countless repetitions of the same probabilistic event.
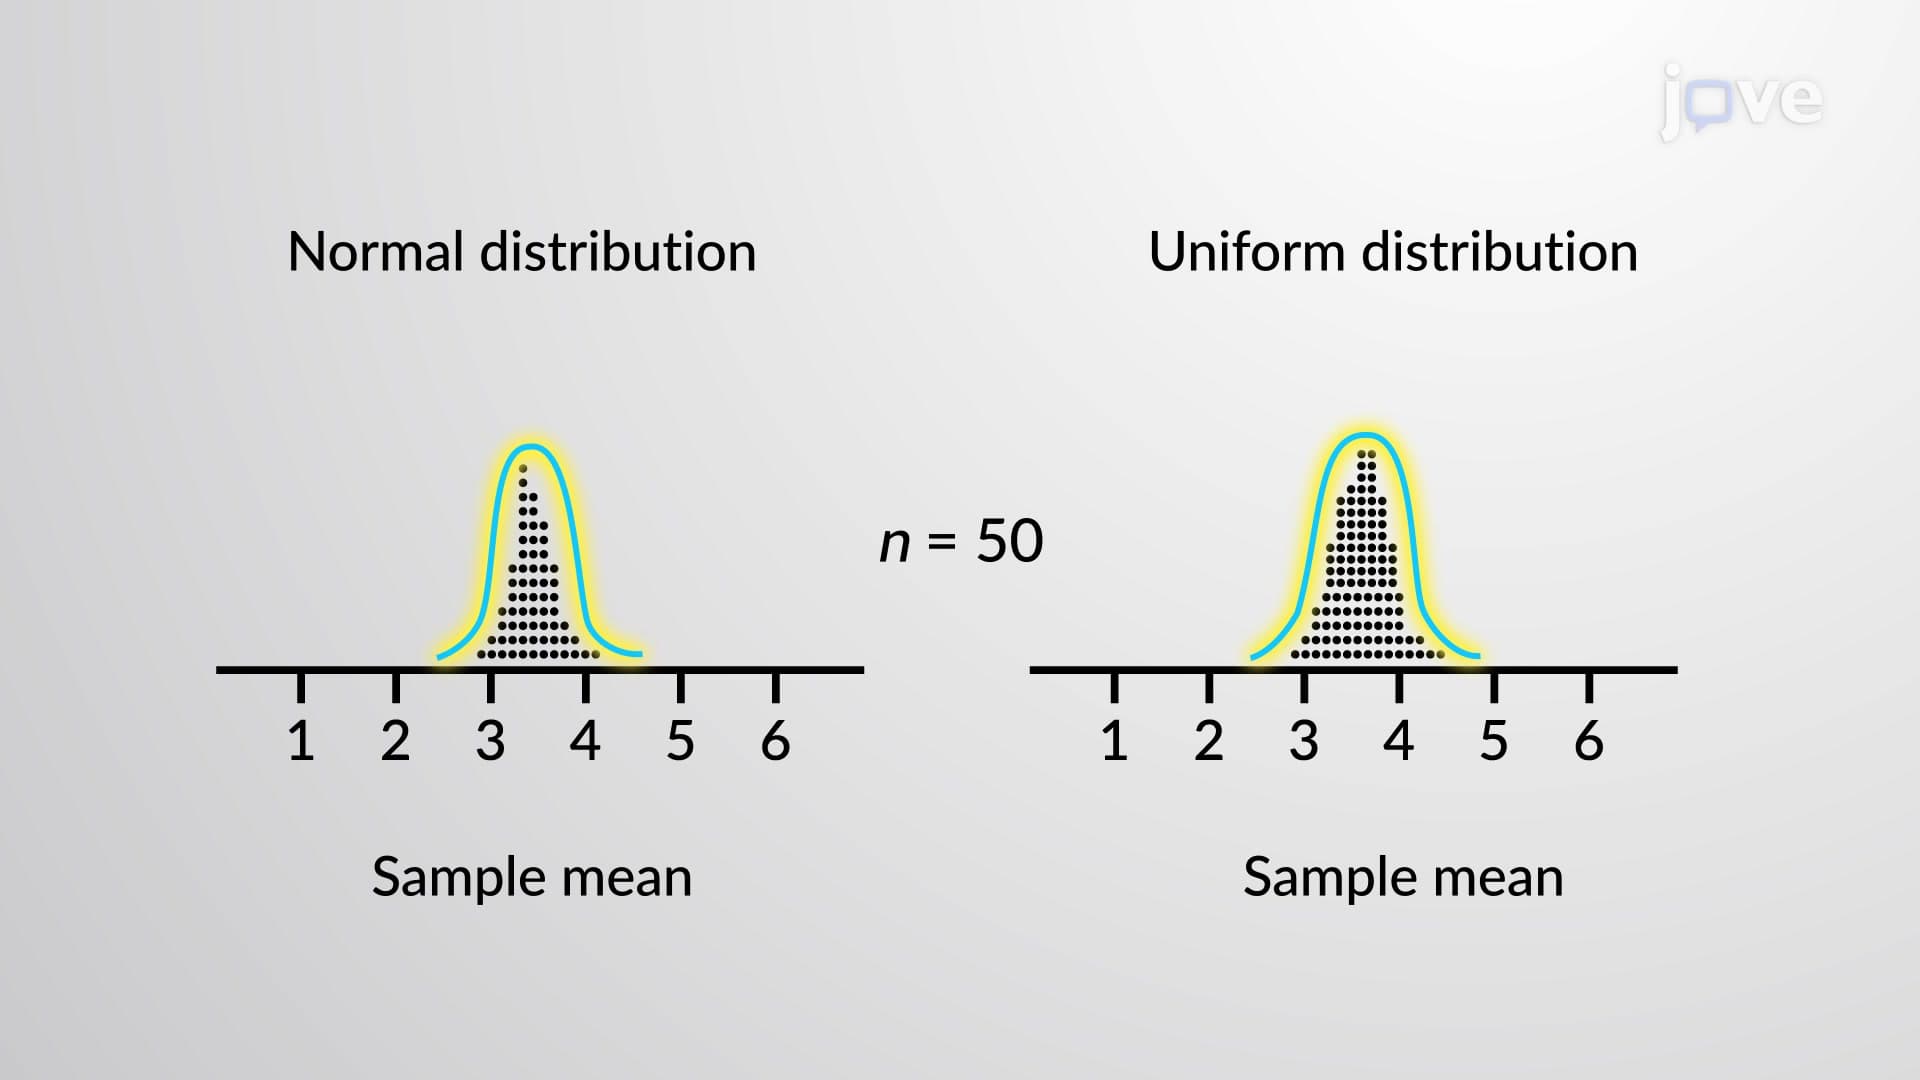
The mathematical foundation rests on the principle that as sample size increases toward infinity, the observed sample mean converges to a fixed theoretical value. This convergence property, demonstrated through the law of large numbers, explains why casinos consistently profit despite individual wins and losses varying dramatically.
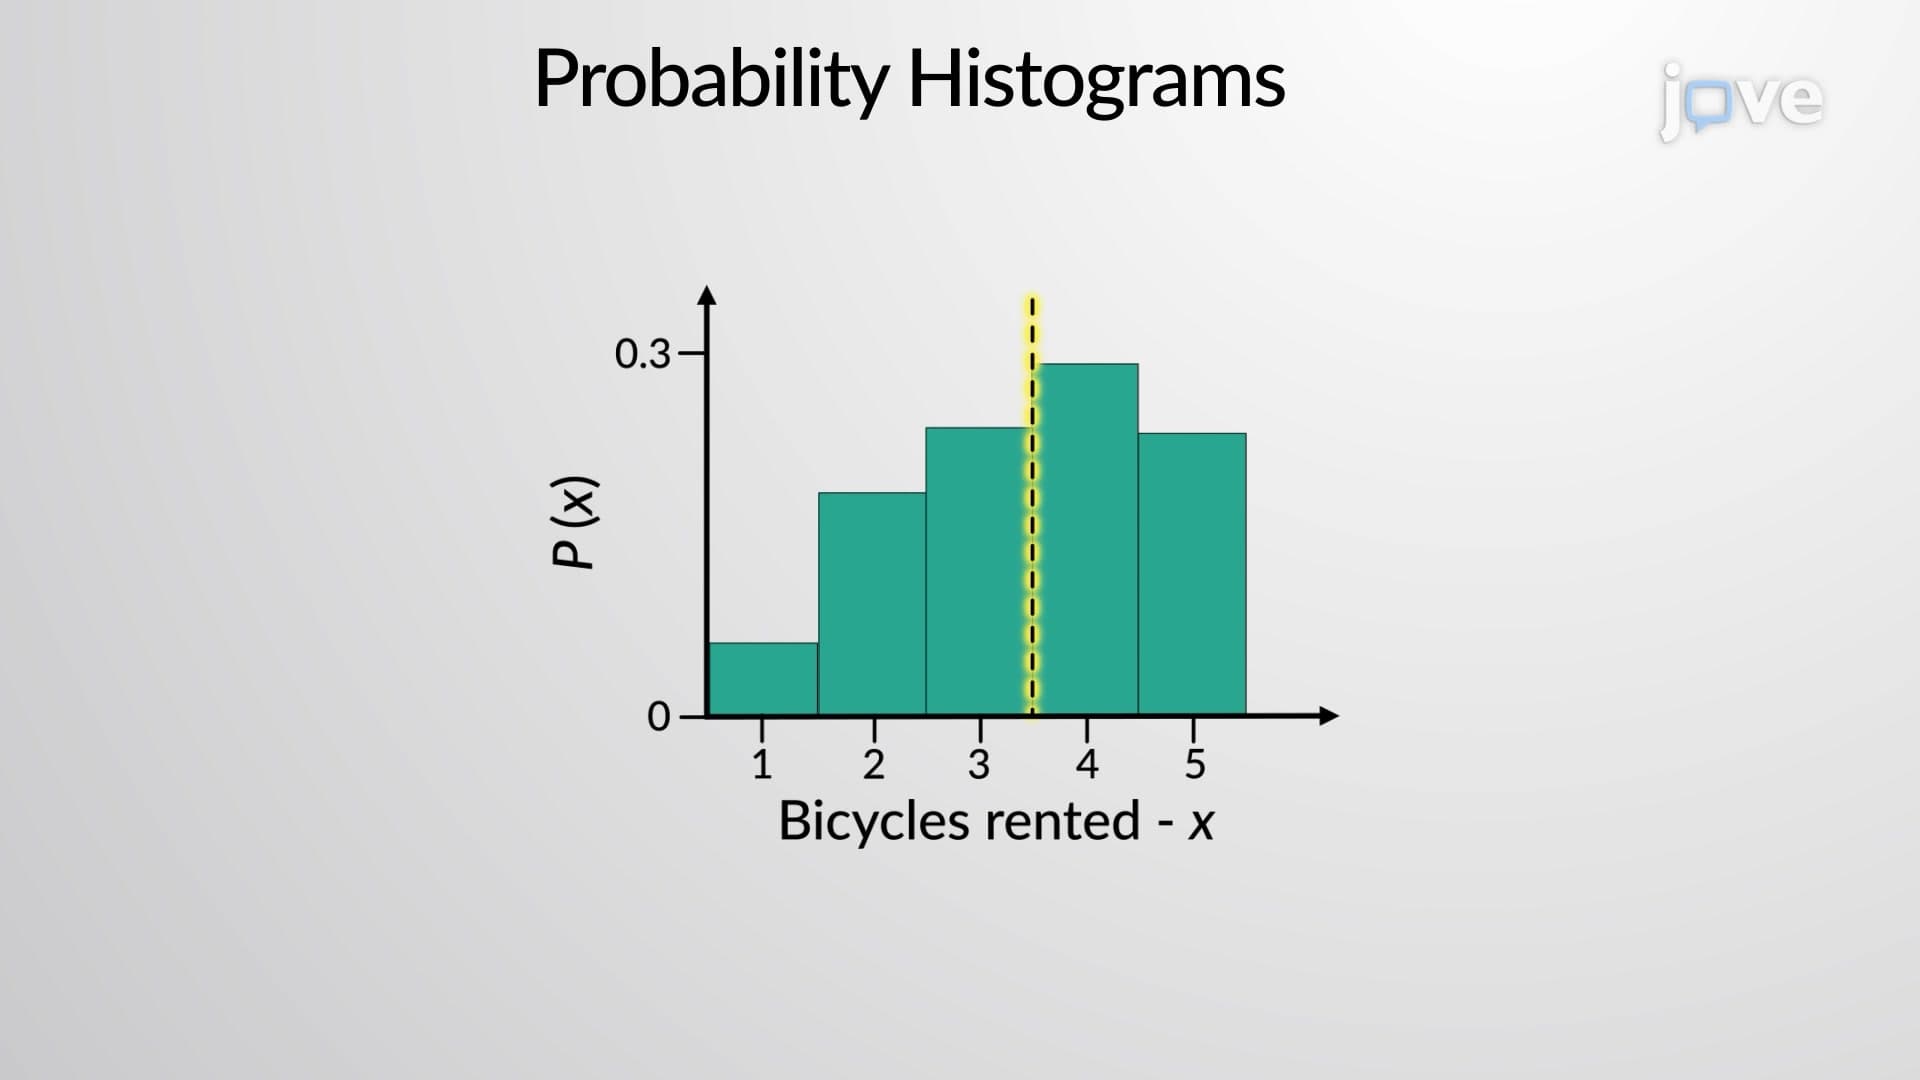
The expected value formula mirrors the weighted average calculation: E(X) = Σ[x × P(x)], where each possible outcome is multiplied by its probability of occurrence. For discrete random variables, this involves summing products of values and their corresponding probabilities. For continuous distributions, integration replaces summation.
Consider practical applications in standardized testing. If an AP Statistics multiple-choice question has four options with random guessing, the expected score per question equals (1 × 0.25) + (0 × 0.75) = 0.25 points. Over 40 questions, a student randomly guessing expects to score 10 points, though actual scores will vary around this central tendency.
Expected value analysis proves invaluable for informed decision-making across numerous fields. Insurance companies calculate expected payouts to set premium rates, ensuring long-term profitability while providing coverage. A health insurance company might determine that covering a specific procedure costs an expected $2,400 per policyholder annually, factoring in both procedure costs and occurrence probabilities.
Investment portfolio management heavily relies on expected return calculations. If Stock A has a 60% chance of 8% return and 40% chance of -3% return, its expected return equals (0.6 × 0.08) + (0.4 × -0.03) = 0.036 or 3.6% annually. Investors compare expected returns across different securities to optimize portfolio allocation.
Expected value connects directly to variance, standard deviation, and other distributional parameters studied in college-level statistics courses. The concept appears frequently on SAT Math Level 2 tests, AP Statistics exams, and introductory college statistics midterms, often requiring students to calculate expected values for games of chance, investment scenarios, or experimental outcomes.
Understanding expected value provides essential groundwork for advanced topics including hypothesis testing, confidence intervals, and regression analysis. Students planning to pursue fields like actuarial science, economics, or data science will encounter expected value applications throughout their academic and professional careers, making early mastery particularly valuable.
Related Micro-courses