Loading video…

 14 Concepts
 173.2K views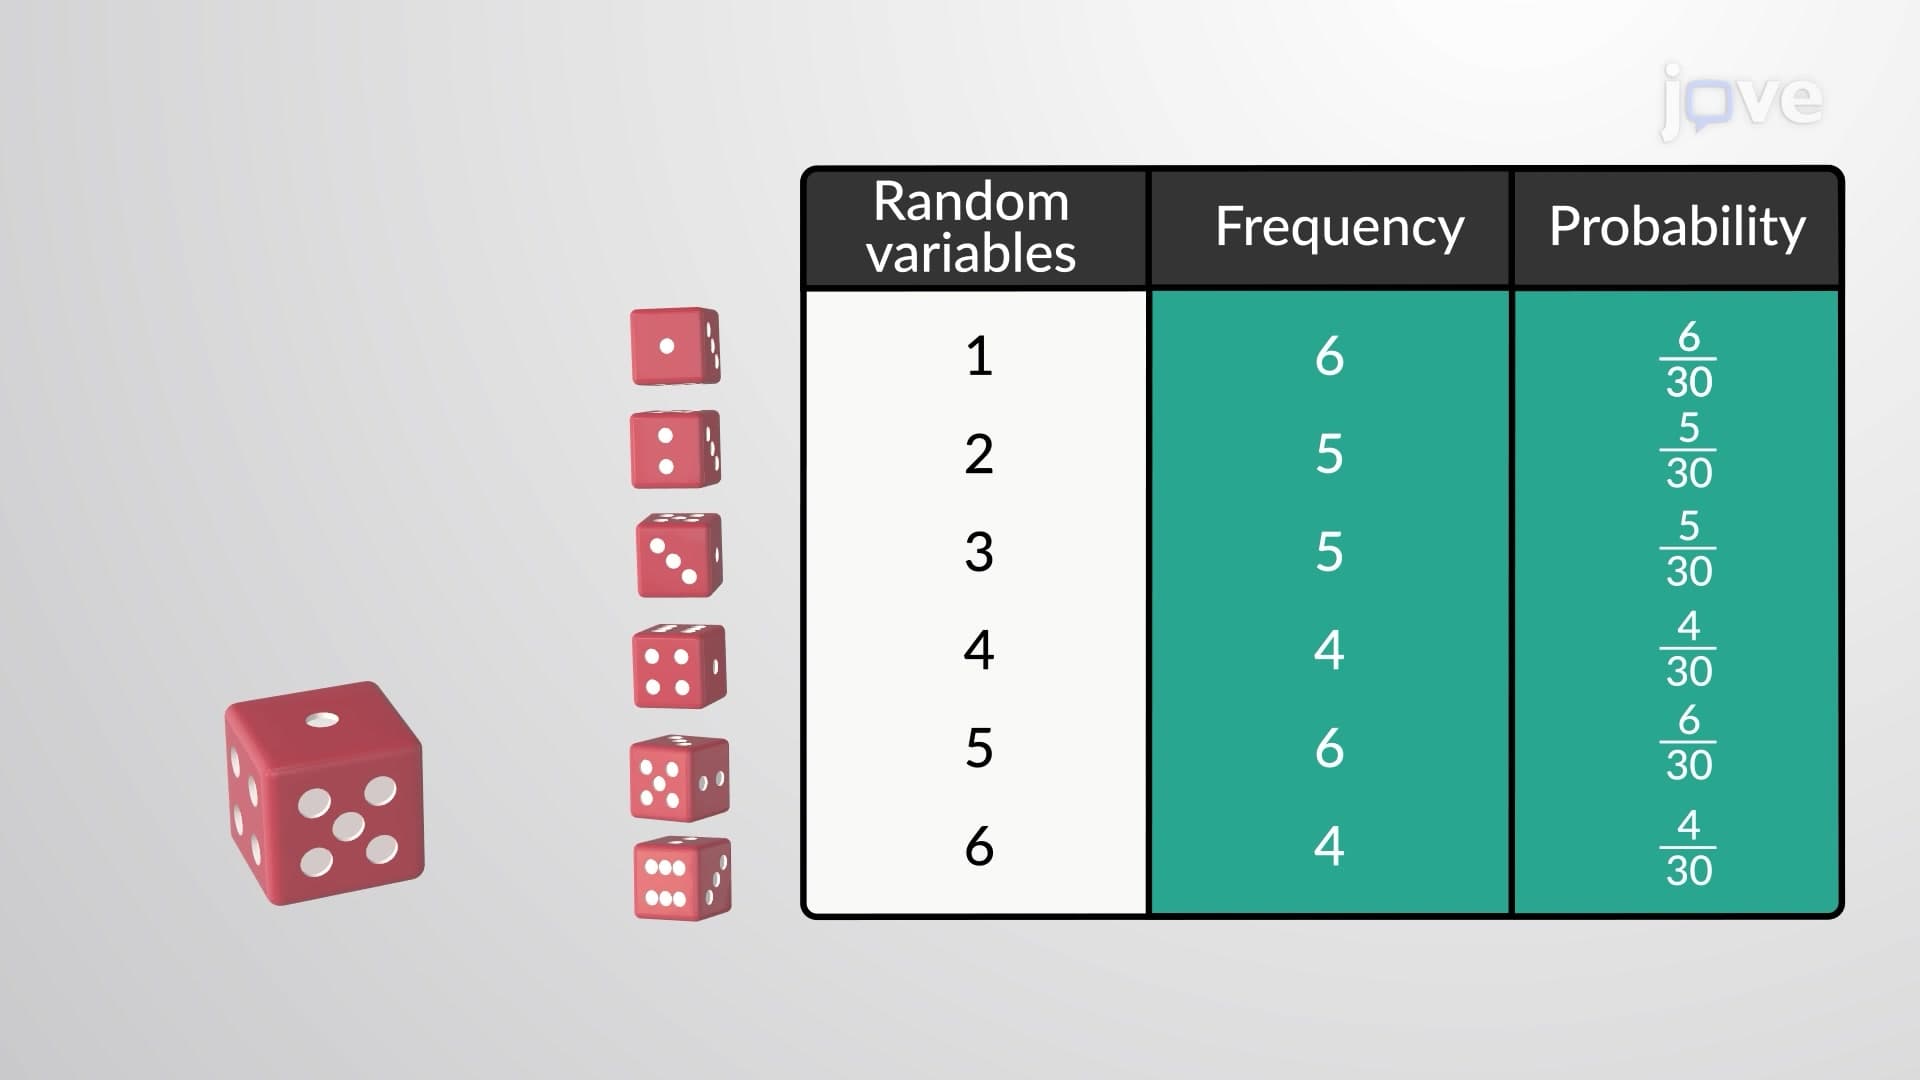

Video Summary: What are Random Variables
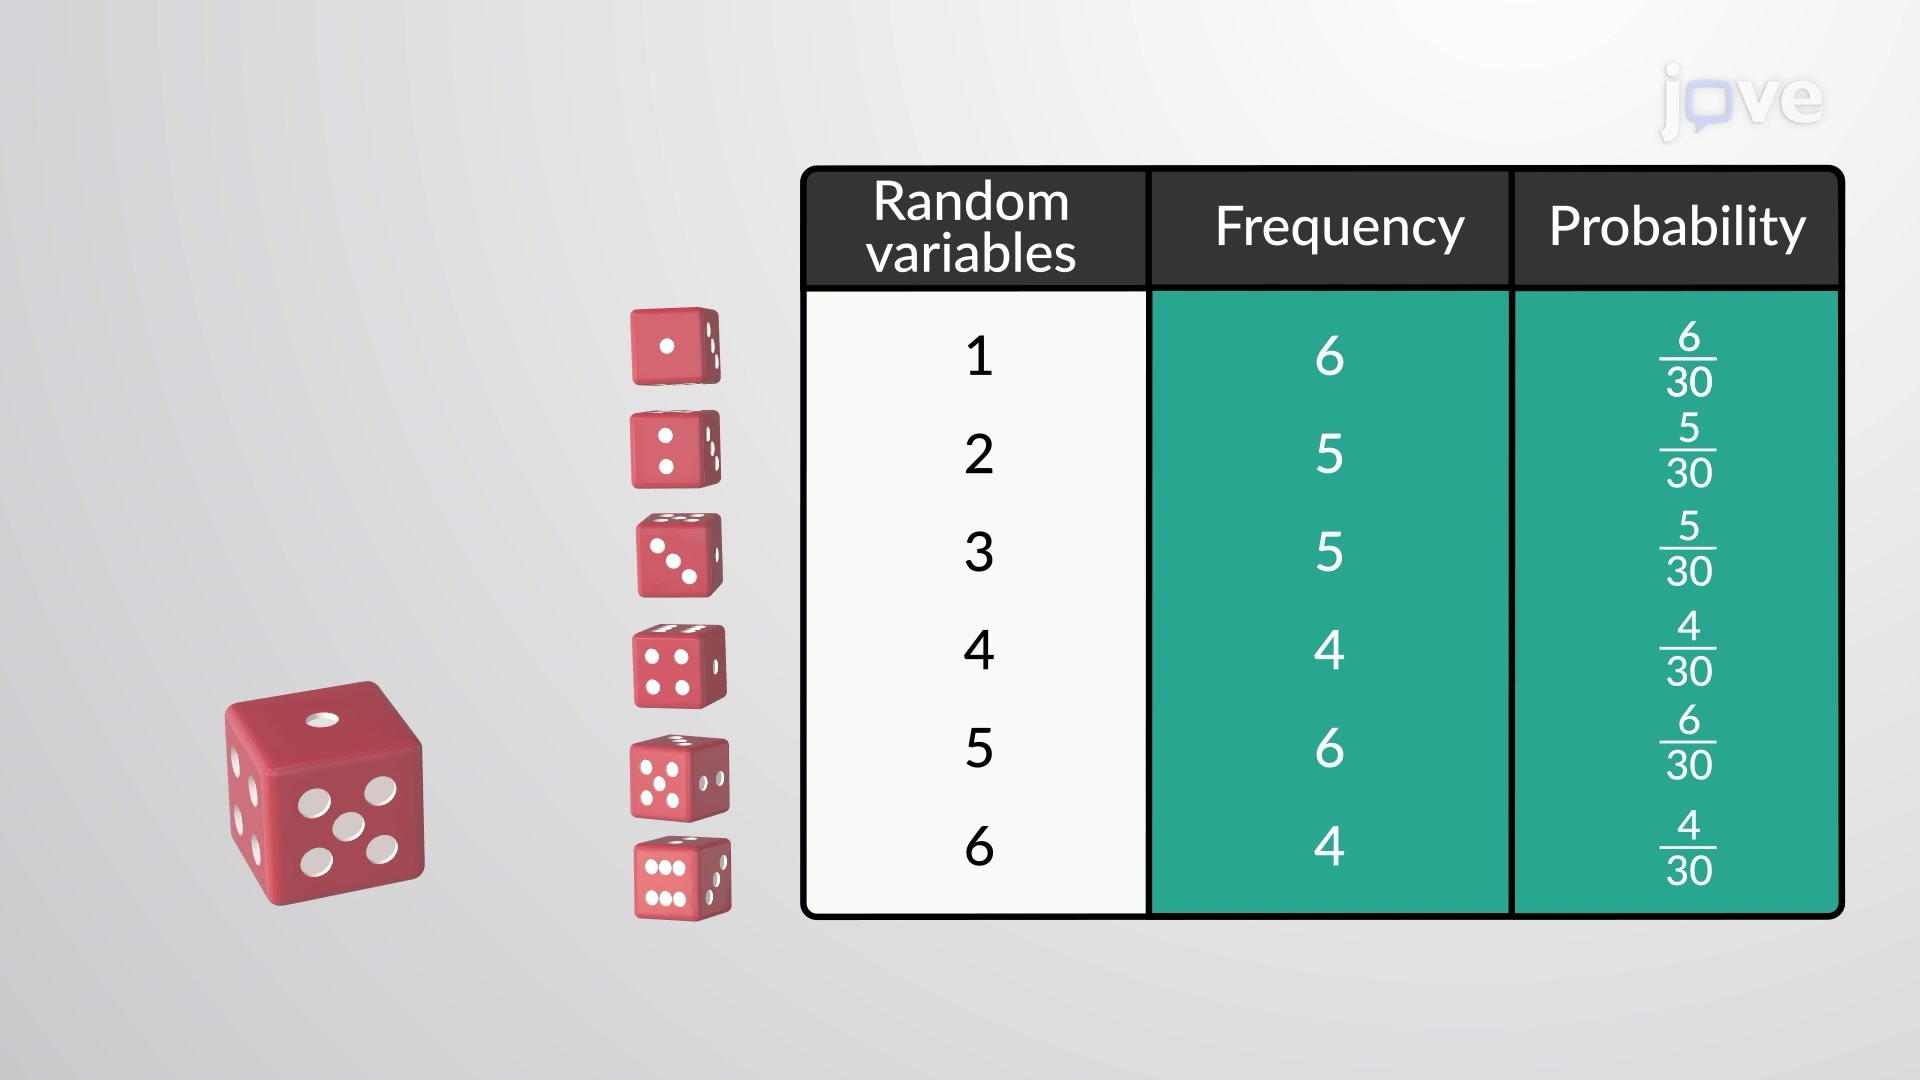
Did you know that the probability of winning the Powerball jackpot is approximately 1 in 292 million? Random variables are mathematical functions that assign numerical values to the outcomes of chance events, like rolling dice or lottery drawings. Whether you're analyzing test scores across US high schools or predicting stock market fluctuations, random variables provide the foundation for understanding uncertainty in data. Watch the full video on JoVE Coach to master this concept with expert-led visuals and step-by-step explanations.
Random variables serve as the bridge between real-world uncertainty and mathematical analysis. Unlike regular algebraic variables that have fixed values, random variables represent quantities whose values depend entirely on chance. Think of them as functions that assign numbers to every possible outcome of an experiment or observation.
In formal terms, a random variable X is a function that maps each outcome in a sample space to a real number. For instance, if you're studying SAT scores across California high schools, each student's score represents a value of the random variable "SAT Math Score." This mathematical framework allows statisticians to analyze patterns, make predictions, and draw meaningful conclusions from uncertain data.
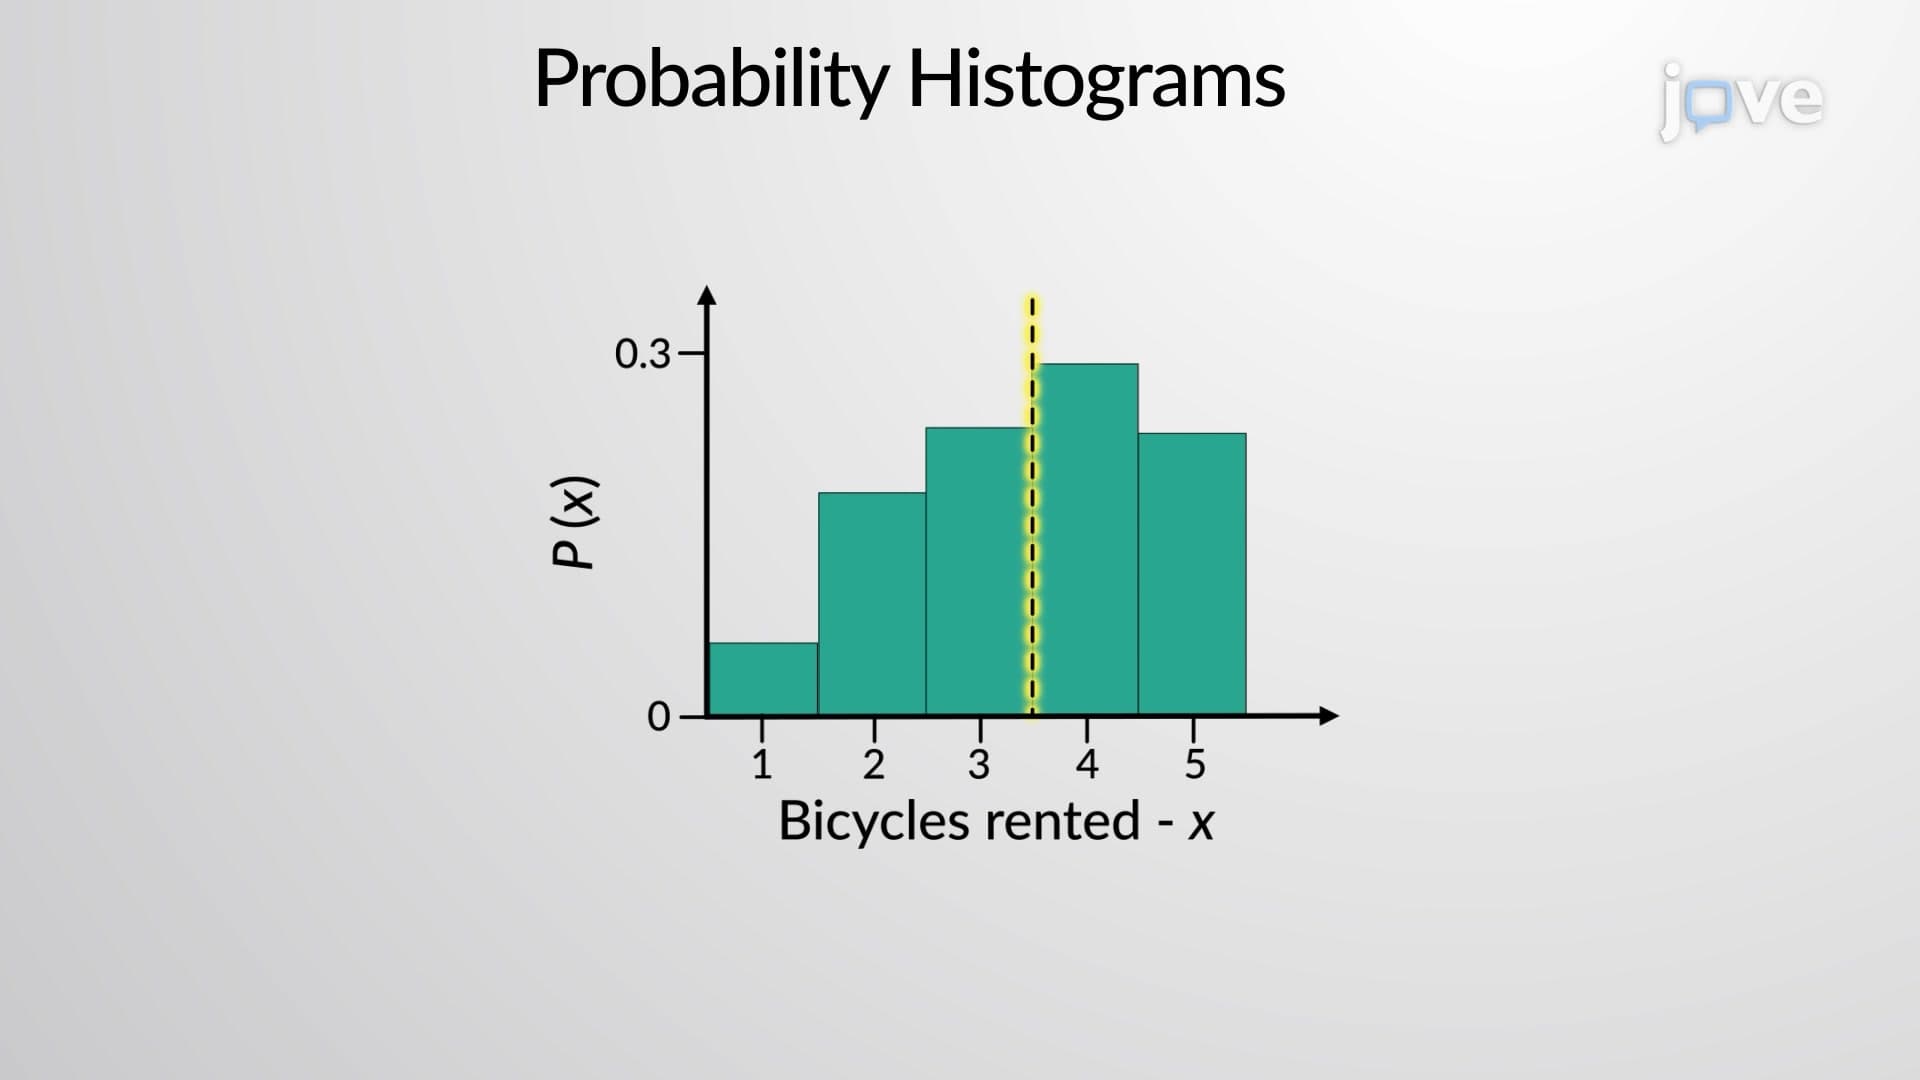
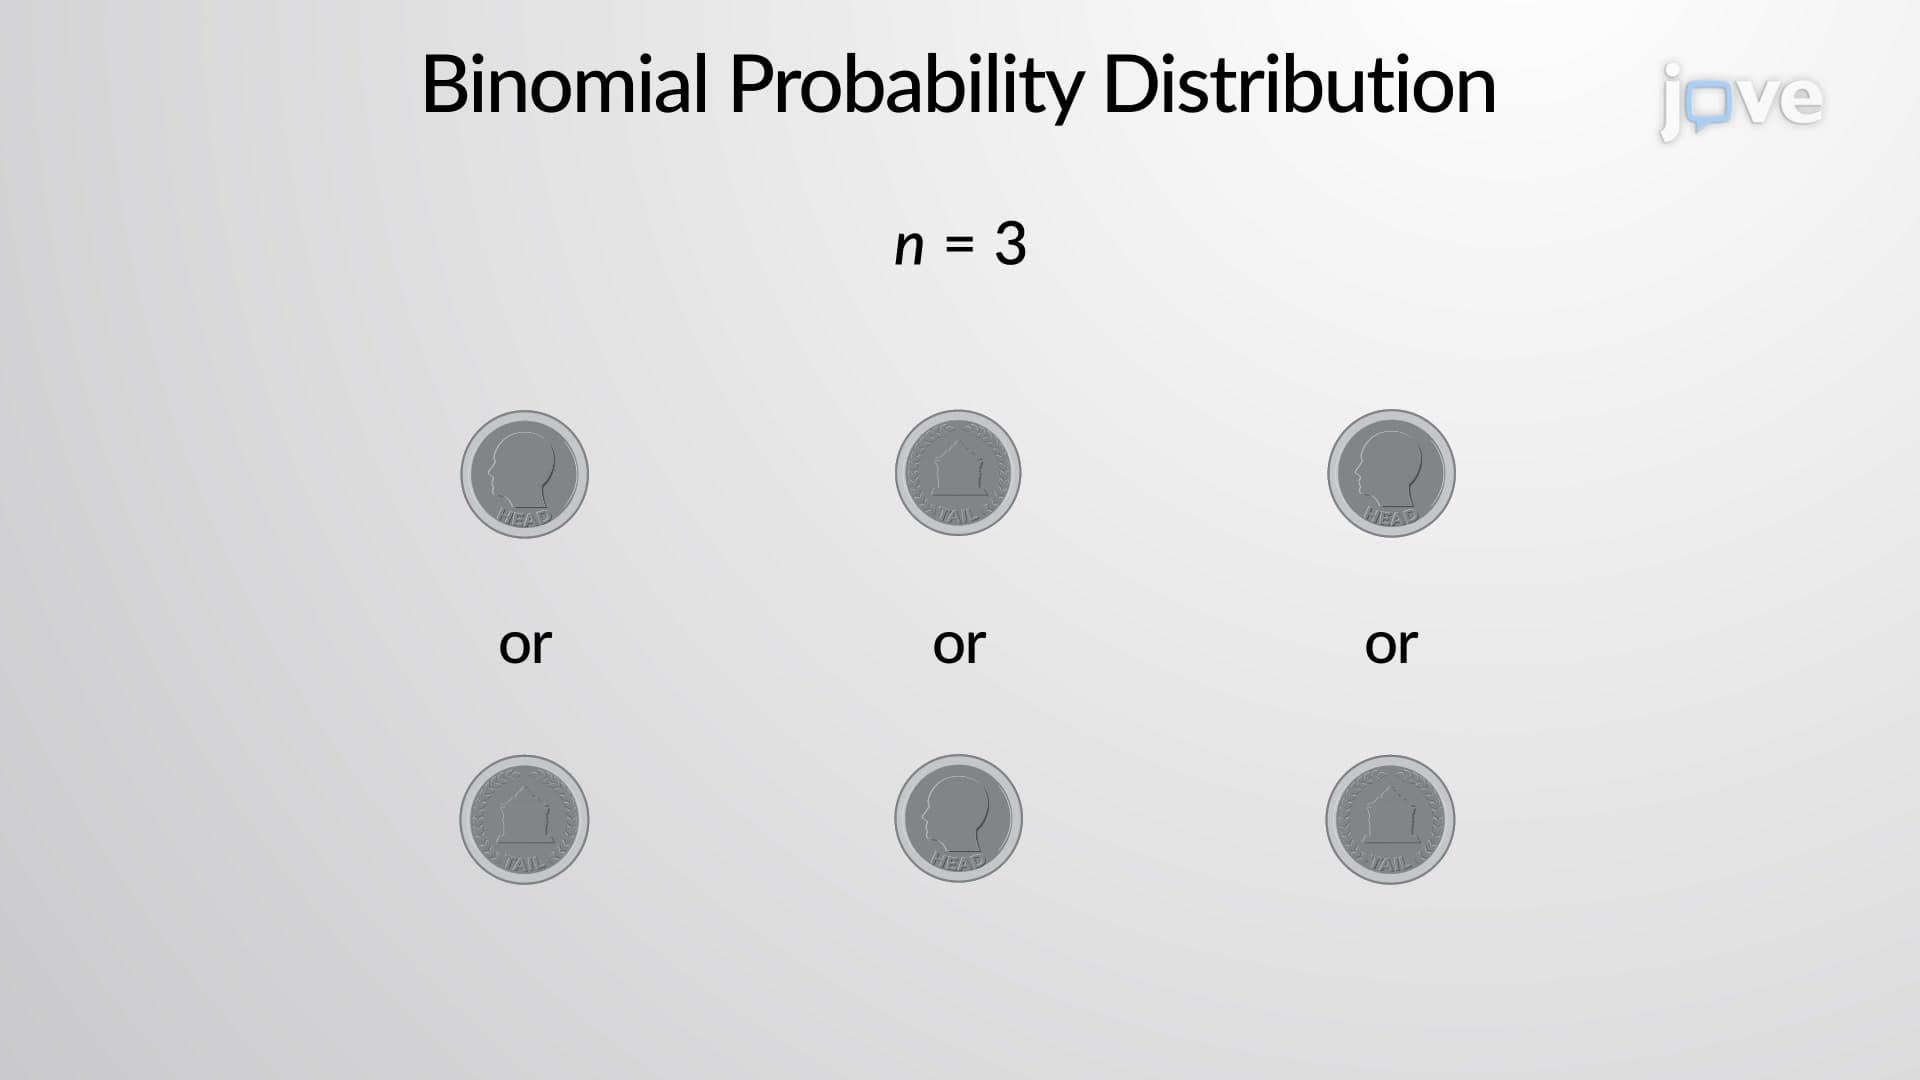
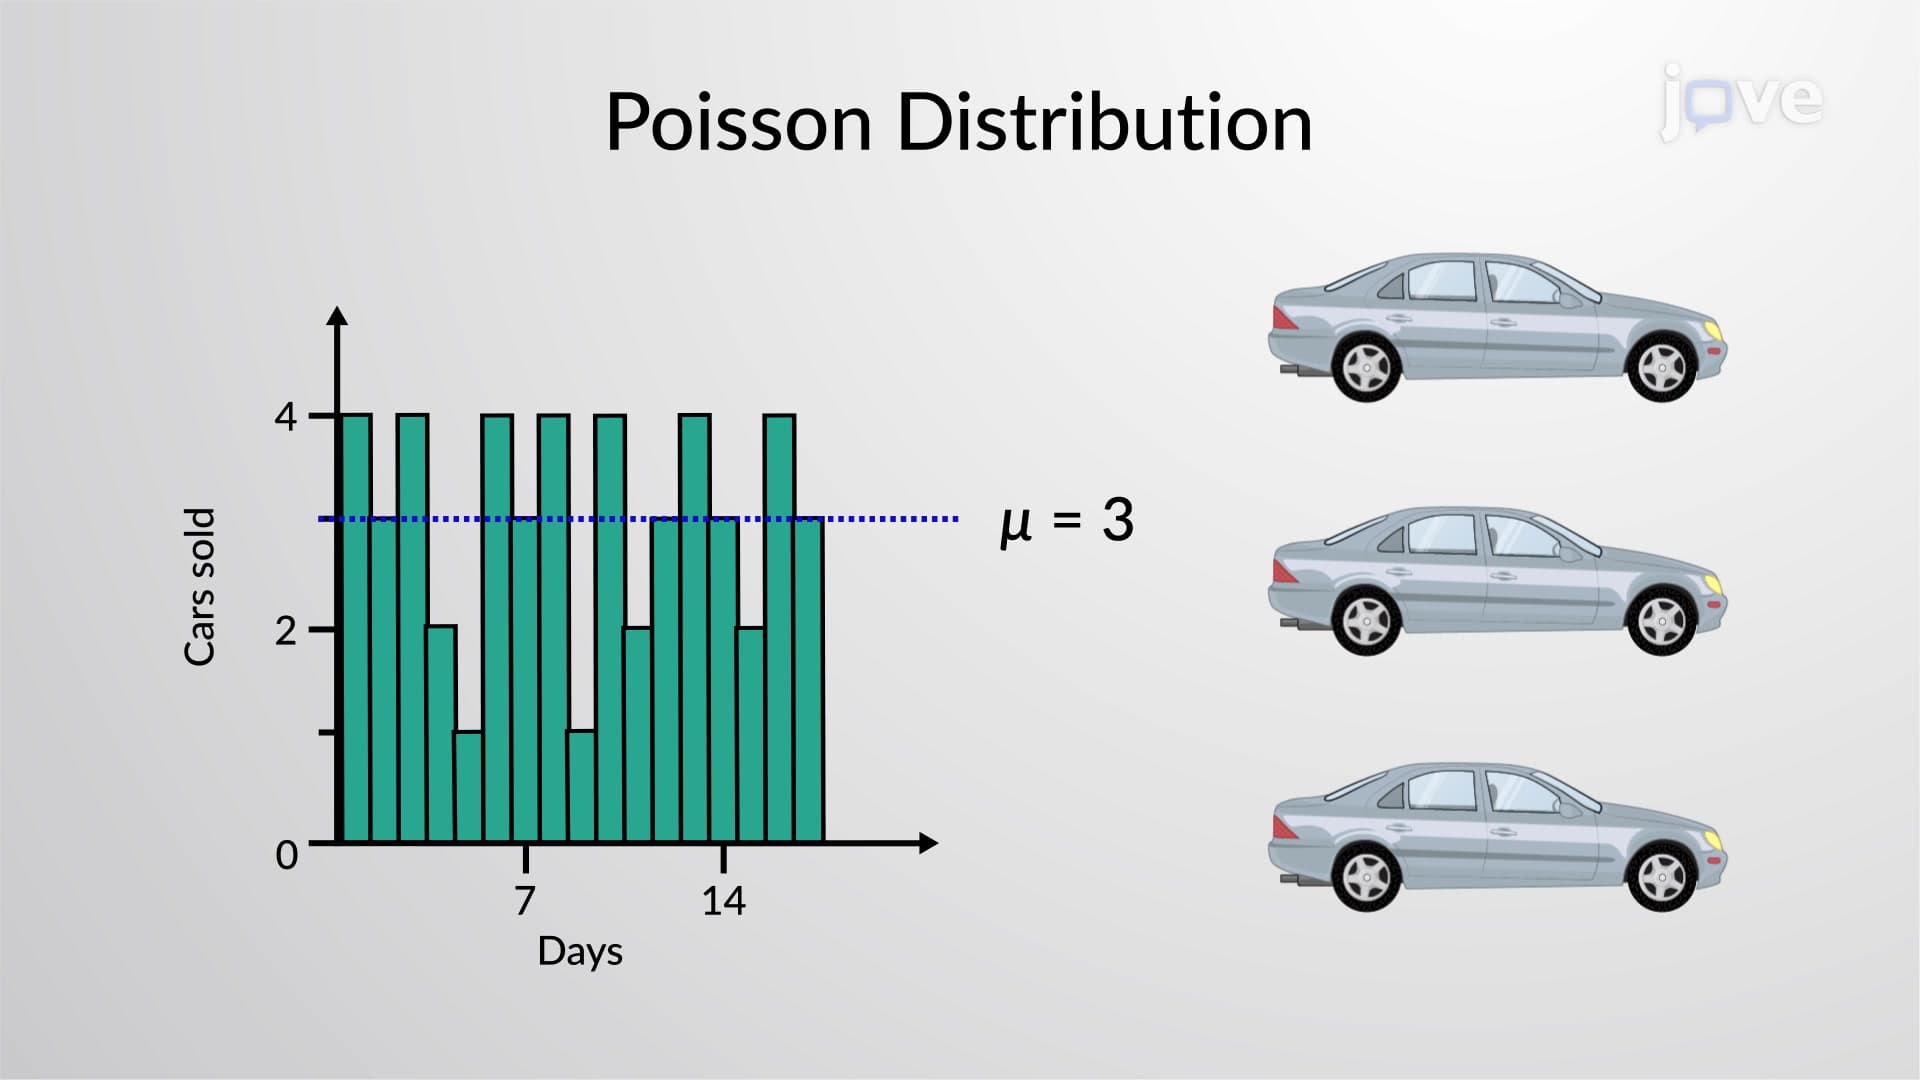
The classification of random variables into discrete and continuous types fundamentally shapes how we analyze data. Discrete random variables take on countable values, often resulting from counting processes. Examples include the number of cars passing through a toll booth in an hour, the number of students absent from a college statistics class, or the number of defective smartphones in a batch of 100 units manufactured in Texas.
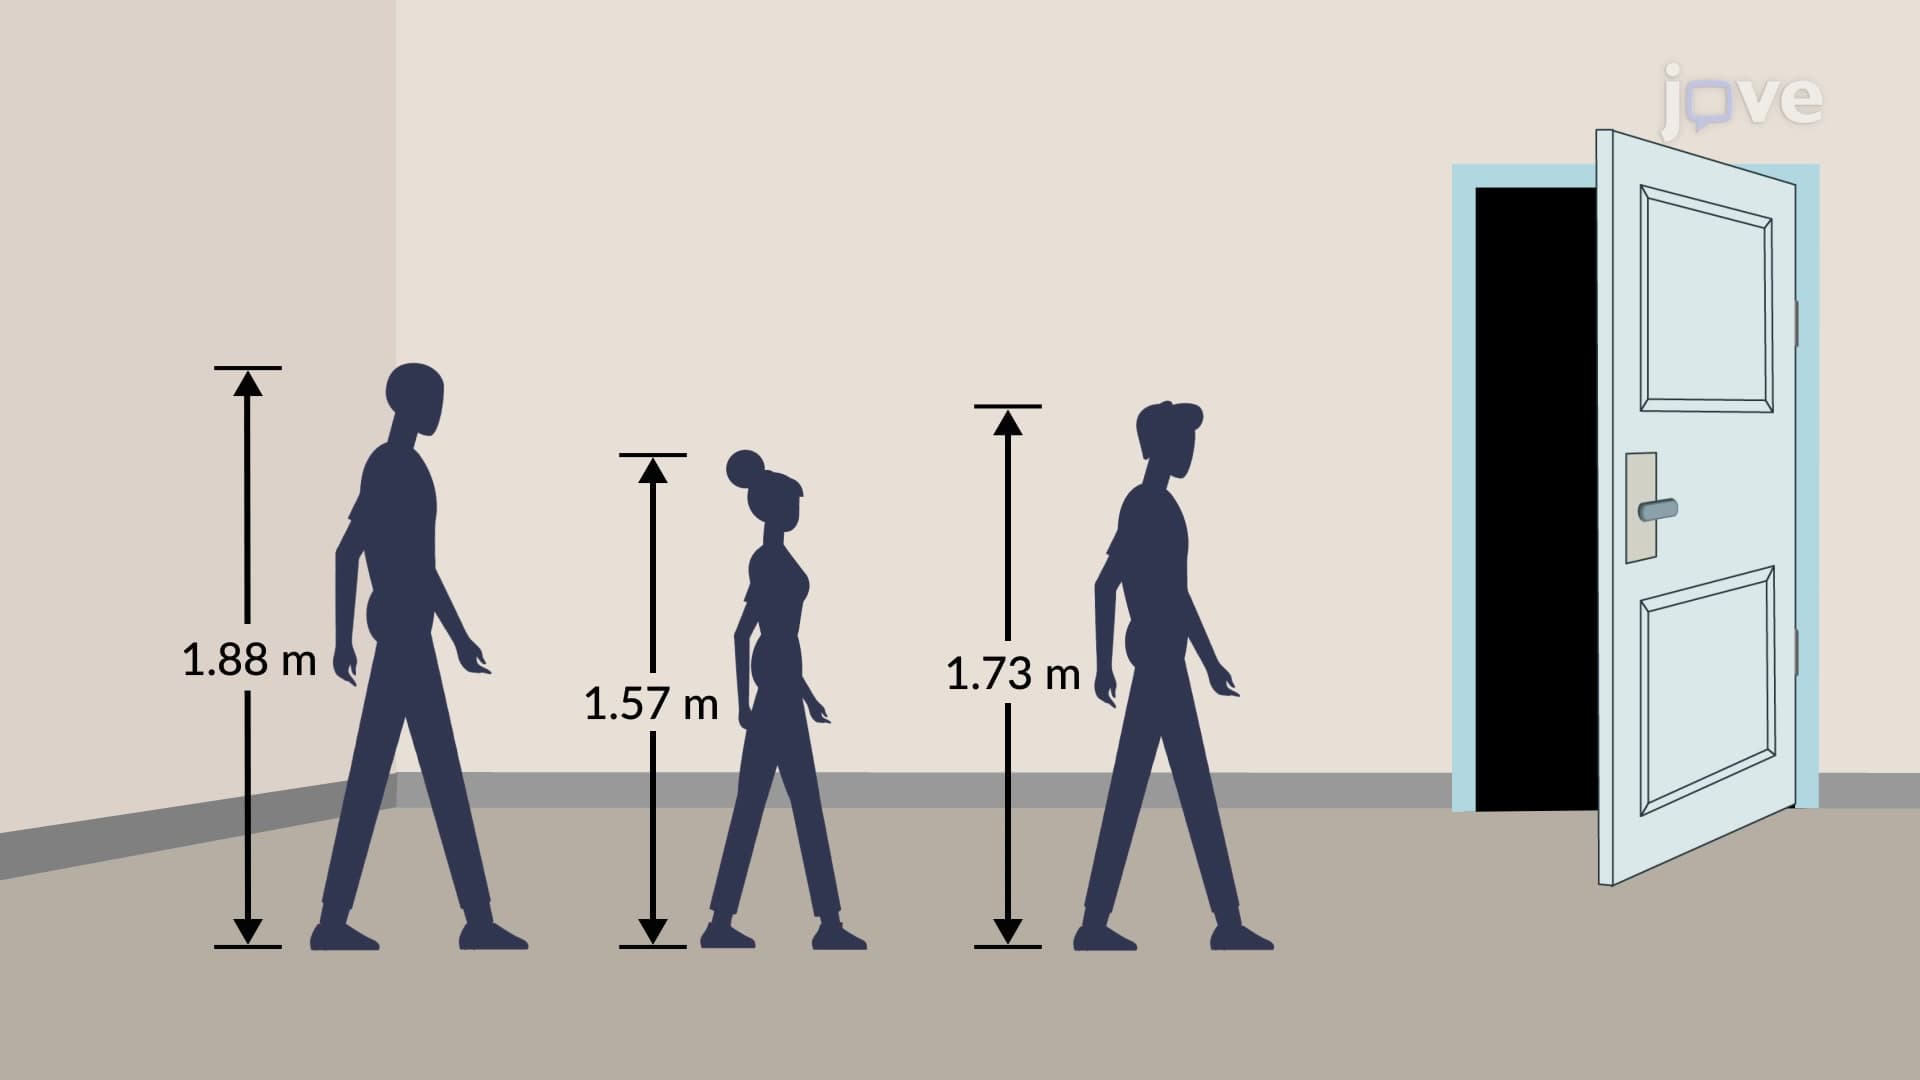
Continuous random variables, conversely, can assume any value within a given range, typically arising from measurement processes. These include variables like the exact time it takes to complete the Boston Marathon, the precise weight of newborns in a Chicago hospital, or the exact amount of rainfall in Miami during hurricane season. The key distinction lies in whether you can list all possible values (discrete) or whether the values form an unbroken continuum (continuous).
Random variables appear extensively in AP Statistics, college-level probability courses, and standardized tests like the MCAT. In medical research, discrete random variables might represent the number of patients responding positively to a new treatment, while continuous variables could measure blood pressure readings or drug concentration levels in plasma.
Quality control engineers at companies like Ford or Apple use discrete random variables to count defective products per production batch, while continuous random variables help monitor precise measurements like component dimensions or chemical concentrations. Understanding these applications proves crucial for students pursuing STEM careers or anyone preparing for graduate school entrance exams.
Statisticians typically denote random variables with uppercase letters (X, Y, Z) and their specific values with lowercase letters (x, y, z). This notation becomes essential when expressing probability statements like P(X = 3) for discrete variables or P(a < X < b) for continuous variables. These concepts directly connect to probability distributions, which describe how likely different values are for any given random variable, forming the foundation for inferential statistics and hypothesis testing covered in advanced coursework.
Related Micro-courses