Loading video…


 14 Concepts
 173.2K views

Video Summary: What Is Sampling Distribution
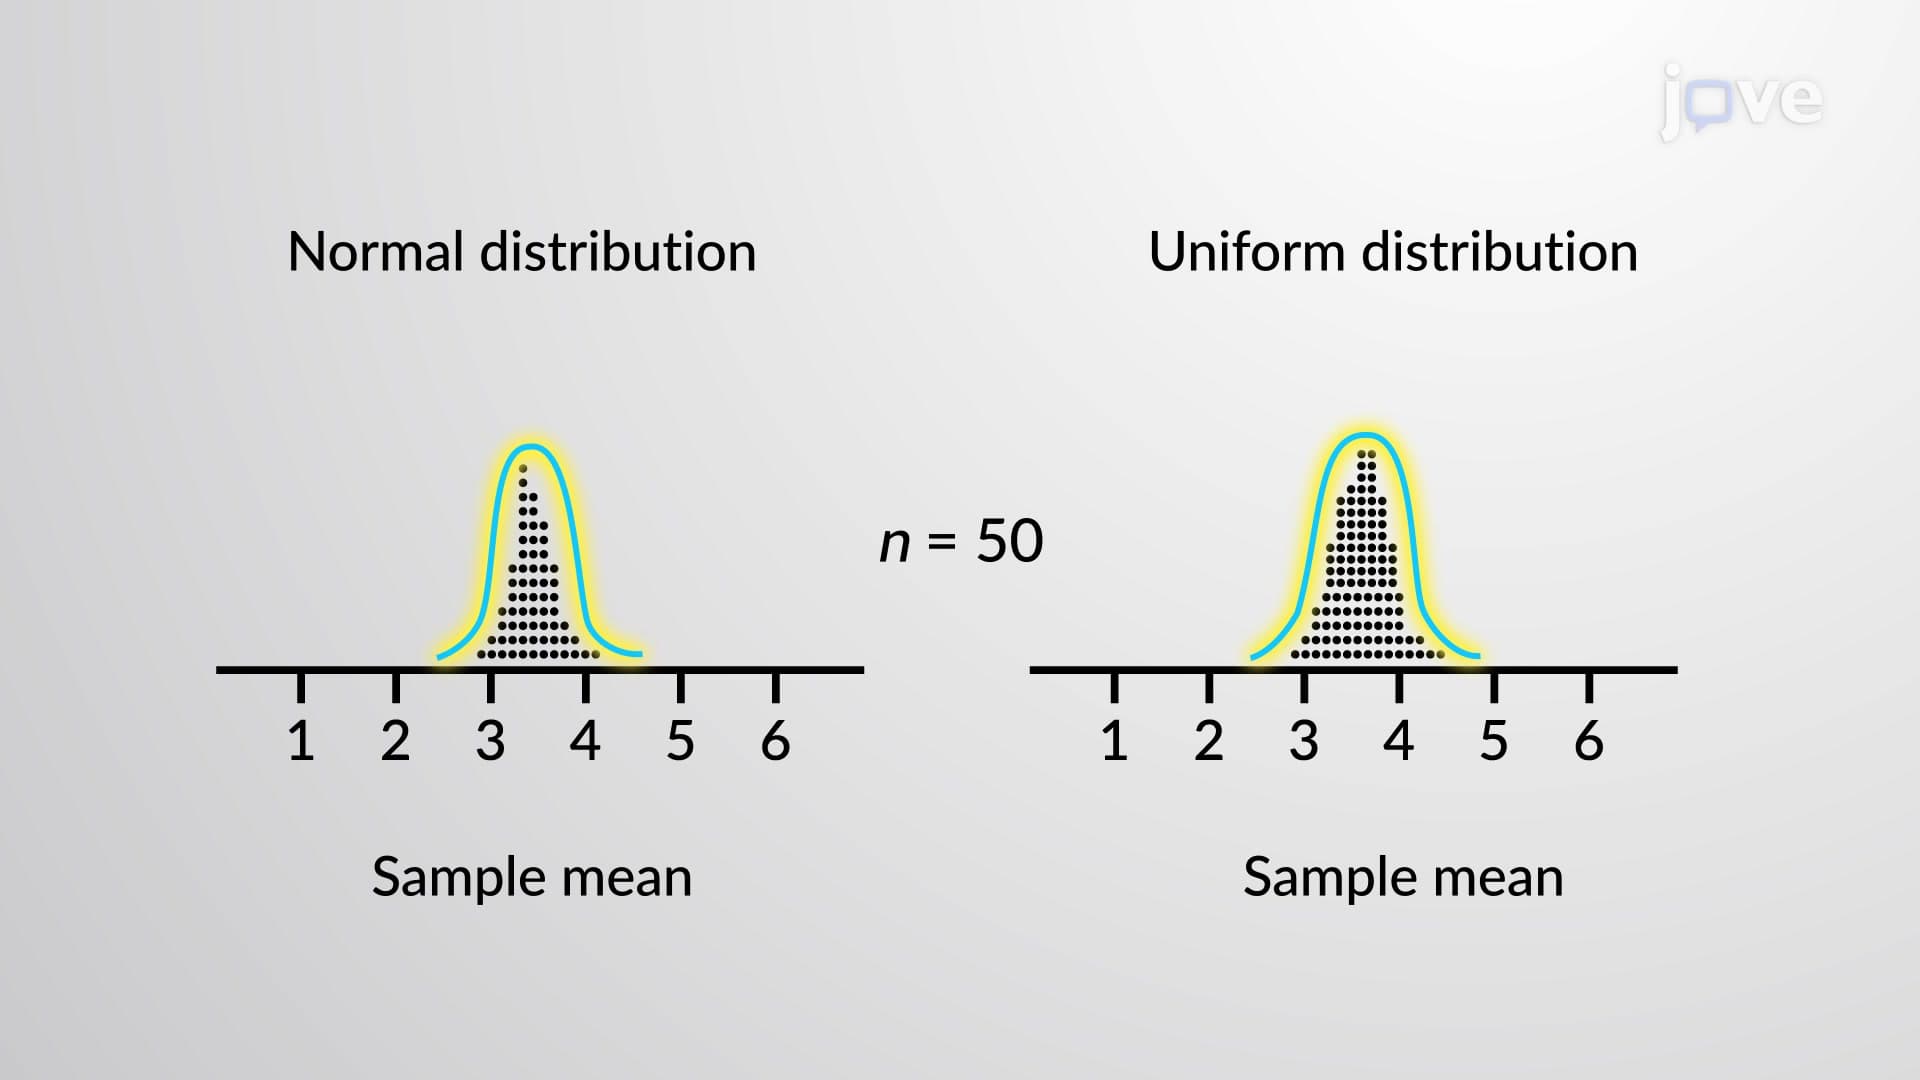
Ever wonder how pollsters predict election results from surveying just 1,000 Americans out of 330 million? Sampling distribution is the statistical foundation that makes this possible. When researchers repeatedly take samples from a population-like surveying different groups of voters before a presidential election-and calculate sample means, these means form their own predictable pattern. This distribution of sample statistics follows near-normal patterns, with larger sample sizes producing more accurate population estimates. Watch the full video on JoVE Coach to master this concept with expert-led visuals and step-by-step explanations.
A sampling distribution represents the probability distribution of a statistic calculated from all possible samples of a given size drawn from a population. Unlike a single sample that gives us one data point, sampling distribution shows us the pattern of variation we'd expect if we repeated our sampling process thousands of times. This concept forms the theoretical backbone of inferential statistics, enabling researchers to make confident predictions about entire populations based on limited sample data.
The sampling distribution exhibits several predictable characteristics that make statistical inference possible. For sample means, the distribution centers around the true population mean (μ) with standard deviation equal to the population standard deviation divided by the square root of sample size (σ/√n). This relationship, known as the standard error, demonstrates why larger samples produce more precise estimates-the sampling distribution becomes narrower as sample size increases.
Sample variances follow a different pattern, creating right-skewed distributions that approach the population variance as an average. Sample proportions, commonly used in survey research and clinical trials, generate sampling distributions that approximate normal curves when sample sizes meet the np ≥ 5 and n(1-p) ≥ 5 conditions.
Sampling distributions power critical decisions across American institutions. The Bureau of Labor Statistics uses these principles when calculating unemployment rates from monthly surveys of 60,000 households, knowing their sample proportion creates a predictable distribution around the true national rate. Similarly, pharmaceutical companies conducting FDA clinical trials rely on sampling distribution theory to determine appropriate sample sizes for drug efficacy studies.
In quality control, manufacturers like Boeing use sampling distributions to monitor production processes. By repeatedly sampling aircraft components and calculating defect rates, they can detect when production shifts away from acceptable standards. The predictable nature of sampling distributions allows them to set control limits and maintain safety standards.
Sampling distribution mastery proves essential for success on standardized exams. AP Statistics extensively tests these concepts, particularly the Central Limit Theorem's application to sampling distributions of means. College statistics courses build upon this foundation, connecting sampling distributions to confidence interval construction and hypothesis testing procedures.
Pre-med students encounter sampling distributions on the MCAT's Psychological, Social, and Biological Foundations section when analyzing research study designs. Similarly, nursing students face these concepts on the NCLEX-RN when interpreting clinical research findings and evidence-based practice guidelines.
Related Micro-courses