Loading video…

 14 Concepts
 173.2K views

Video Summary: What Is Probability in Statistics
Did you know that the National Weather Service's 70% chance of rain prediction doesn't mean it will rain 70% of the day? Probability in statistics forms the mathematical foundation for understanding uncertainty and making predictions from data. From predicting election outcomes to analyzing clinical trial results, What is Probability in Statistics reveals how we quantify the likelihood of events occurring. Consider how meteorologists use probability models to forecast weather patterns across the United States, combining historical data with current atmospheric conditions. Watch the full video on JoVE Coach to master this concept with expert-led visuals and step-by-step explanations.
Probability in statistics serves as the mathematical language for describing uncertainty and randomness in data analysis. Unlike deterministic mathematics where outcomes are predictable, probability deals with situations where multiple outcomes are possible, each with a measurable likelihood of occurrence. This fundamental concept bridges the gap between theoretical mathematics and practical statistical applications used across industries, from pharmaceutical research to financial markets.
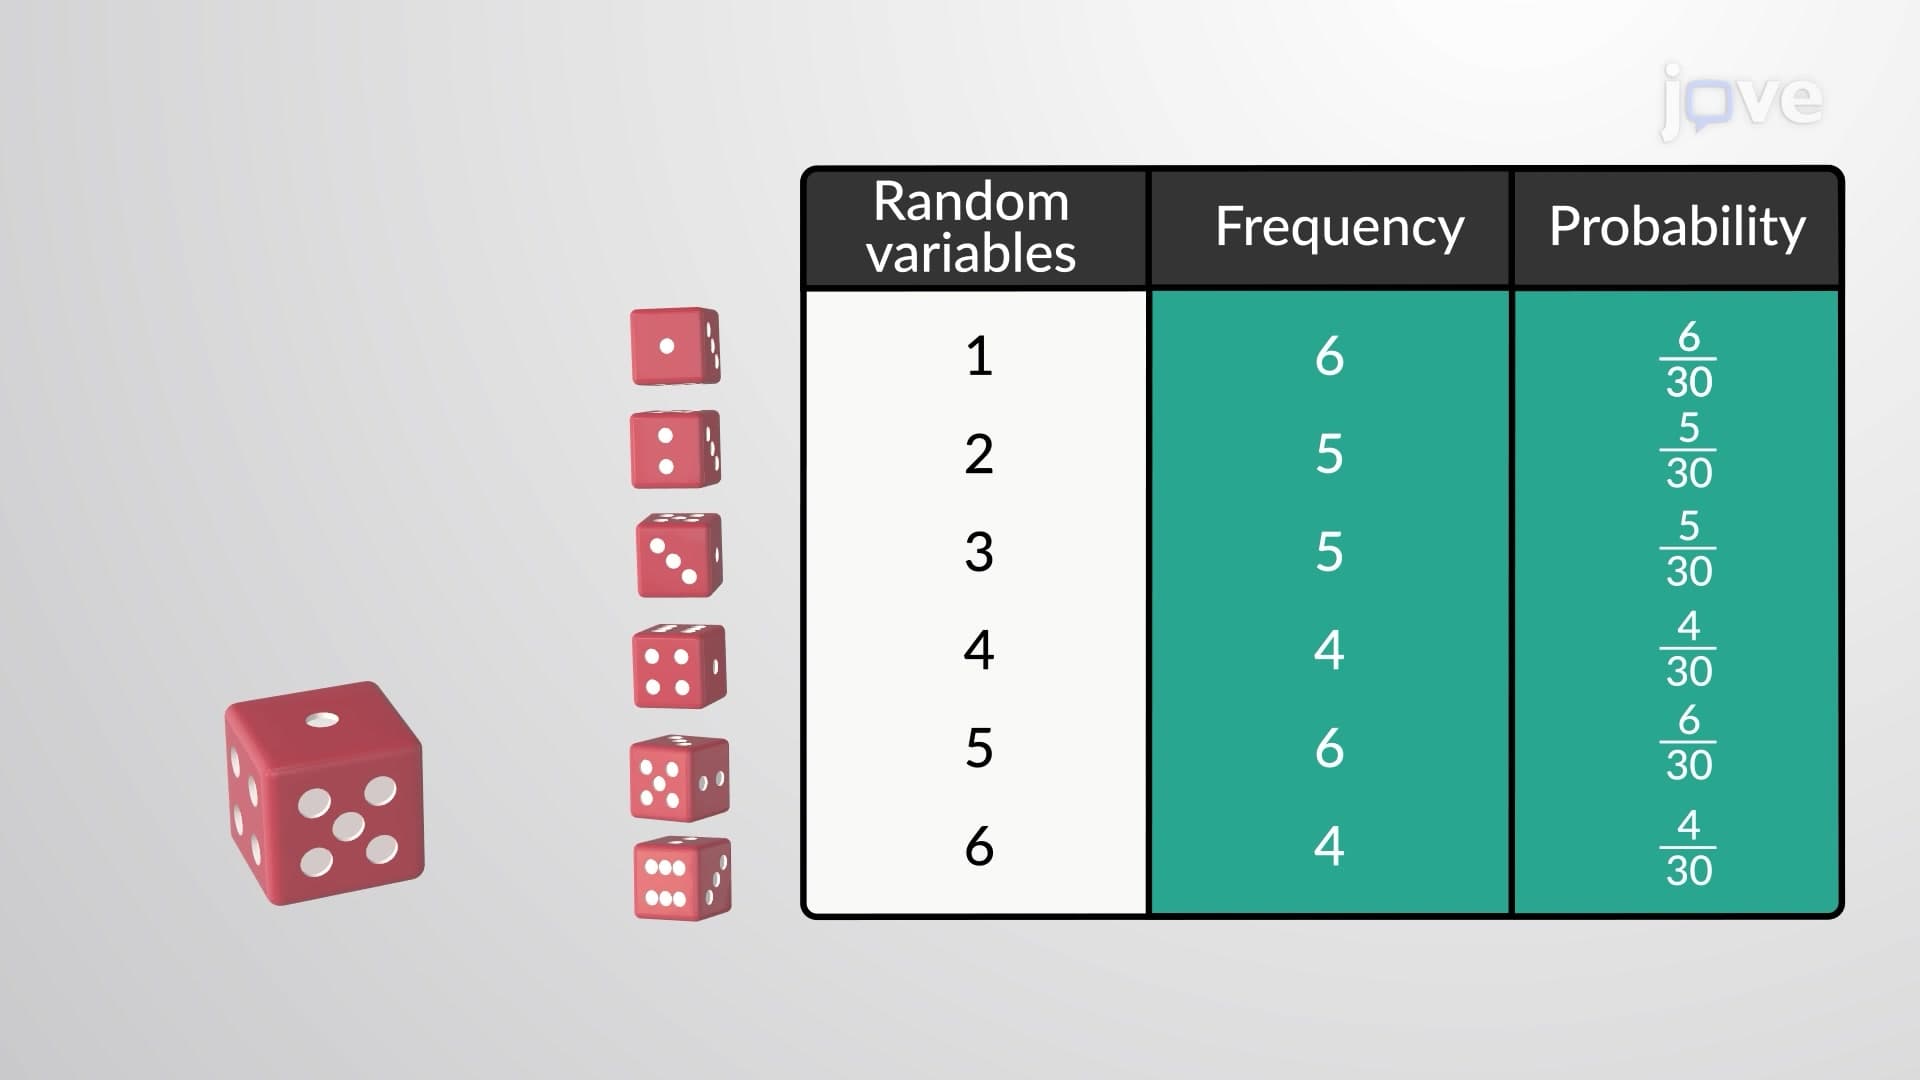
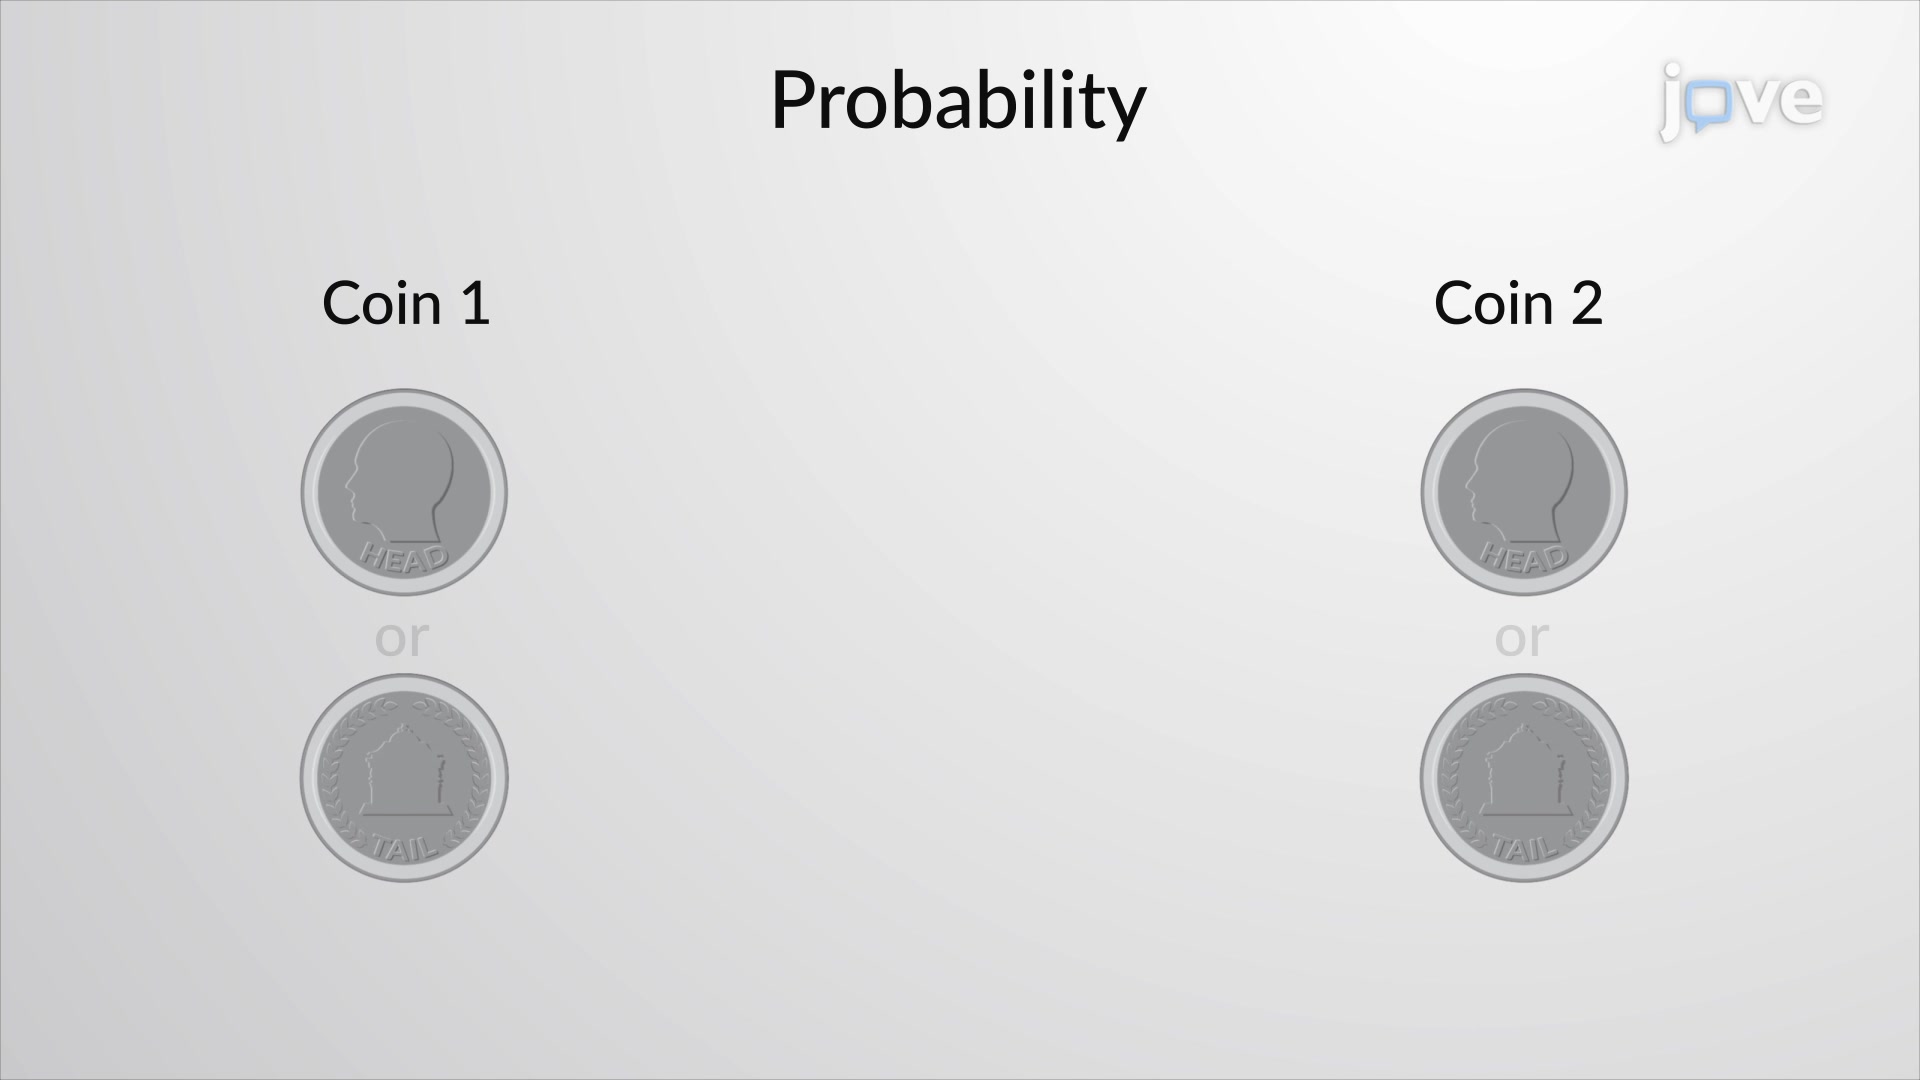
The probability in statistics definition centers on a simple yet powerful formula: the probability of an event equals the number of favorable outcomes divided by the total number of possible outcomes. For example, when analyzing SAT score distributions, statisticians calculate the probability that a randomly selected student scores above 1400 by dividing the number of students scoring above 1400 by the total number of test-takers.
Sample spaces represent all possible outcomes in a probability experiment. In medical research, consider a clinical trial testing a new diabetes medication where each patient can experience one of four outcomes: significant improvement, moderate improvement, no change, or adverse reaction. Each outcome represents a simple event, while combinations like "any improvement" represent compound events.
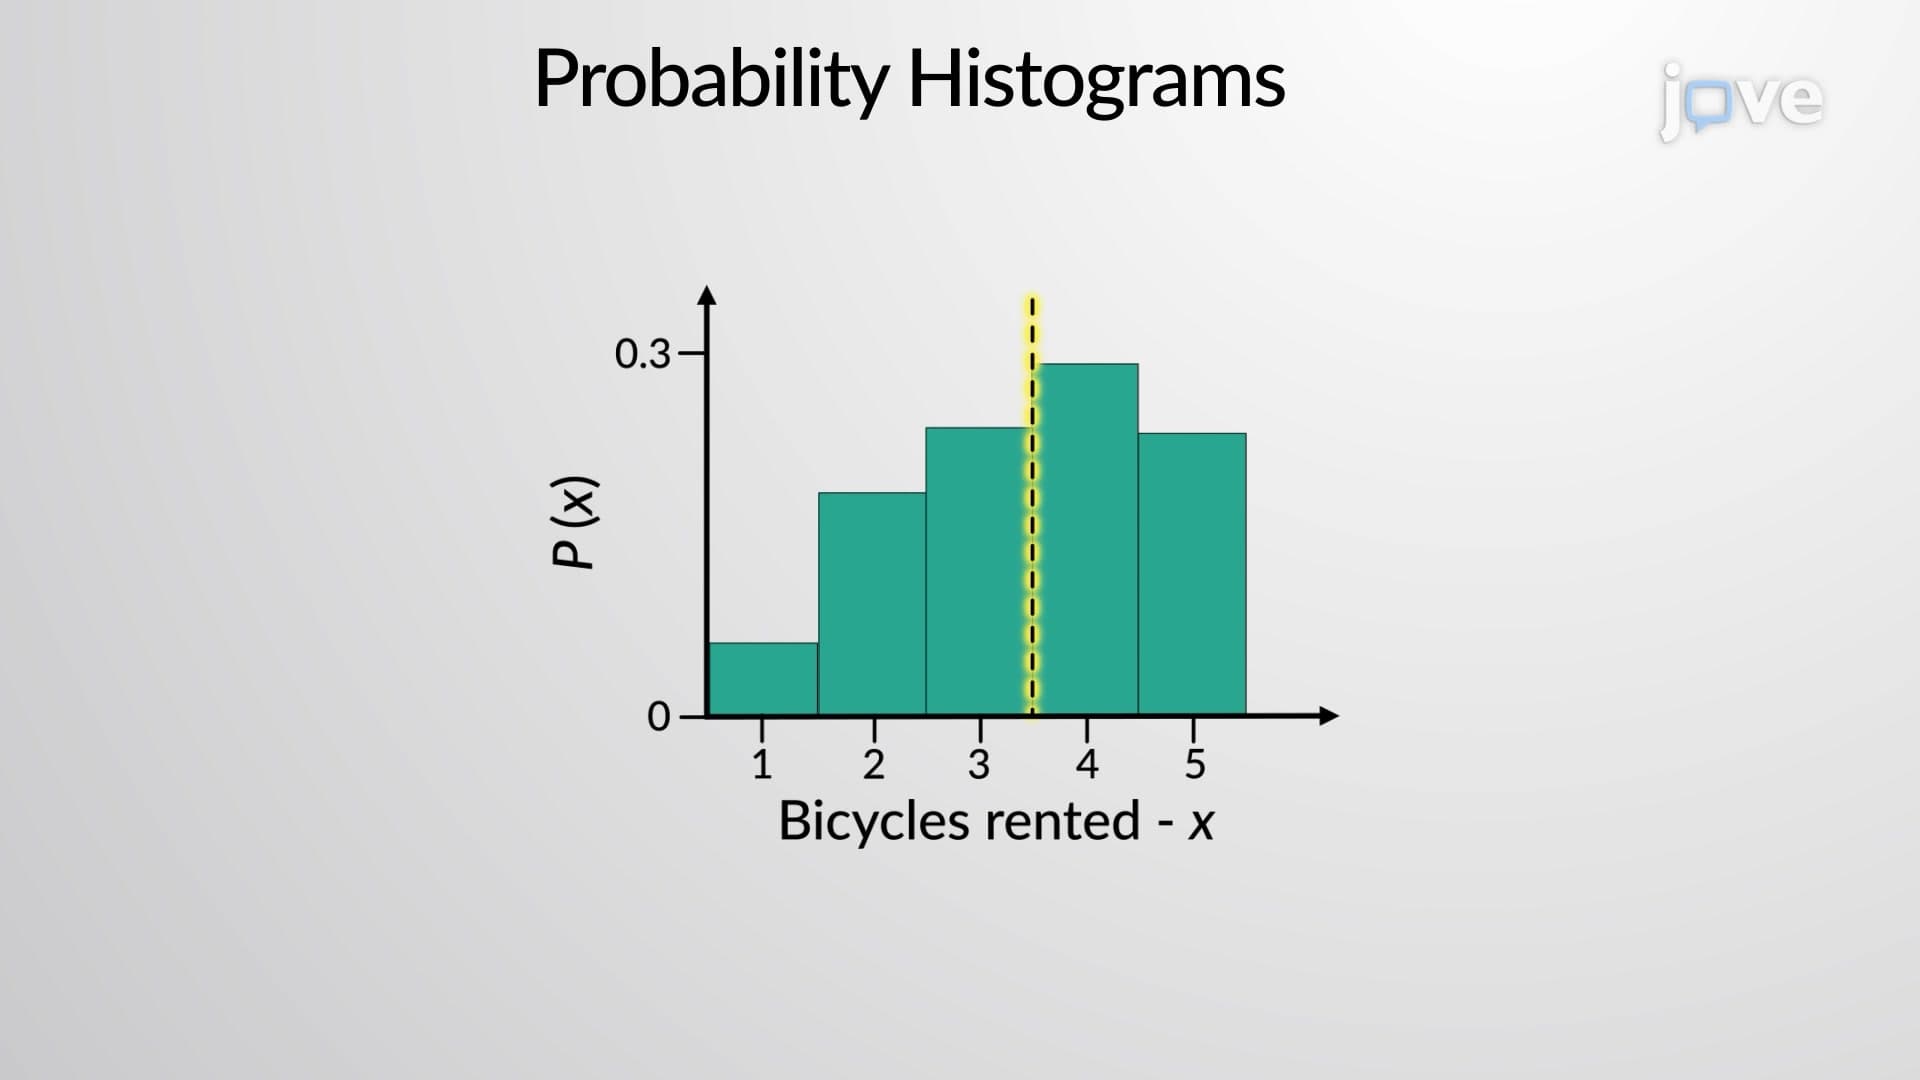
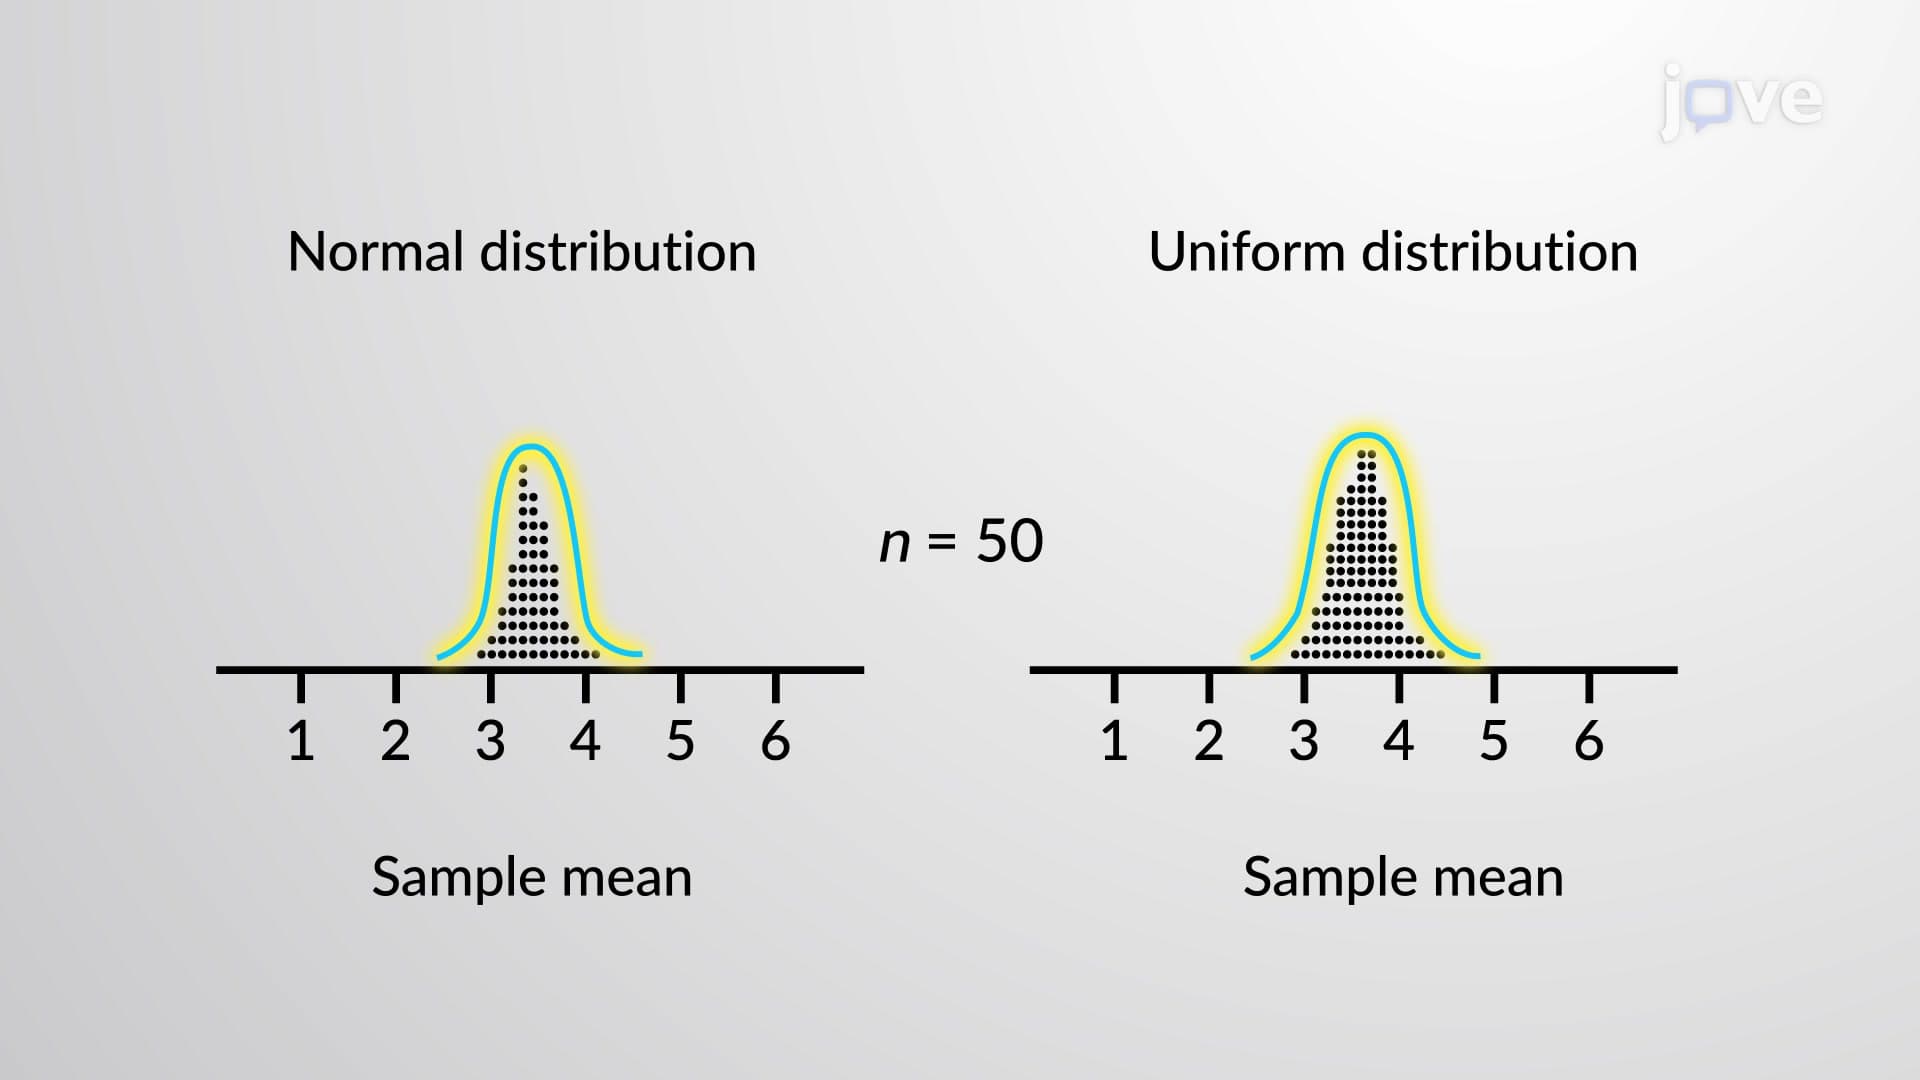
Understanding probability in statistics extends beyond single events to probability distributions-mathematical functions describing how probabilities are distributed across all possible outcomes. The normal distribution, fundamental to AP Statistics and college-level courses, appears everywhere from standardized test scores to manufacturing quality control. For instance, the FDA uses probability distributions to establish safety margins for pharmaceutical dosages, ensuring that adverse events occur with acceptably low probability.
Probability in statistics basics form the foundation for hypothesis testing, confidence intervals, and predictive modeling. Insurance companies like State Farm use probability models to calculate premium rates by analyzing historical accident data and demographic factors. Similarly, political pollsters apply probability theory to determine margin of error in election predictions, explaining why a candidate leading by 3% with a ±4% margin of error doesn't guarantee victory.
In academic settings, students encounter probability concepts in AP Statistics exams, where they analyze scenarios like manufacturing defects or survey sampling. College pre-med students later apply these principles in biostatistics courses, calculating the probability of treatment success or disease occurrence rates. The concept also appears in MCAT passages involving experimental design and data interpretation, making mastery essential for medical school admission.
Related Micro-courses