Loading concepts…


15 Concepts
15 Concepts
13 Concepts
11 Concepts
9 Concepts
14 Concepts
11 Concepts
15 Concepts
13 Concepts
7 Concepts
10 Concepts
10 Concepts
22 Concepts
19 Concepts
16 Concepts
16 Concepts
7 Concepts
 15 Concepts
 70K Views
 Popular topics







Statistics distributions form the backbone of inferential statistics, enabling researchers to make reliable conclusions about populations from sample data. The t-distribution chi-square, F distribution, and sampling distribution provide essential tools for hypothesis testing and parameter estimation when normal distribution assumptions cannot be met. JoVE Coach guides students through practical applications in medical research, quality control, and social sciences across US academic curricula.
1. Sampling Distribution and Central Limit Theorem Applications Understanding how sample statistics behave when drawn from populations is crucial for statistical inference. The sampling distribution of sample means approaches normality as sample size increases, regardless of the original population shape. This concept underlies confidence interval construction and hypothesis testing procedures. For example, when studying SAT scores across US high schools, administrators use sampling distributions to estimate population parameters from representative samples, ensuring their conclusions accurately reflect the broader student population.
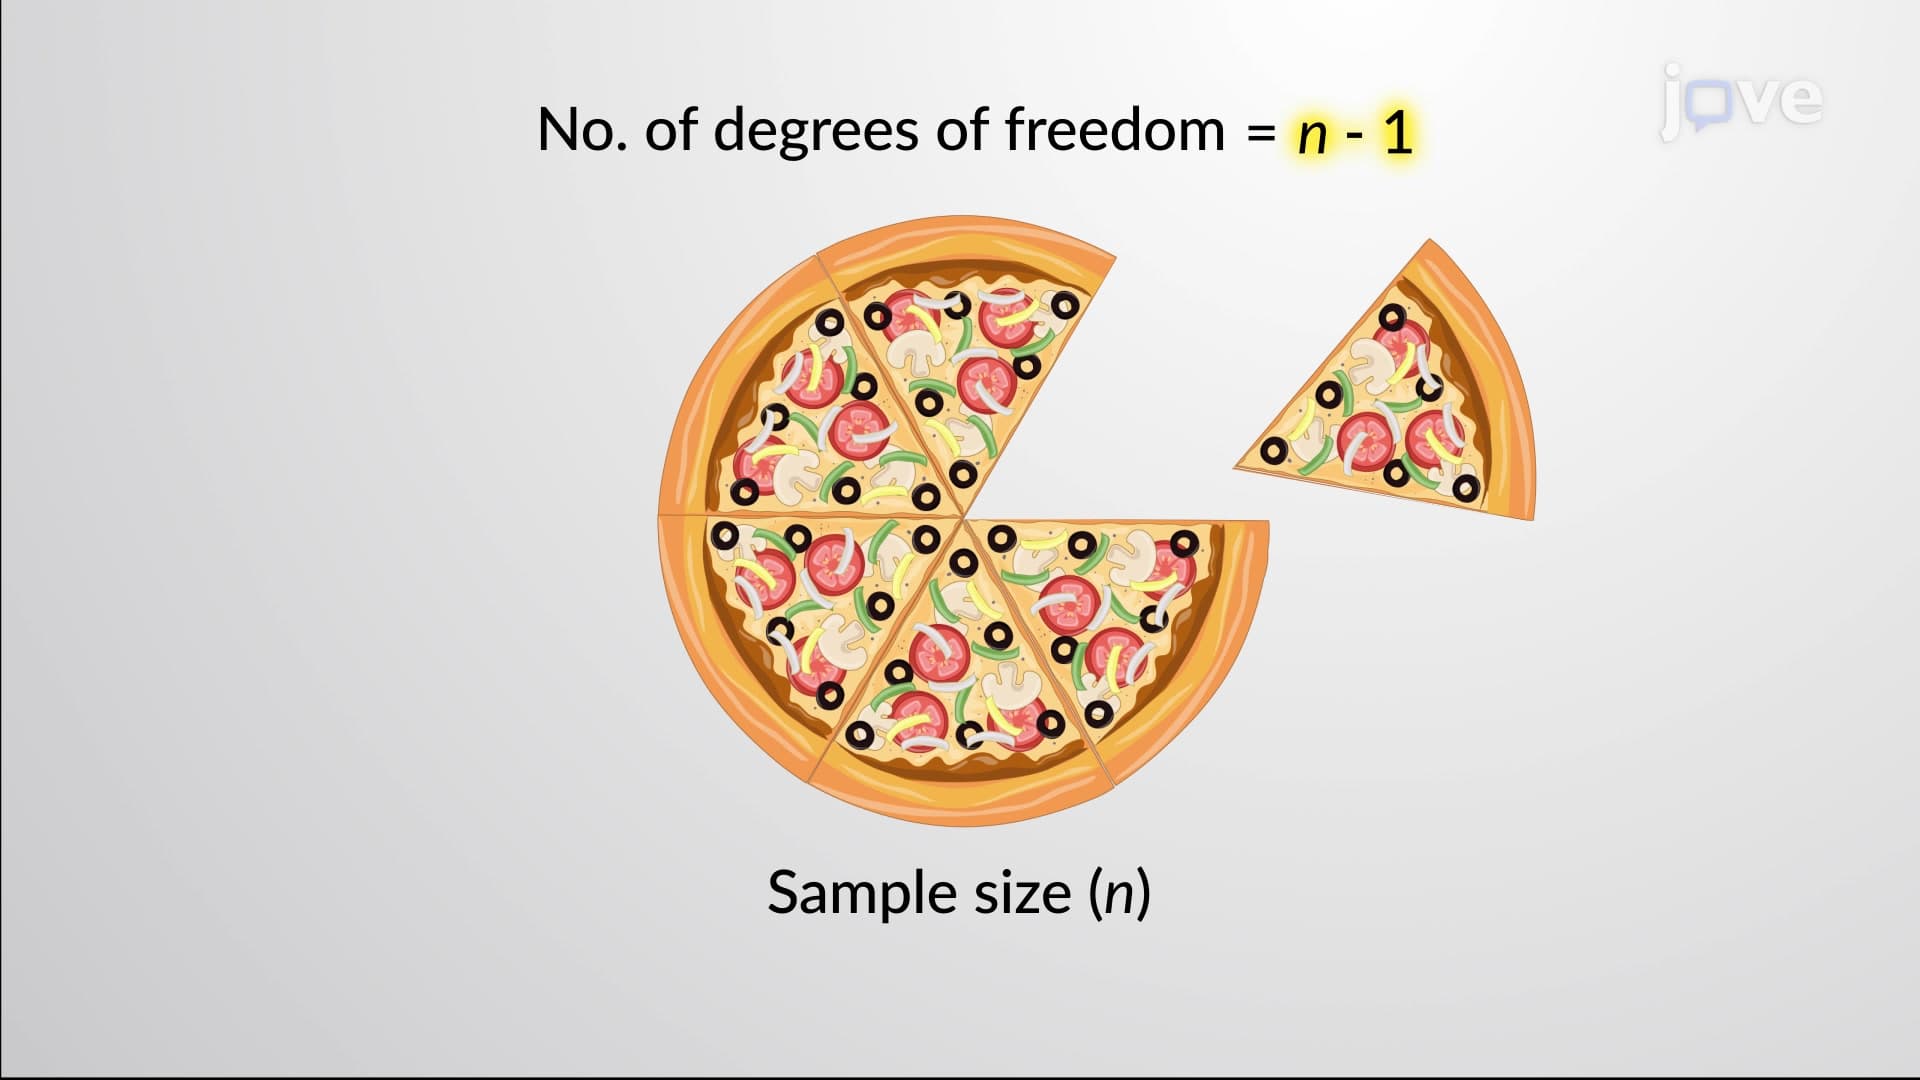
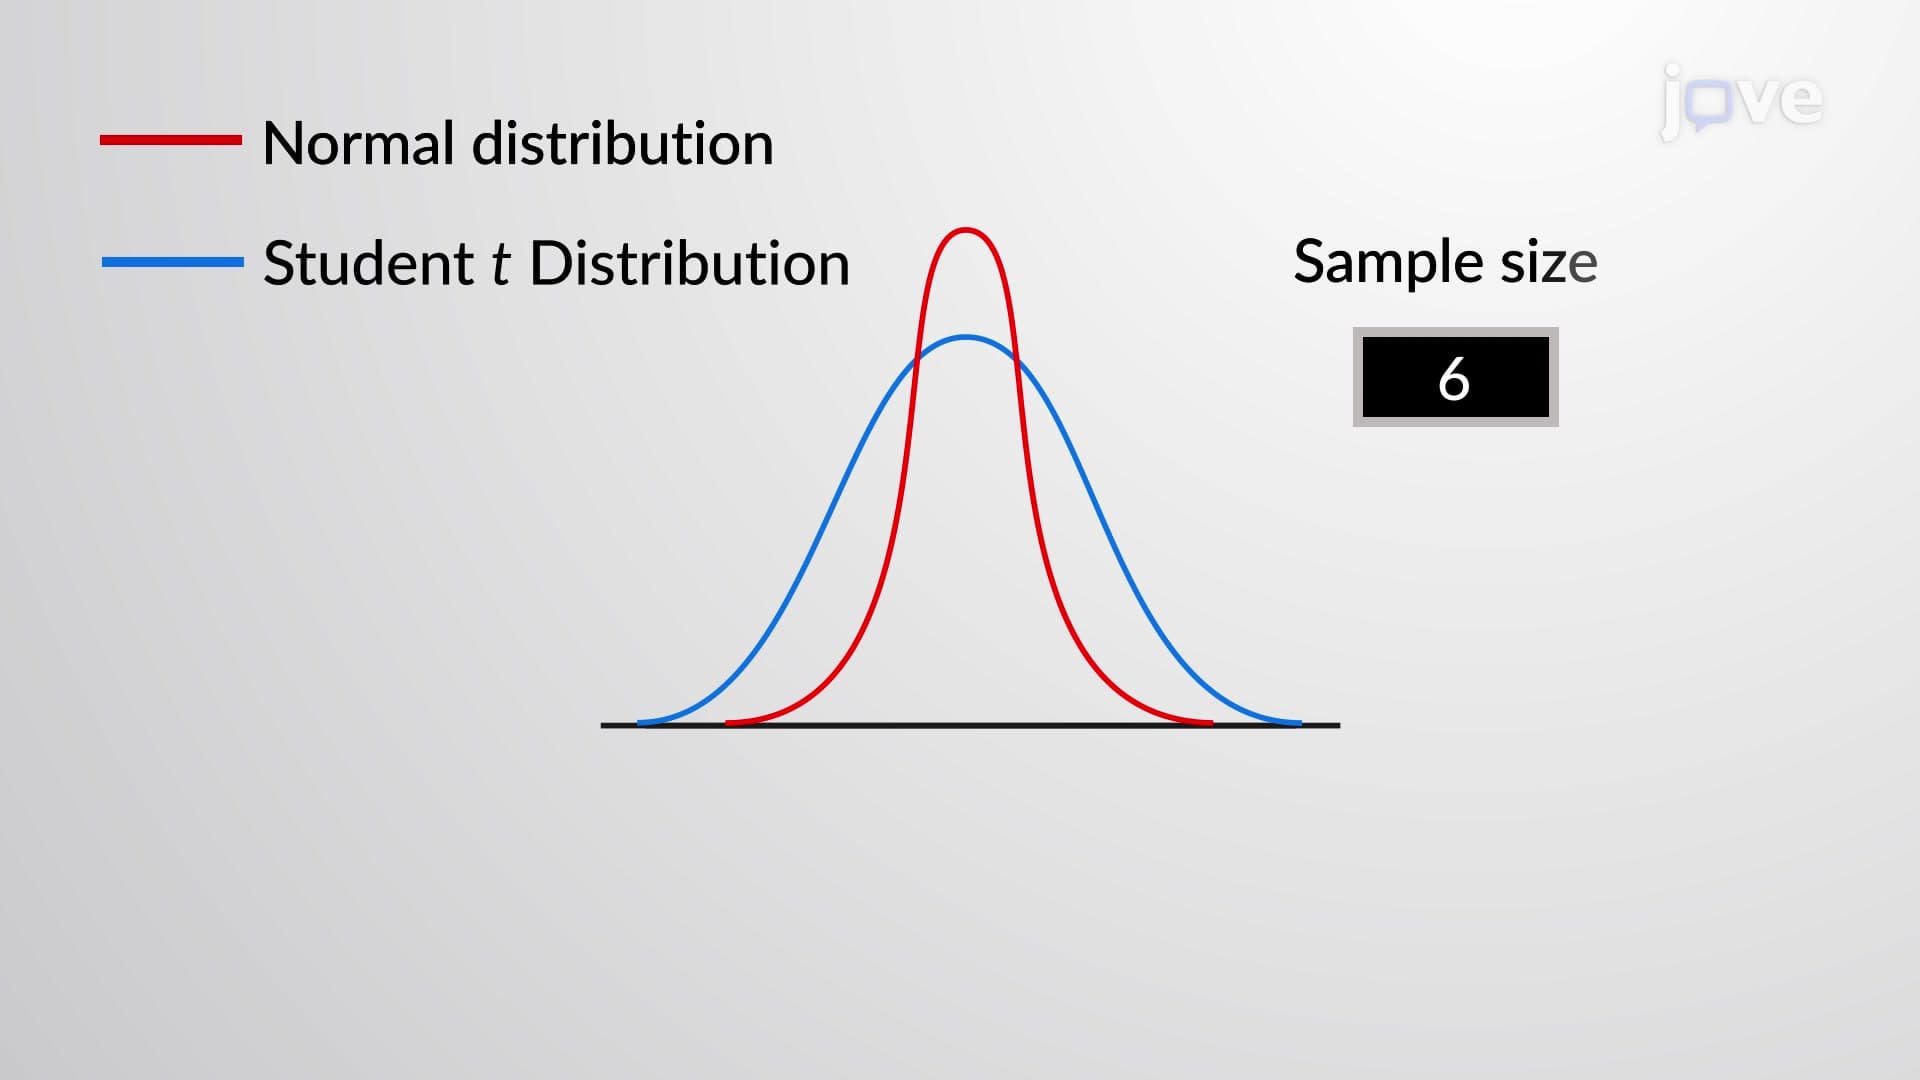
2. T-Distribution Chi-Square Fundamentals and Degrees of Freedom The t-distribution provides accurate statistical inference when population standard deviation is unknown and sample sizes are small. Degrees of freedom, calculated as n-1 for single samples, determine the distribution's exact shape. In clinical trials testing new medications with limited participants, researchers rely on t-distribution properties to construct confidence intervals that properly account for increased uncertainty. The heavier tails compared to normal distribution prevent underestimating variability in small-sample scenarios.
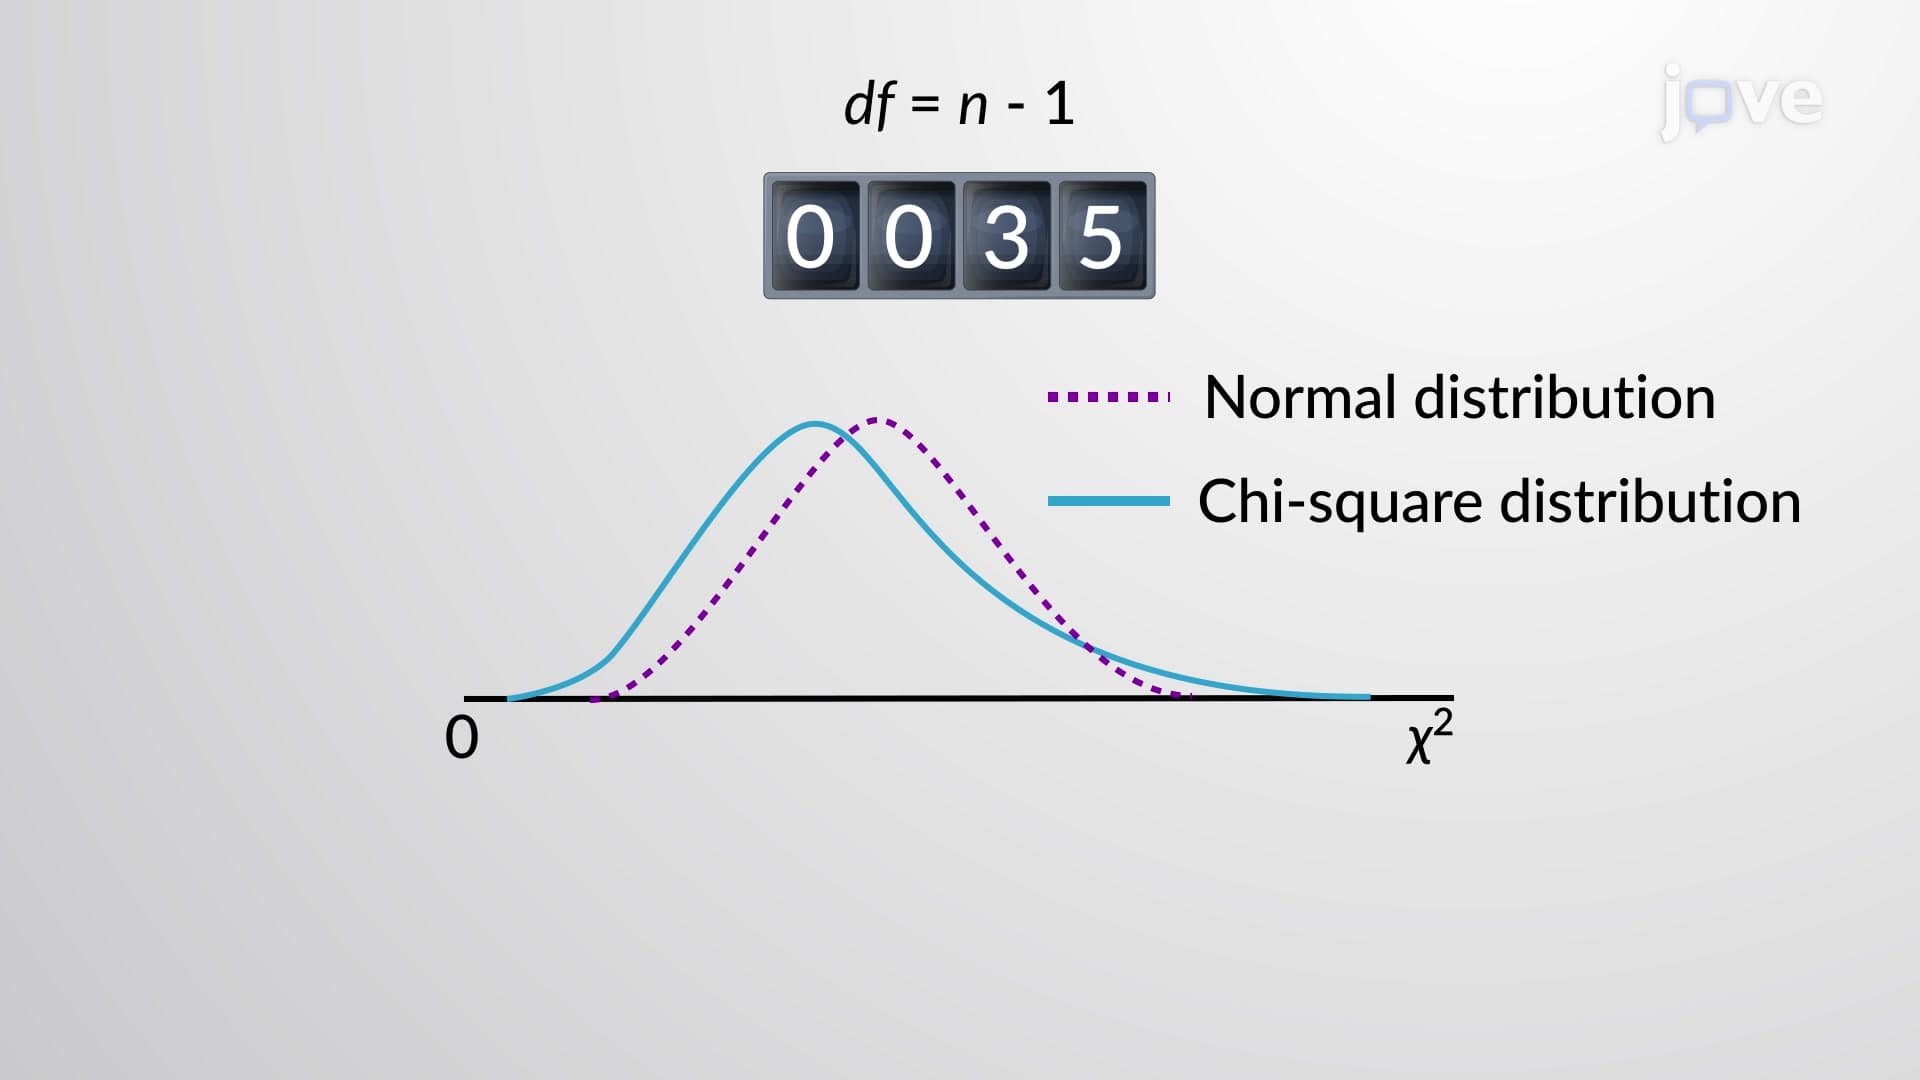
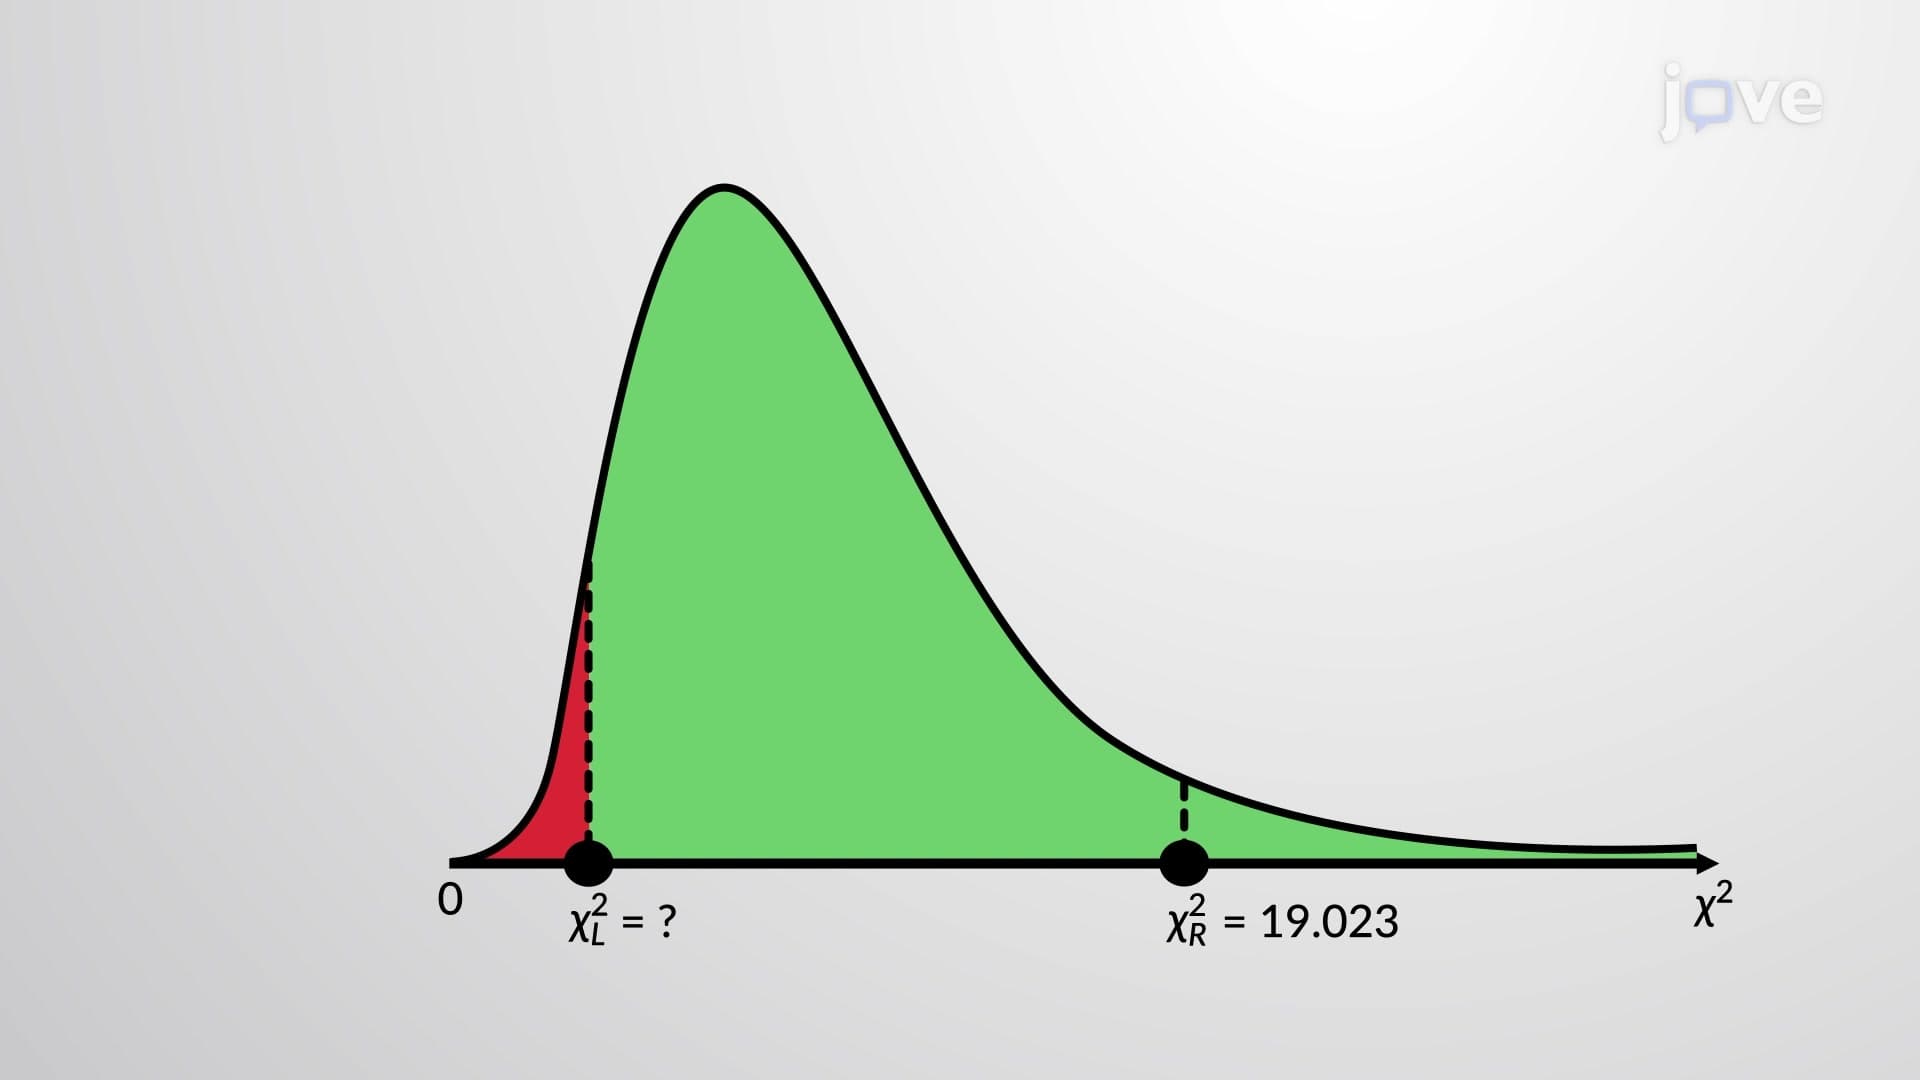
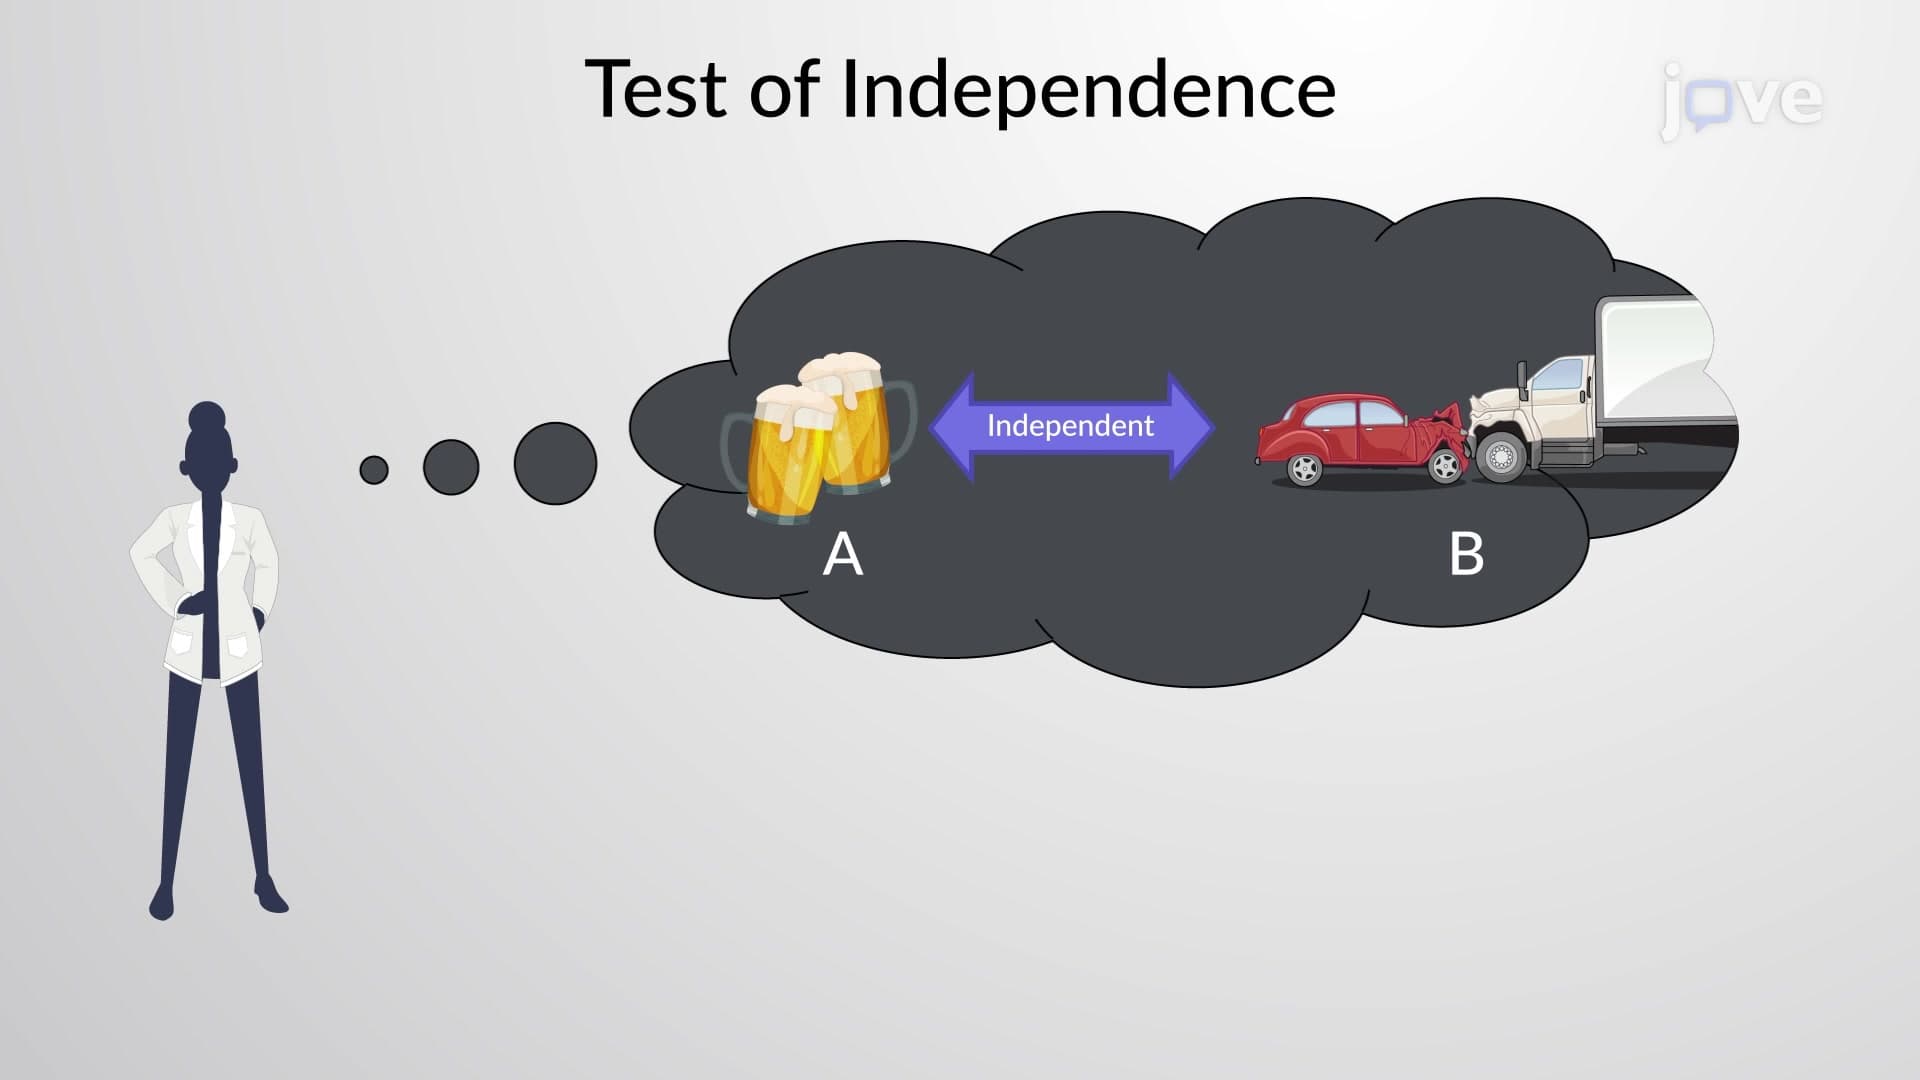
3. Chi-Square Distribution for Variance Testing and Categorical Analysis Chi-square distributions enable testing hypotheses about population variance and analyzing relationships between categorical variables. Unlike symmetric distributions, chi-square is right-skewed with values always non-negative. US quality control managers use chi-square tests to verify manufacturing process consistency, while social researchers apply goodness-of-fit tests to determine if survey responses match expected demographic patterns. The distribution's shape depends heavily on degrees of freedom, approaching normality as df increases beyond 90.
4. F Distribution in Analysis of Variance (ANOVA) The F distribution compares variances between multiple groups, forming the foundation of ANOVA procedures. Defined as the ratio of two chi-square variables divided by their respective degrees of freedom, it helps determine if group means differ significantly. Educational researchers comparing standardized test performance across different teaching methods use F-tests to identify statistically significant differences. The distribution requires two degrees of freedom parameters, making critical value determination more complex than single-parameter distributions.
5. Probability Distributions in Statistical Inference Decision-Making Choosing appropriate distributions depends on sample characteristics and research questions. Z-distribution applies when population variance is known and samples are large, while t-distribution handles unknown variance scenarios. Chi-square tests examine categorical relationships and variance hypotheses, whereas F-distribution compares multiple group variances. Hospital administrators might use z-tests for large patient satisfaction surveys, t-tests for small clinical trials, chi-square for treatment outcome categories, and F-tests when comparing variance across multiple departments.