Loading video…


 15 Concepts
 70K views

Video Summary: What Is Expected Frequencies
Ever wonder how pollsters predict election outcomes or how quality control teams at companies like Ford detect manufacturing defects? The answer lies in understanding expected frequencies, the theoretical values we anticipate in statistical tests when comparing what should happen versus what actually occurs. From predicting the distribution of M&M colors in a factory batch to analyzing SAT score patterns across US high schools, expected frequencies form the foundation of goodness-of-fit testing in statistics. Watch the full video on JoVE Coach to master this concept with expert-led visuals and step-by-step explanations.
Expected frequencies represent the theoretical values we predict would occur in each category of a distribution if our null hypothesis is true. Think of them as the "benchmark" against which we compare our actual observations. When a pharmaceutical company like Pfizer tests a new medication, they establish expected frequencies for side effects based on previous research, then compare these to what they actually observe in clinical trials.
When categories have equal probability, calculating expected frequencies becomes straightforward. The formula is: Expected Frequency = Total Sample Size ÷ Number of Categories. For instance, if you're testing whether a six-sided die is fair by rolling it 120 times, each face should appear 120 ÷ 6 = 20 times. This equal distribution applies to scenarios like predicting coin flips, testing dice fairness, or analyzing customer preferences when no prior bias exists.
Most real-world applications involve unequal expected frequencies because categories don't have equal probabilities. In these cases, Expected Frequency = Total Sample Size × Probability for Each Category. Consider analyzing hair color distribution in the US population: if national data shows 45% brunette, 27% blonde, 18% black, and 10% other colors, and you survey 1,000 people, you'd expect 450 brunettes, 270 blondes, 180 with black hair, and 100 with other colors. This approach is crucial for market research, demographic studies, and medical research applications.
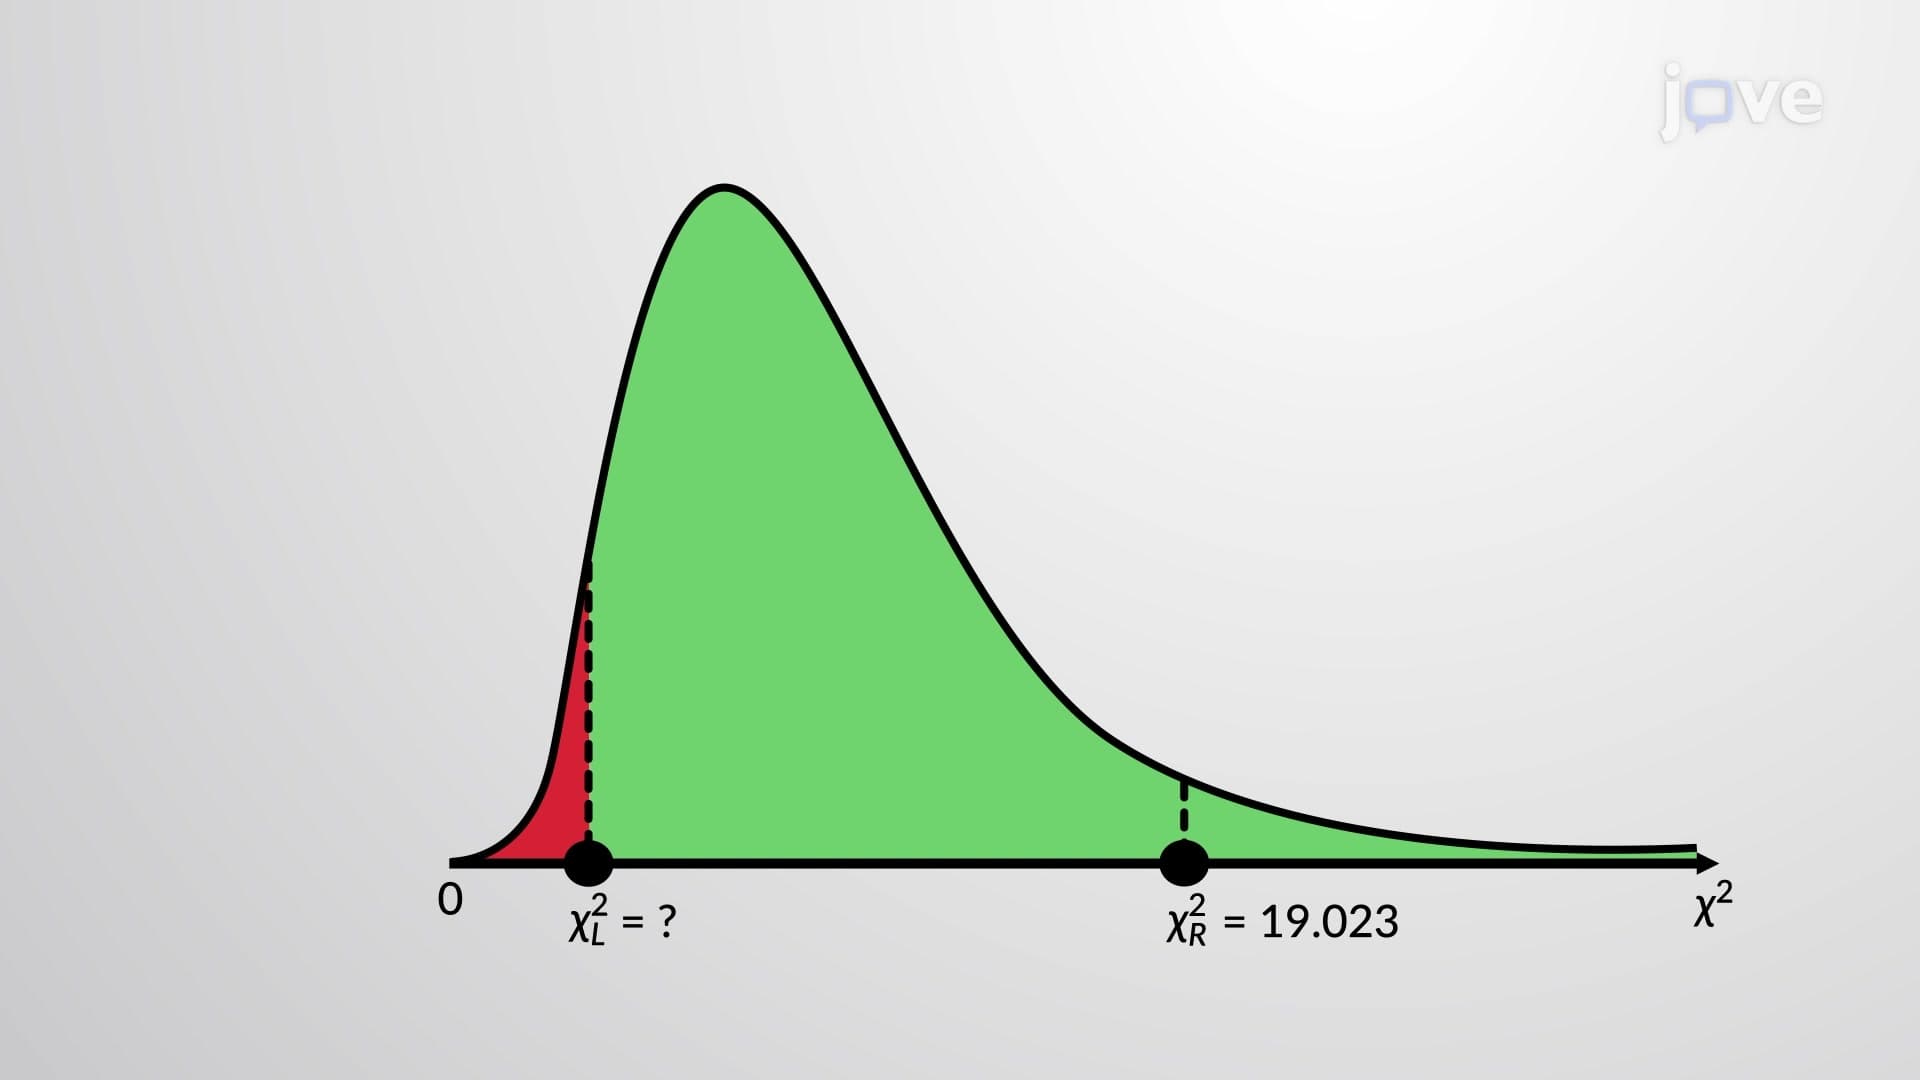
Expected frequencies serve as the foundation for chi-square goodness-of-fit tests, commonly featured in AP Statistics exams and college statistics courses. By comparing expected versus observed frequencies using the chi-square formula, researchers determine whether observed differences are statistically significant or simply due to random variation. Large discrepancies result in high chi-square values and low P-values, leading to rejection of the null hypothesis. This process helps quality control managers at companies like General Mills ensure consistent product distribution, enables pollsters to validate survey methodologies, and allows researchers to test theoretical models against real-world data.
Related Micro-courses