Loading video…


 15 Concepts
 70K views

Video Summary: What Is Estimating Population Standard Deviation
Ever wondered how climate scientists predict temperature variations across the entire United States using data from just a few weather stations? Estimating population standard deviation allows researchers to make these crucial predictions by using sample data to infer characteristics of entire populations. When meteorologists analyze temperature data from select US cities with a sample standard deviation of 1.5°C, they can estimate the true population variability using confidence intervals and chi-square distributions. Watch the full video on JoVE Coach to master this concept with expert-led visuals and step-by-step explanations.
Estimating population standard deviation represents a fundamental inferential statistics technique that allows researchers to make educated guesses about an entire population's variability using only sample data. This concept bridges the gap between what we can observe (sample statistics) and what we want to know (population parameters).
Sample standard deviation rarely equals the true population standard deviation exactly. This estimation bias occurs because samples, even when randomly selected, capture only a portion of the population's full variability. Consider how the College Board analyzes SAT score variations: they cannot test every high school student in America, so they use sample data to estimate national score distribution patterns.
The systematic tendency for sample standard deviation to underestimate population standard deviation stems from the mathematical properties of variance calculation. When dividing by (n-1) instead of n in sample variance formulas, statisticians partially correct for this bias, but uncertainty remains.
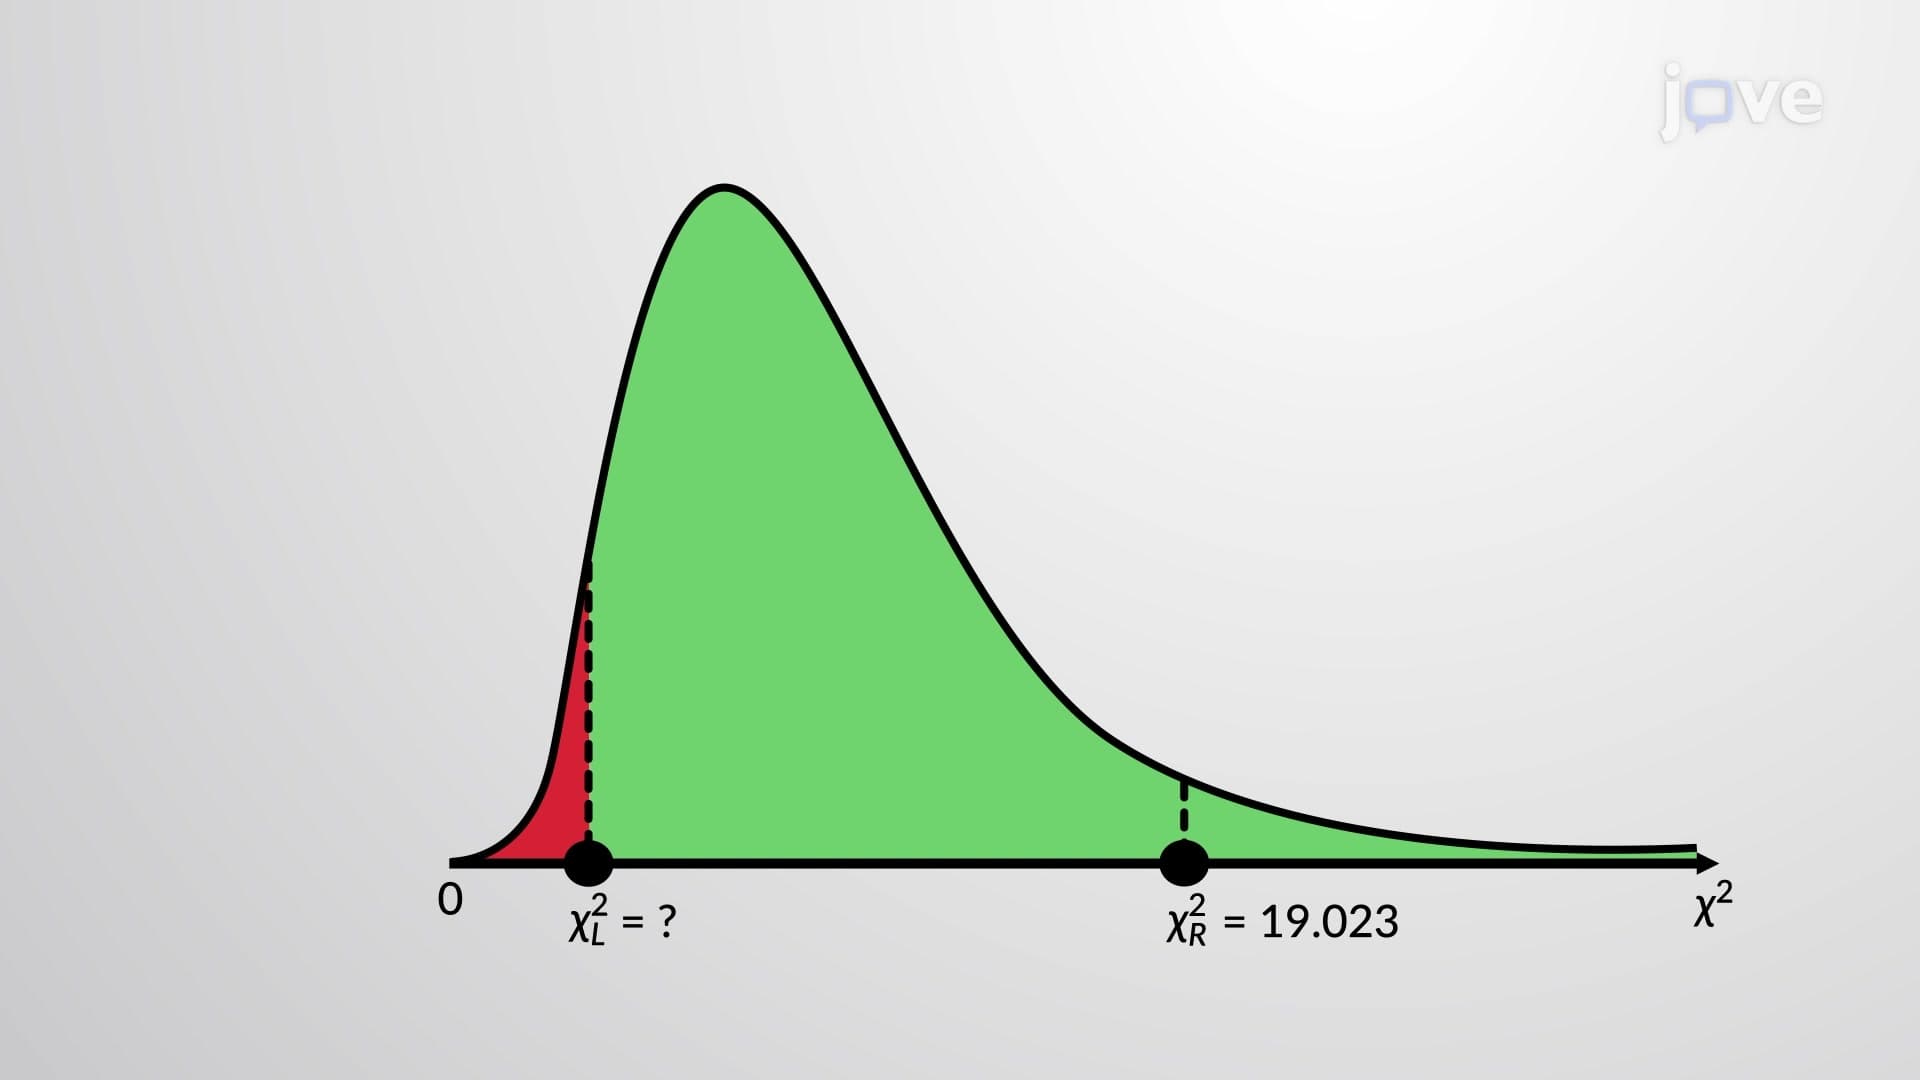
To address estimation uncertainty, statisticians construct confidence intervals using the chi-square distribution. This process involves several critical steps that AP Statistics students encounter regularly:
First, determine appropriate confidence levels (commonly 90%, 95%, or 99%) based on research requirements. Higher confidence levels produce wider intervals but greater certainty that the true parameter falls within the range.
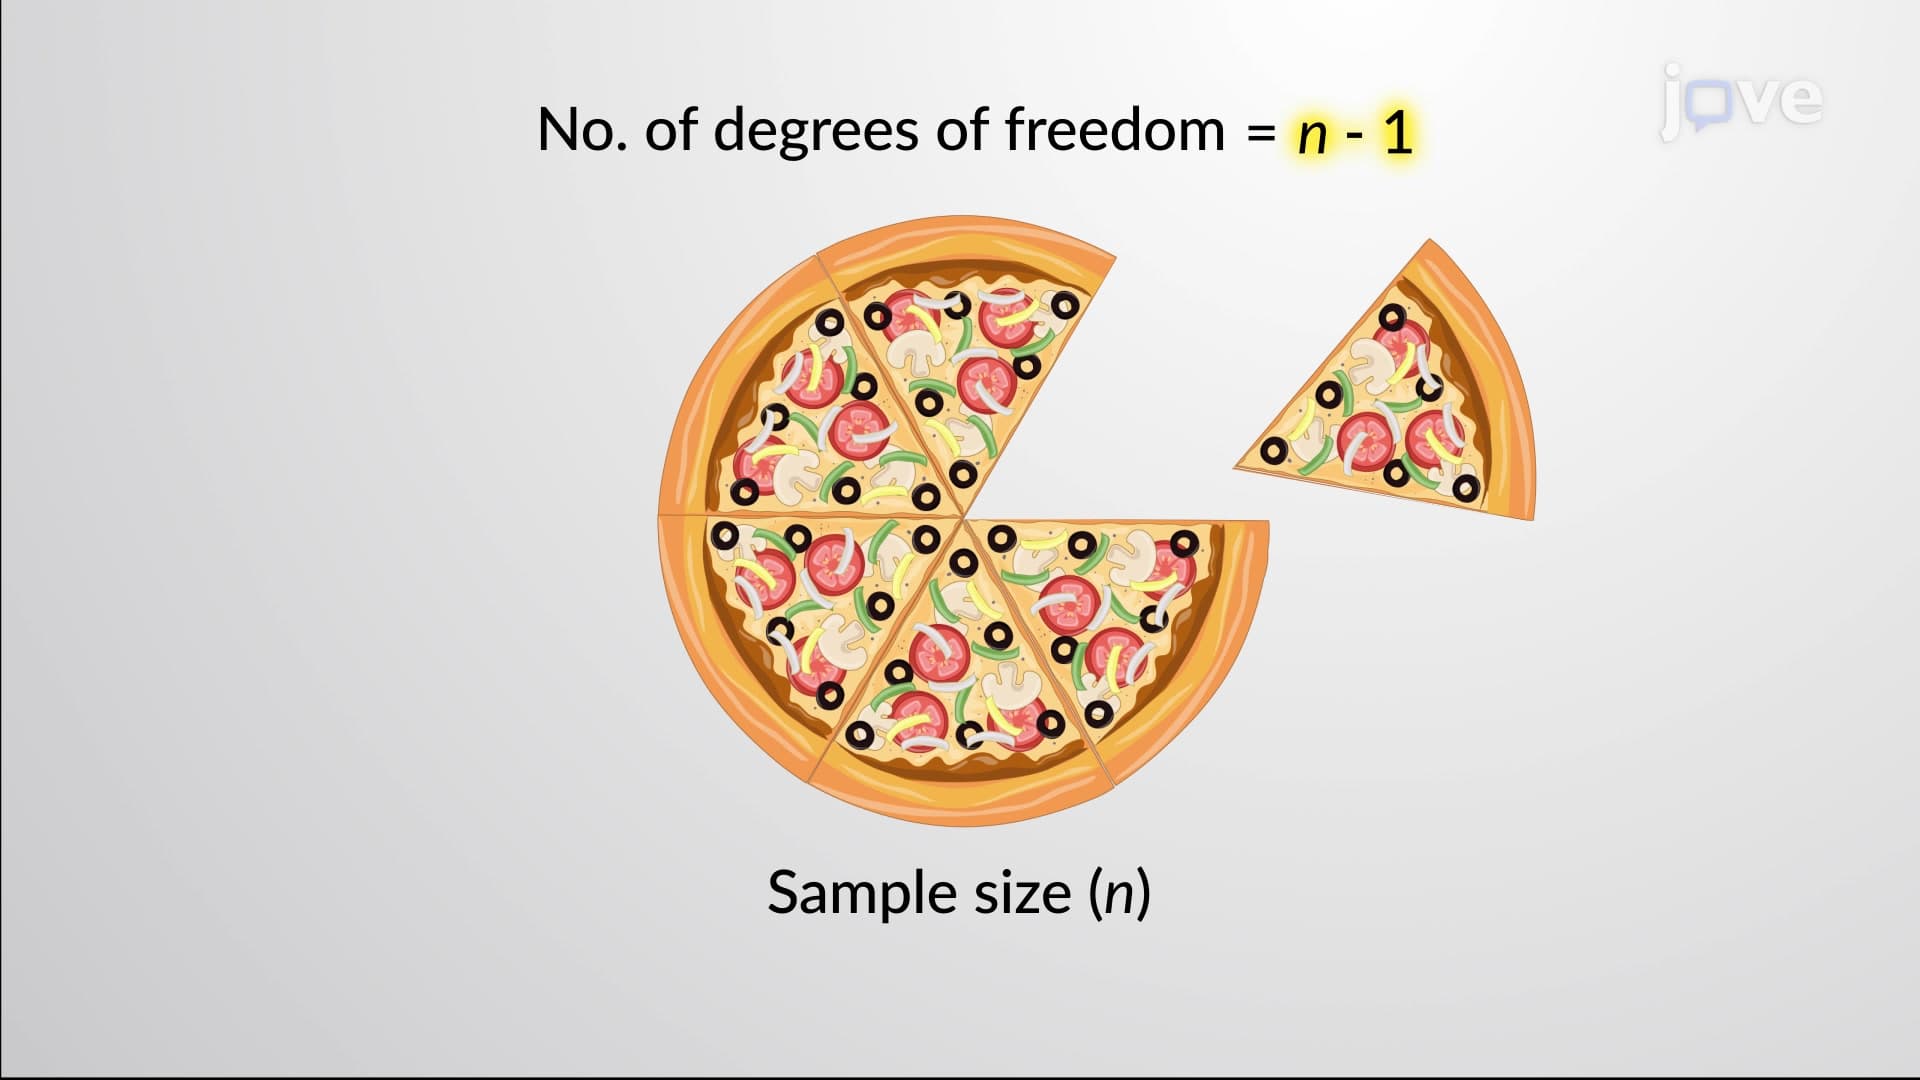
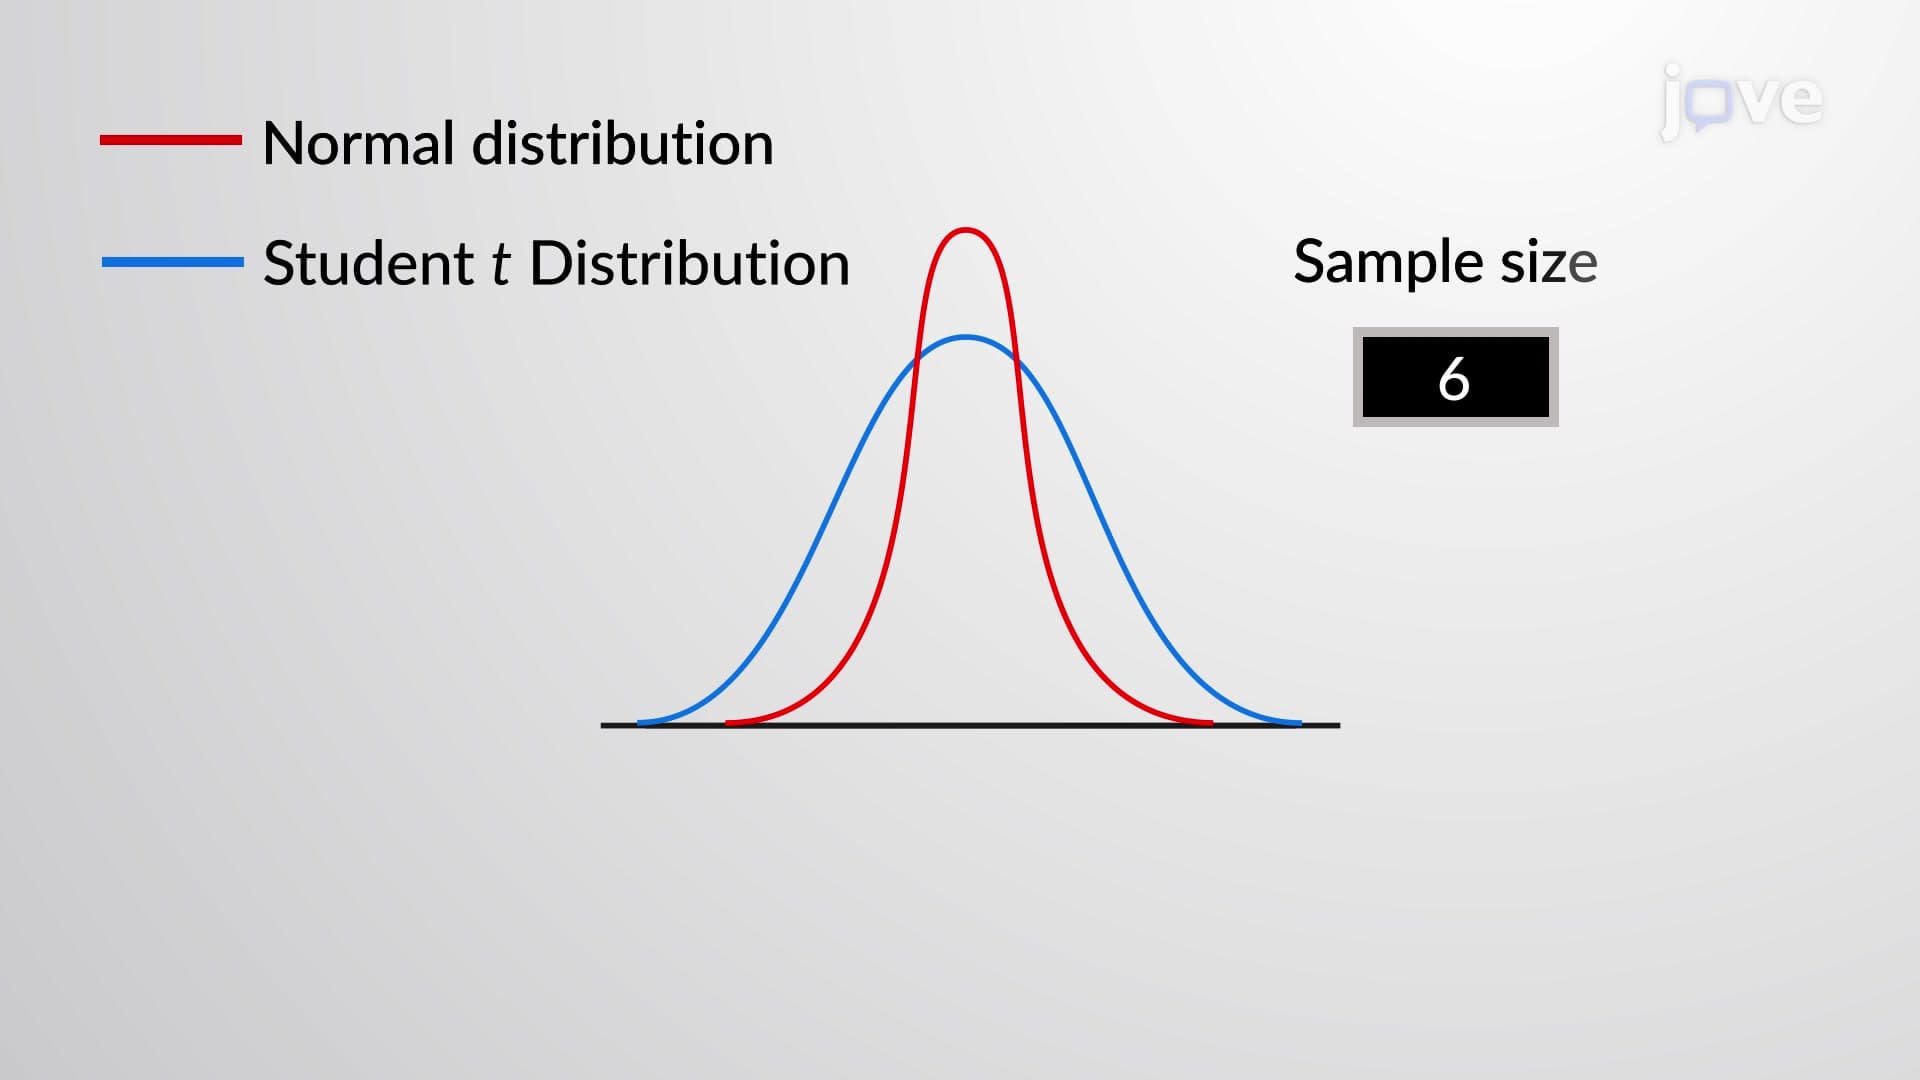
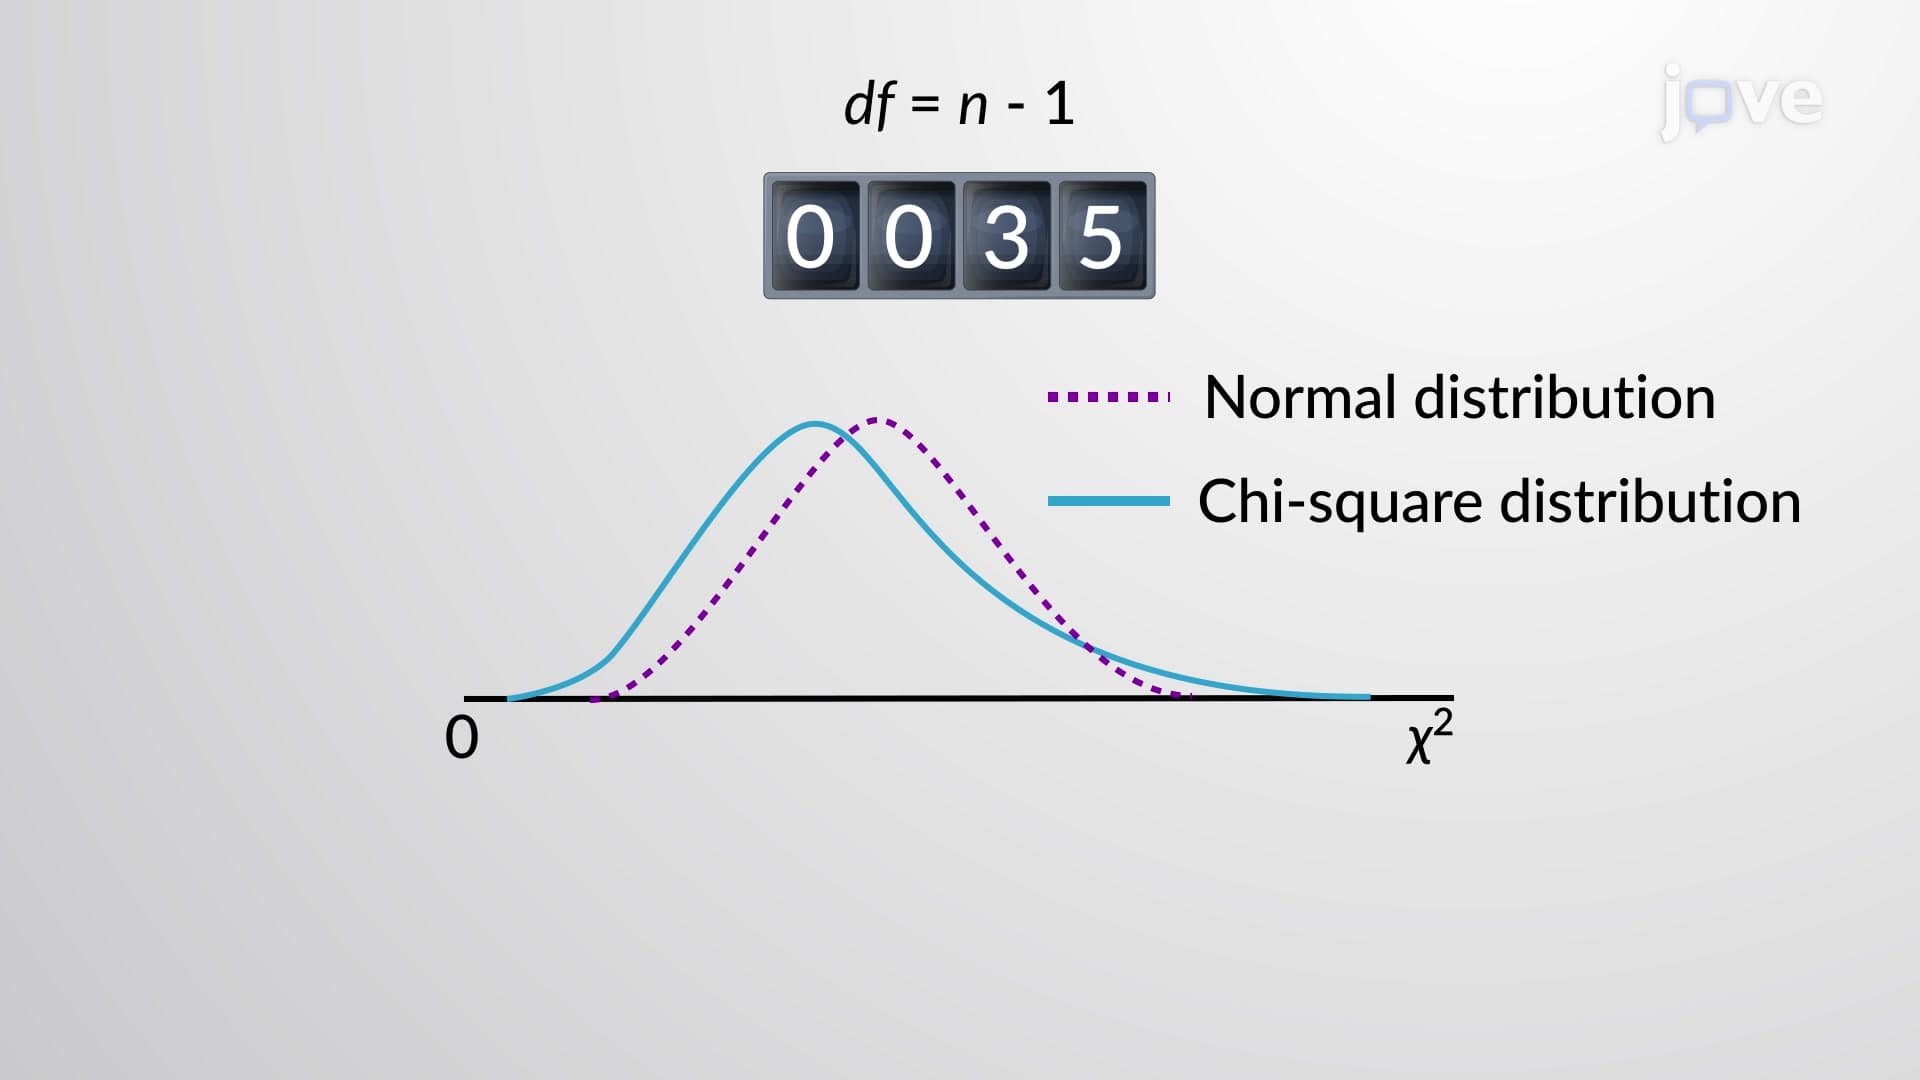
Next, locate critical values from chi-square tables using degrees of freedom (n-1). The chi-square distribution's right-skewed shape creates asymmetric confidence intervals, unlike the symmetric intervals seen with normal distributions.
Quality control engineers at manufacturing companies like Ford or General Electric routinely use population standard deviation estimation to maintain product consistency. When testing engine part tolerances, they cannot measure every component, so they estimate population variability from sample measurements.
Medical researchers studying blood pressure medications for the FDA use similar techniques. By analyzing patient samples in clinical trials, they estimate how much blood pressure reduction might vary across the entire US population taking the medication.
Students preparing for the MCAT or nursing entrance exams like HESI A2 and TEAS frequently encounter these concepts in biostatistics questions, where understanding estimation principles helps interpret research study results and clinical data analysis.
Related Micro-courses